Abstract
Myeloid-derived suppressor cells (MDSCs), which include neutrophilic MDSCs and monocytic MDSCs, exhibit high immunosuppressive activity. Glycosylphosphatidylinositol-anchored 80 kD protein (GPI-80) is selectively expressed on mature neutrophils in healthy individuals. Increased GPI-80 expression on monocytes and variations in GPI-80 expression on neutrophils indicate the appearance of MDSCs in the peripheral blood of cancer patients. However, it is still unclear whether GPI-80 expression on myeloid cells, neutrophilic MDSCs and monocytic MDSCs, is correlated with the clinical outcomes of patients with cancer. In this study, we investigated the characteristics of myeloid cells expressing GPI-80 and the implication of GPI-80 expression in the clinical outcomes of patients with metastatic renal cell carcinoma (mRCC), in which primary renal cell carcinoma spreads from the kidney to other organs. The study included 20 patients with mRCC (a mean age of 66.0 years) and 16 healthy volunteers (a mean age of 47.8 years). To determine the heterogeneity of myeloid cells in peripheral blood samples, we performed the three-dimensional principal component analysis using the combination of GPI-80, CD16, and latency-associated peptide-1 (LAP), derived from the N-terminal region of transforming growth factor-β1 precursor. The results showed that myeloid cells in mRCC patients were widely distributed and clearly distinguishable from those in the healthy volunteers. The survival analysis revealed that GPI-80 expression on neutrophils and monocytes was correlated with poor prognostic outcomes of patients with mRCC. In conclusion, the expression of GPI-80 on myeloid cells, a useful index for the heterogeneity of MDSCs, serves as a potential prognostic biomarker for mRCC.
Introduction
The immune system eliminates dangerous foreign bodies and tumor cells. In order to maintain this system, there are various feedback mechanisms to suppress the self-responsiveness and histological damage. One of the feedback mechanisms is induction of myeloid-derived suppressor cells (MDSCs) that prevent excessive inflammation and contribute to successful pregnancy (Ben-Meir et al. 2018; Veglia et al. 2018). Unfortunately, MDSCs inhibit antitumor immunity via suppression of T-cell proliferation and cytotoxicity, inhibition of NK cell activation, and expansion of regulatory T cells (Albeituni et al. 2013). Furthermore, a previous study has shown the involvement of MDSCs in tumor escape from antiangiogenic drug resistance (Finke et al. 2011). Suppression of MDSCs is, therefore, a promising target for effective cancer immunotherapy (Albeituni et al. 2013).
MDSCs consist of two large groups of cells: neutrophilic MDSCs and monocytic MDSCs. Recently, lectin-like oxidized LDL receptor-1 (LOX-1) has been demonstrated as a useful marker for human neutrophilic MDSCs (Veglia et al. 2018). However, according to the history of MDSC identification (Solito et al. 2014), MDSCs are considered as heterogeneous cell populations, and the discrimination between monocytes and monocytic MDSCs remains difficult.
Metastatic renal cell carcinoma (mRCC) is one of the most studied cancers with respect to MDSCs (Ko et al. 2009; Solito et al. 2014). The presence of intratumoral neutrophils in primary tumors and the increase in peripheral blood neutrophils are reported as poor prognostic factors in mRCC patients (Donskov et al. 2006; Donskov and von der Maase 2006). In addition, it has been reported that the existence of intratumoral macrophages (derived from monocytes) correlates significantly with poor overall survival (OS) (Komohara et al. 2011). Thus, neutrophils and monocytes/macrophages are presumed to be novel factors related to the prognosis of mRCC patients, and these cells are suggested to act as MDSCs.
Furthermore, mRCC is one of the most lethal malignant diseases, which is resistant to conventional chemotherapy, radiotherapy, and hormonal therapy. Recently developed molecular targeted drugs and immune checkpoint inhibitors have improved OS period of mRCC patients in Japan, extending from 21 months in the cytokine era to 27 months in the target era (Naito et al. 2010; Shinohara et al. 2015); however, it is not feasible to completely curb mRCC with any drug at this stage, and the majority of patients become refractory to treatment, leading to cancer-related death. It is, therefore, necessary to establish a new diagnostic method, including biomarkers and novel treatment approaches for mRCCs.
Recent advances show that expansion of myeloid cells (neutrophils and monocytes) is important to tune the immune reaction (Nicolas-Avila et al. 2017). In this study, we focused on the maturation markers of neutrophils, CD16 and glycosylphosphatidylinositol-anchored 80 kD protein (GPI-80) (Takeda et al. 2003) and assessed the correlation between these markers and OS of mRCC patients.
Methods
Patients with mRCC
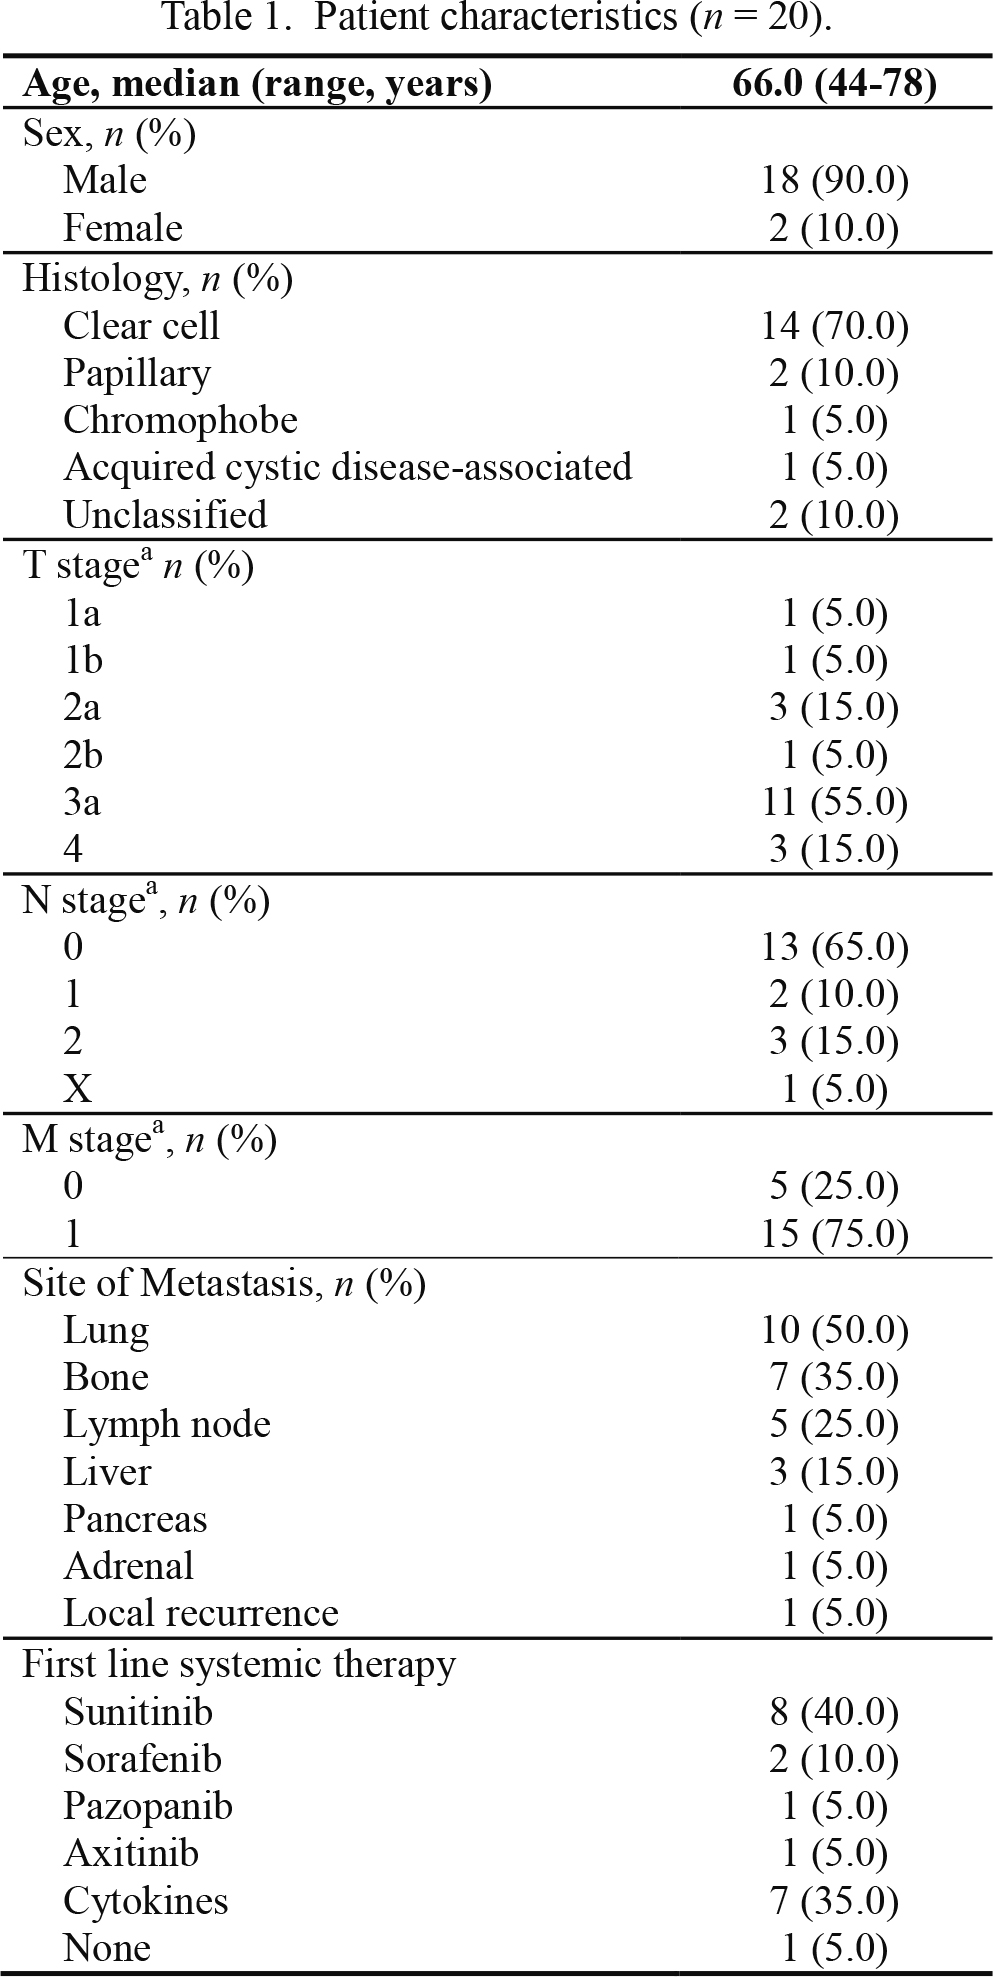
This study was approved by the Ethics Committee of Yamagata University, Faculty of Medicine (No. 2014-15). The subjects of this study included a cohort of 20 patients who were diagnosed with mRCC at the Department of Urology in Yamagata University Hospital between October 2014 and November 2017. All included patients and healthy volunteers provided their written informed consent and their information was recorded and registered in our registry system. Detailed characteristics of patients are presented in Table 1. Among the included mRCC patients, 18 were males and two were females, with a mean age of 66.0 years and a range of 44-78 years. Nineteen patients received systemic therapy with cytokines or molecular targets. The clinical stages of the patients were classified according to a couple of commonly implemented systems, namely the Modified Robson’s system and the TNM (tumor node metastasis) system. Data for OS were obtained from the medical records of these patients. The mean follow-up periods were 18.7 months (range 3.2 to 42.0 months) and during follow-up eight patients died (40.0%). Healthy volunteers included 14 males and two females, with a mean age of 47.8 years and a range of 44-55 years.
Peripheral blood (5-10 mL, heparinized with 5 U/mL low-molecular-weight heparin) was collected on the day of the clinical treatment start date and just before the treatment start. Blood from healthy volunteers was collected on the same day of the blood collection from patients. In this study, blood was stored at room temperature before being aliquoted for antibody reaction. In order to avoid neutrophil activation by the leukocyte separation, antibody reactions were performed in whole blood as described previously (Takeda et al. 2014). Furthermore, it is known that platelets are activated by cold stock (4℃), which form a complex of leukocytes with platelets (Duvigneau et al. 2003; Ayukawa et al. 2009). Due to this, we chose a method that produces less temperature change. These samples were preserved at 20℃ to 25℃, and then, used for experiments within 12 h.
Cell surface staining
Whole blood cells were stained with antibodies, as described previously (Takeda et al. 2003; Takeda et al. 2014). Briefly, whole blood was aliquoted into microtubes (50 μL of blood per tube) and incubated with Fc Blocker (BioLegend, San Diego, CA, USA) for 5 min. After blocking the Fc receptors, whole blood was incubated with each antibody for 30 min at 4℃, and then, treated with prewarmed BD Phosflow Lyse/Fix buffer (1 mL; BD Biosciences, San Jose, CA, USA) for 10 min at 37℃ to lyse the red blood cells (RBCs) and fix white blood cells (WBCs). After washing with PBS, the cells were measured via flow cytometry using FACSCanto II (BD Biosciences). For morphological observations, the red blood cells were hemolyzed using ammonium chloride buffer, and then, each myeloid cell was sorted using FACSAria (BD Biosciences). The antibodies used in this study were as follows: PE-conjugated anti-CD16 mAb (3G8) and APC-conjugated anti-HLA-DR mAb (G46-6) from BD Biosciences; Brilliant violet 421-conjugated anti-CD33 mAb (WM53) from BioLegend; APC-conjugated anti latency-associated peptide-1 (LAP; the N-terminal region of transforming growth factor-β1 precursor) mAb (#27232) from R&D systems (Minneapolis, MN, USA); PE- or FITC-conjugated anti-GPI-80 mAb (3H9) from MBL (Nagoya, Japan) or originally prepared, as previously described (Ohtake et al. 1997; Suzuki et al. 1999). For the isotype-matched control mAbs, IgG1 (MOPC-21) and IgG2a controls (G155-178) were obtained from BD Biosciences. The mean of fluorescence intensity (MFI) and robust coefficient variation (CV) were analyzed using FlowJo software version 7.6.5 (TreeStar, Ashland, OR, USA), as described previously (Takeda et al. 2016).
Comprehensive analysis of RNA
Polymorphonuclear leukocytes (PMNs) were separated from peripheral blood using Ficoll-Paque (GE Healthcare Life Sciences, Pittsburgh, PA, USA), and the total RNA was purified from PMNs via an RNeasy Micro Kit (QIAGEN, Hamburg, Germany), as described previously (Takeda et al. 2014). Blood (10 ml) was collected from each patient; however, the amount of total RNA from PMNs was little (approximately < 50 ng from 2 to 8 × 10⁶ PMNs) compared with other types of cells. Thus, we mixed the RNA from five independent patient samples (average age: 67.2 ± 7.2 years) and compared this mixture with the RNA mixture from four healthy volunteer samples (average age: 52.4 ± 4.6 years). The mixed RNA (300 ng) was reverse transcribed and amplified twice using Amino Allyl MessageAmp™ II aRNA Amplification kit (Life technologies, Carlsbad, CA, USA). A comprehensive analysis of mRNA using 3D-Gene® was performed by Kamakura Techno-Science (TORAY Group, Kamakura, Japan). The gene ontology (GO) analysis was performed by utilizing the Laboratory of Life system information (Tohoku chemical Co. LTD., Hirosaki, Japan).
Quantitative reverse transcription-polymerase chain reaction (qRT-PCR)
RT-PCR was performed, as described previously (Takeda et al. 2014). In this study, ReveTra Ace qPCR RT Master Mix with gDNA Remover kit (TOYOBO, Osaka, Japan) and SYBR Premix Ex Taq II (Takara Bio, Kusatsu, Japan) were used for RT-PCR, and then the quantification of PCR was measured with HT7300 (ABI Prism, Thermo Fisher Scientific, Waltham, MA, USA). The conditions for PCR were as follows: hot-start, 95℃, 30 s; denaturation, 95℃, 5 s; annealing, 60℃, 31 s; and extension, 72℃, 30 s. Each relative value was calculated via the 2−ΔΔCt method using the Ct of glyceraldehyde-3-phosphate dehydrogenase (GAPDH) on each sample and Ct-average of GAPDH on healthy volunteers. The primer pairs used were as follows: defensin-α4, 5′-TCG CCC TGC CTA GCT TGA GG-3′ and 5′-CGA CAC GCG TGC AGC AGT ATG-3′; Family with sequence similarity 120A (FAM120A), 5′-CAC AGC AGA TCG TCA GCC ATG TCC-3′ and 5′-AGG AAA ACG ATT TGG ATT CAG GTC C-3′; Granulysin, 5′-CGA CCT GGC AAG AGC CCA CCT GCG-3′ and 5′-CCT GAG GTC CTC ACA GAT CTG CTG-3′; serglycin, 5′-GGA GAG CCA GGT ACC AAT GGG TGC-3′ and 5′-CCT GGC TGT CTG AGG GCA GAT TCC-3′; Solute carrier family 11 member 1 (SLC11A1), 5′-AGG TCG TCA CCT CTT CCA TCA TGG-3′ and 5′-TCC ACA TCC AGC AGG CCA GTC ACG-3′; β-glucuronidase, 5′-TTC TTA GCG CCG CAG ACG GT-3′ and 5′-CGC TCC GGC AGG ATC ACC TC-3′; GAPDH, 5′-CAT GGG GAA GGT GAA GGT CGG-3′ and 5′-ACG AAC ATG GGG GCA TCA GC-3′.
Statistical analysis
The two groups were compared using the Mann-Whitney test. To study OS, Kaplan-Meier curves and the log-rank test were used. Multivariable Cox regression analysis was performed to determine the variables impacting OS. OS was defined as the time from blood sample collection immediately before starting the clinical therapies to death from any cause. These statistical analyses were performed using Prism Software version 5.03 (GraphPad Software, San Diego, CA, USA). A value of p < 0.05 was considered as statistically significant. Principal component analysis (PCA) was performed using EZ-R software version 1.36 (Saitama Medical Center, Jichi Medical University, Saitama, Japan), which is a graphical interface for R (The R Foundation for Statistical Computing, Vienna, Austria). A modified version of R commander was used (Kanda 2013).
Results
Augmentation of CV and MFI of GPI-80, CD16, and LAP in myeloid cells from mRCC patients
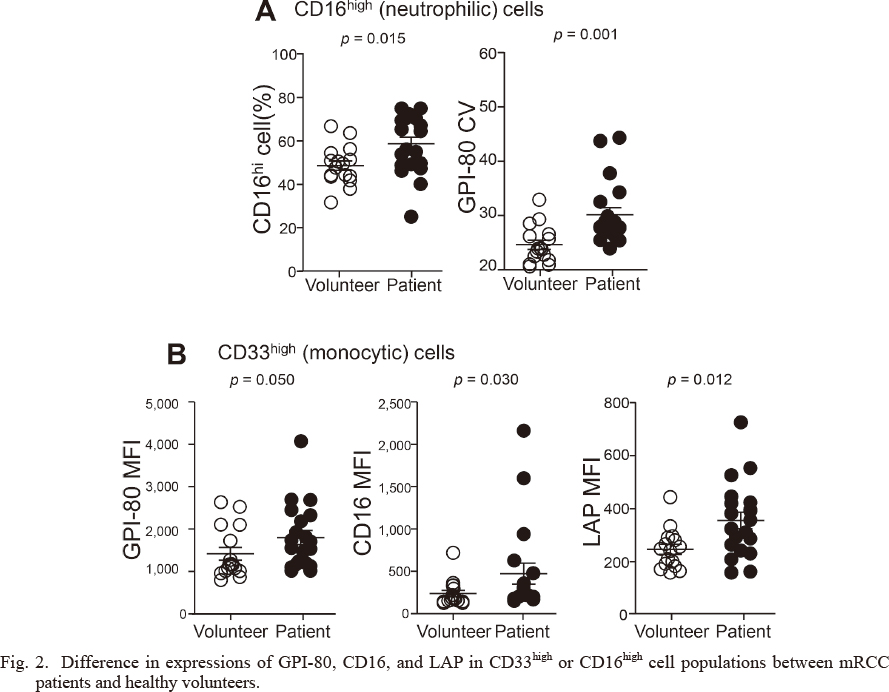
Previously, we reported the simple characteristics that can be used to differentiate myeloid cells from peripheral blood (Takeda et al. 2016). According to the morphological observation of sorted cells, the CD33high population mainly included monocytic cells, and the CD16high population included neutrophilic cells (Fig. 1). These observations indicate that such markers, including CD33 and CD16, are useful for separating myeloid cells. We then showed the significant increases in CD16high neutrophilic cells (%), GPI-80 CV of CD16high cells (Fig. 2A), and MFI of GPI-80, CD16, and LAP in CD33high monocytic cells (Fig. 2B) in mRCC patients compared with healthy volunteers, which is consistent in part with our pilot study (Takeda et al. 2016).
Principal component analysis (PCA) reveals the characteristics of myeloid cells in mRCC patients
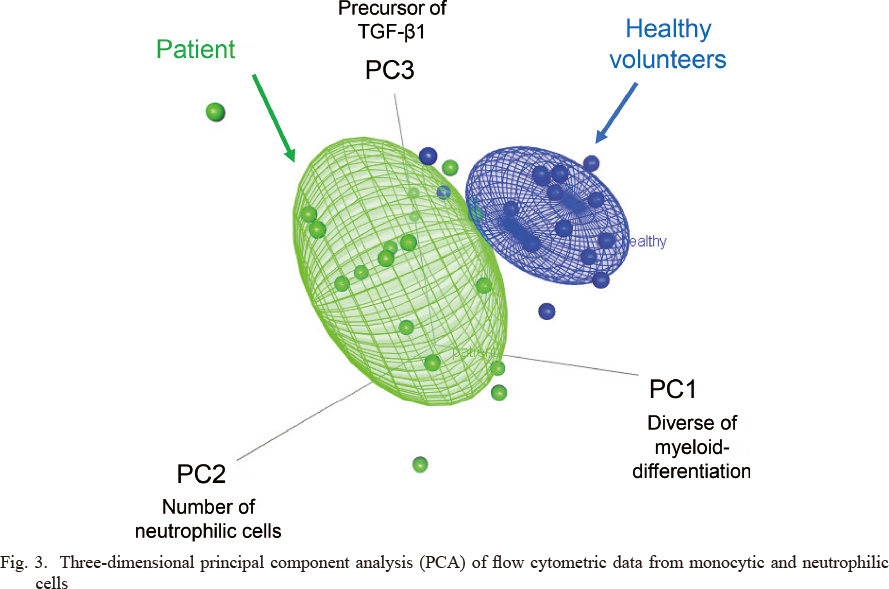
To confirm the heterogeneity of myeloid cells (neutrophils and monocytes) between the patients and the healthy volunteers, five characteristics were evaluated for PCA. The results of principal component loadings are listed in Table 2, and the distribution of each component is indicated in Fig. 2. The principal component loadings indicate the contribution to principal component (PC) 1, PC 2, and PC 3, thereby creating the axis of the three-dimensional graph with stratification by healthy volunteers and mRCC patients (Fig. 3). PC 1 mainly comprises GPI-80 CV of CD16high cells, and MFI of GPI-80 and CD16 in CD33high cells (Table 2). The increase in GPI-80 CV indicates abnormal differentiation of neutrophils, and the increase in GPI-80 MFI and CD16 MFI in CD33high cells suggests the augmentation of ectopic-neutrophilic antigen expression in the monocytic cell population. Thus, PC 1 presents the heterogeneity of myeloid cells. The percentage of CD16high cells mainly contributed to PC 2 in patients, which suggests an increase in the neutrophilic cell number in the peripheral blood (Table 2). LAP MFI mainly contributed to PC 3, which represents suppressive immune responses (Table 2). In the three-dimensional field, myeloid cells in patients were widely distributed and clearly distinguishable from those in the healthy volunteers.

Furthermore, we assessed the effect of the characteristics representing the heterogeneity in peripheral blood of mRCC patients on the OS. As presented in Fig. 4, the Kaplan-Meier survival analysis revealed significant association of higher GPI-80 MFI (> 1,625) in CD33high cells, higher CD16 MFI (> 250) in CD33high cells, and higher GPI-80 CV (> 29.1) of CD16high cells with decreased OS (p = 0.0143, p = 0.010, and p = 0.007, respectively). As mentioned, the characteristics (GPI-80 MFI of CD33high cells, CD16 MFI of CD33high cells, and GPI-80 CV of CD16high cells) mainly comprise of PC 1, as presented in Fig. 3 and Table 2. Thus, the heterogeneity expressed by PC 1 is correlated with OS. Furthermore, multivariate Cox regression analysis identified a high GPI-80 MFI population in the CD33high cells (> 1,625) as an independent poor prognostic factor (Table 3; hazard ratio: 14.0; p = 0.043).
A comprehensive analysis of mRNA expression in PMN
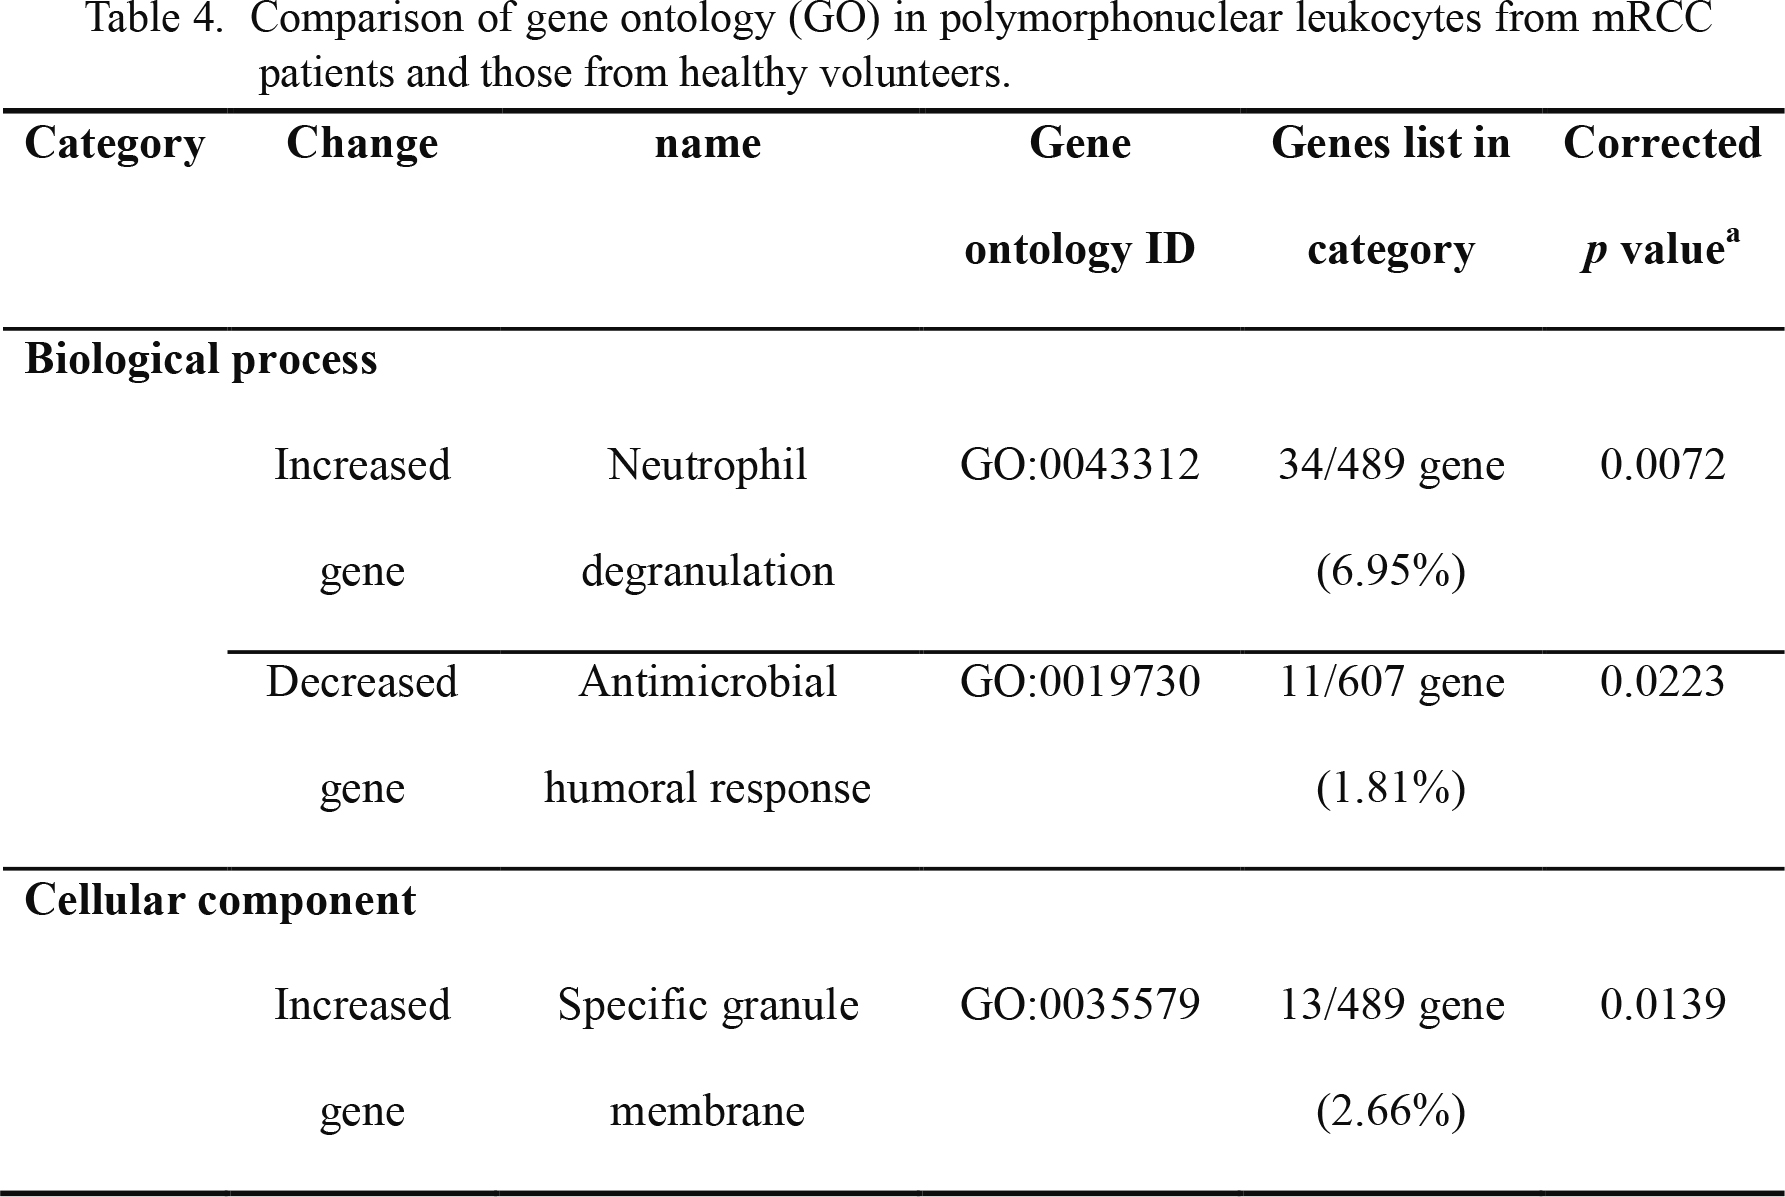
In our experiment, 19,176 signals out of 24,460 genes were detected and analyzed. The genes with expression levels that were twice as high or higher in patients than in healthy volunteers were listed as upregulated genes, and those in patients with expression levels that were less than half of those in healthy volunteers were regarded as downregulated genes. These genes of altered expression were used for GO analysis. A summary of the GO analysis is presented in Table 4, and the list of the increased genes was significantly similar to the GO terms “neutrophil degranulation” and “specific granule membrane.” The list of decreased genes was similar to the GO term “antimicrobial humoral response.” These analyses suggested that the degranulation (or secretion) ability might be augmented without the antimicrobial response in the patient PMNs.
Secreted molecules related with antimicrobial or anti-inflammatory responses
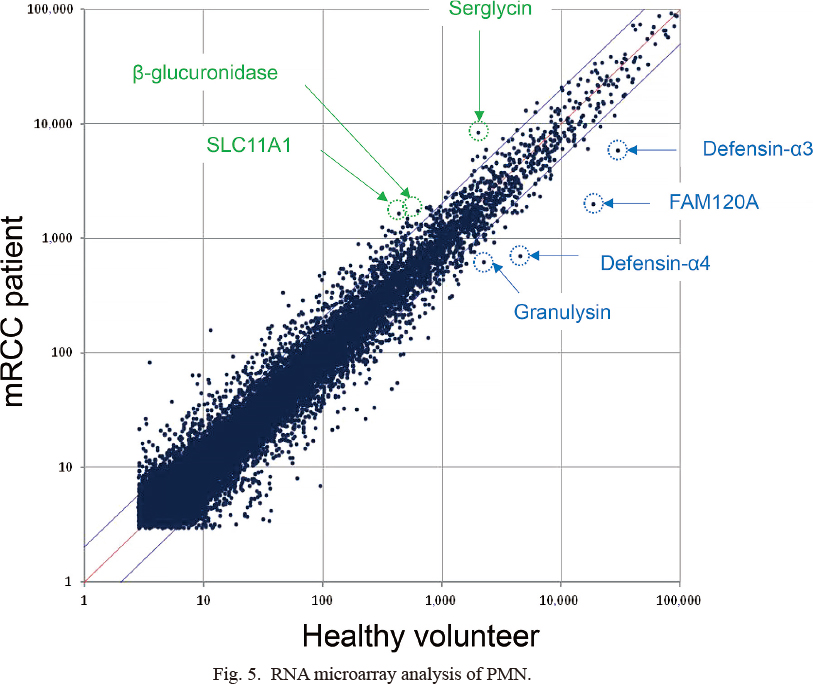
The mRNA expression levels of β-glucuronidase, serglycin, and solute carrier family 11 member 1 (SLC11A1) in the patient sample mixture were greater than those in the healthy volunteer sample mixture. In contrast, the mRNA expression levels of α-defensins, granulysin, and family with sequence similarity 120A (FAM120A) in the healthy volunteer samples were higher than those in the patient samples (Fig. 5). β-glucuronidase modulates arthritis pathogenesis by preventing accumulation of proinflammatory glycosaminoglycans within inflamed joint tissue (Bramwell et al. 2014), whereas granulysin is known as a cytotoxic granule related to cancer progression (Kishi et al. 2002; Ogawa et al. 2003). Furthermore, α-defensins are well-known antibacterial peptides (Ganz 2003), and serglycin prevents the potential toxic effects of extracellular α-defensins (Glenthoj et al. 2011). No discrepancy was observed between these mRNA changes and the GO analysis. Thus, these previous reports allowed us to speculate that the upregulation of β-glucuronidase and serglycin or downregulation of granulysin and α-defensins in PMNs might act as a marker for the function of MDSCs.
Although it is important to select age-matched subjects for RNA preparation, age was not matched in this study. To solve this problem, we re-measured the mRNA levels of the anti-inflammatory molecules (serglycin, β-glucuronidase, and SLC11A1) by qRT-PCR. There was no significant difference in the mRNA expression between patients and healthy volunteers. However, the expression levels of serglycin and SLC11A1 mRNAs were quite different among samples from the patients (Fig. 6). These results suggest that the expression of the candidate molecules related with function of MDSCs might be changed according to the individual inflammatory status.
Discussion
The heterogeneity of myeloid cells (neutrophils and monocytes) can be presented by PCA using GPI-80, CD16, and LAP. GPI-80 CV, GPI-80 MFI, and CD16 MFI are the main components of PC 1. Previously, we reported that GPI-80 CV of neutrophilic cells inversely correlated with the T-cell proliferation activity (Takeda et al. 2016). Furthermore, CD33high monocytic cells highly express CD14 (Takeda et al. 2016), and it has been reported that the peripheral blood CD14high CD16+ monocytes are key producers of interleukin (IL)-10, which is known as an immune suppressive cytokine (Skrzeczynska-Moncznik et al. 2008). Indeed, PC 1 characteristics, such as GPI-80 CV on neutrophilic cells, and CD16 MFI and GPI-80 MFI on monocytic cells, are associated with OS. These results suggested that such characteristics useful in determining the immunological status of mRCC patients and predicting prognosis.
Previously, it was reported that some subtypes of non-clear renal cell carcinoma, such as spindle cell renal cell carcinoma and carcinoma of the collecting ducts of Bellini, are related with the poor prognosis (Delahunt et al. 2013). Although six out of 20 patients with non-clear renal cell carcinoma were included in this study, the subtype of poor prognosis was not detected in this study. Thus, we could not determine the association between the subtype of RCC diagnosis and the appearance of MDSCs. Since MDSCs change their cell fate and activity under different environments (Ben-Meir et al. 2018), it should be investigated whether there is the relationship between the subtypes of RCC and MDSCs. However, despite many accomplishments in MDSC research so far, there is no evidence that difference of subtype of cancer induces difference in phenotype or function of MDSCs. In future investigations, it would be of great importance to elucidate the relationship between the criteria for RCC and activity of MDSCs.
In this study, seven out of 20 patients treated with cytokines, such as IL-2 and/or interferon (IFN)-α, for the first line therapy, were included. It was reported that IFN-α-based treatment of patients with chronic hepatitis C virus show increased levels of cells with MDSC phenotype and the responders showed higher levels of serum IL-2 (Salem et al. 2017). In this study, blood samples were collected just before the treatment, and thus, there is no effect of these exogenous cytokines on the heterogeneity of myeloid cells. However, it is possible that exogenous IFN-α and IL-2 may affect the induction of heterogeneity of myeloid cells including MDSCs in mRCC patients during the treatments. The definitive effects of these cytokines on MDSCs in cancer patients have not been fully elucidated and further investigation is needed.
We also explored the difference of CD16 and GPI-80 mRNA levels in PMNs between patients and healthy volunteers (data not shown). The difference in CD16 mRNA levels was only marginal (less than double fluctuation), suggesting the importance of analyzing the expression of CD16 protein by flow cytometry of a monocytic cell subset. By contrast, the GPI-80 mRNA levels were 2.40-fold higher in PMNs of patients, but the degree of the increase was lower than that of serglycin (4.21-fold), SLC11A1 (3.75-fold), and β-glucuronidase (2.72-fold). Thus, the change in GPI-80 mRNA levels is similar to that found in GPI-80 CV.
The percentage of CD16high cells contributed to PC 2, indicating that a change in the neutrophilic cell number in peripheral blood (increase in neutrophilic cells) also suggests the appearance of MDSCs. LAP MFI contributes to PC 3 in the patients, also indicating the potential level of TGF-β1 expression. These observations suggested that the colony stimulating factors and TGF-β1 might be involved in the production of various MDSCs.
Currently, specific surface molecules (LOX-1+ on neutrophilic cells or CD14+HLA-DR-/lo on monocytic cells) can be used to discriminate the MDSCs in human cells (Veglia et al. 2018). The staining of LOX-1+ is useful to detect MDSCs without any doubt, although various MDSCs have been reported in several clinical cases (Solito et al. 2014). A recent study has reported the association of the functional state of neutrophil activation in cancer with the ability of these cells to spontaneously migrate without immunosuppressive activity (Patel et al. 2018). Therefore, the phenomena caused by tumor progression cannot be attributed to a single molecule or a single cell type. In such case, combined characteristics or CV are also useful in recognizing the heterogeneity and emergence phenomena as demonstrated in the present study.
This study has shown that the GPI-80 represents the heterogeneity of myeloid cells and is a potential prognostic biomarker for mRCC. In the future, the heterogeneity of myeloid cells can be used as indicators of the immunosuppressive state that affects the prognosis of patients with other malignant tumors.
Acknowledgments
This work was supported by the Japan society for the promotion of science Grant, No. 15K105740002 and No. 17K11220001.
Conflict of Interest
The authors declare no conflict of interest.
References
-
Albeituni,
S.H.,
Ding,
C. &
Yan,
J.
(2013) Hampering immune suppressors: therapeutic targeting of myeloid-derived suppressor cells in cancer. Cancer J., 19, 490-501.
-
Ayukawa,
O.,
Nakamura,
K.,
Kariyazono,
H.,
Ikeda,
R.,
Arima,
J.,
Shinkawa,
T.,
Iwase,
H.,
Sakata,
R. &
Yamada,
K.
(2009) Enhanced platelet responsiveness due to chilling and its relation to CD40 ligand level and platelet-leukocyte aggregate formation. Blood Coagul. Fibrinolysis, 20, 176-184.
-
Ben-Meir,
K.,
Twaik,
N. &
Baniyash,
M.
(2018) Plasticity and biological diversity of myeloid derived suppressor cells. Curr. Opin. Immunol., 51, 154-161.
-
Bramwell,
K.K.,
Ma,
Y.,
Weis,
J.H.,
Chen,
X.,
Zachary,
J.F.,
Teuscher,
C. &
Weis,
J.J.
(2014) Lysosomal beta-glucuronidase regulates Lyme and rheumatoid arthritis severity. J. Clin. Invest., 124, 311-320.
-
Delahunt,
B.,
Cheville,
J.C.,
Martignoni,
G.,
Humphrey,
P.A.,
Magi-Galluzzi,
C.,
McKenney,
J.,
Egevad,
L.,
Algaba,
F.,
Moch,
H.,
Grignon,
D.J.,
Montironi,
R. &
Srigley,
J.R.
(2013) The International Society of Urological Pathology (ISUP) grading system for renal cell carcinoma and other prognostic parameters. Am. J. Surg. Pathol., 37, 1490-1504.
-
Donskov,
F.,
Hokland,
M.,
Marcussen,
N.,
Torp Madsen,
H.H. &
von der Maase,
H.
(2006) Monocytes and neutrophils as ‘bad guys’ for the outcome of interleukin-2 with and without histamine in metastatic renal cell carcinoma: results from a randomised phase II trial. Br. J. Cancer, 94, 218-226.
-
Donskov,
F. &
von der Maase,
H.
(2006) Impact of immune parameters on long-term survival in metastatic renal cell carcinoma. J. Clin. Oncol., 24, 1997-2005.
-
Duvigneau,
J.C.,
Hartl,
R.T.,
Teinfalt,
M. &
Gemeiner,
M.
(2003) Delay in processing porcine whole blood affects cytokine expression. J. Immunol. Methods, 272, 11-21.
-
Finke,
J.,
Ko,
J.,
Rini,
B.,
Rayman,
P.,
Ireland,
J. &
Cohen,
P.
(2011) MDSC as a mechanism of tumor escape from sunitinib mediated anti-angiogenic therapy. Int. Immunopharmacol., 11, 856-861.
-
Ganz,
T.
(2003) Defensins: antimicrobial peptides of innate immunity. Nat. Rev. Immunol., 3, 710-720.
-
Glenthoj,
A.,
Cowland,
J.B.,
Heegaard,
N.H.,
Larsen,
M.T. &
Borregaard,
N.
(2011) Serglycin participates in retention of alpha-defensin in granules during myelopoiesis. Blood, 118, 4440-4448.
-
Kanda,
Y.
(2013) Investigation of the freely available easy-to-use software ‘EZR’ for medical statistics. Bone Marrow Transplant., 48, 452-458.
-
Kishi,
A.,
Takamori,
Y.,
Ogawa,
K.,
Takano,
S.,
Tomita,
S.,
Tanigawa,
M.,
Niman,
M.,
Kishida,
T. &
Fujita,
S.
(2002) Differential expression of granulysin and perforin by NK cells in cancer patients and correlation of impaired granulysin expression with progression of cancer. Cancer Immunol. Immunother., 50, 604-614.
-
Ko,
J.S.,
Zea,
A.H.,
Rini,
B.I.,
Ireland,
J.L.,
Elson,
P.,
Cohen,
P.,
Golshayan,
A.,
Rayman,
P.A.,
Wood,
L.,
Garcia,
J.,
Dreicer,
R.,
Bukowski,
R. &
Finke,
J.H.
(2009) Sunitinib mediates reversal of myeloid-derived suppressor cell accumulation in renal cell carcinoma patients. Clin. Cancer Res., 15, 2148-2157.
-
Komohara,
Y.,
Hasita,
H.,
Ohnishi,
K.,
Fujiwara,
Y.,
Suzu,
S.,
Eto,
M. &
Takeya,
M.
(2011) Macrophage infiltration and its prognostic relevance in clear cell renal cell carcinoma. Cancer Sci., 102, 1424-1431.
-
Naito,
S.,
Yamamoto,
N.,
Takayama,
T.,
Muramoto,
M.,
Shinohara,
N.,
Nishiyama,
K.,
Takahashi,
A.,
Maruyama,
R.,
Saika,
T.,
Hoshi,
S.,
Nagao,
K.,
Yamamoto,
S.,
Sugimura,
I.,
Uemura,
H.,
Koga,
S.,
et al. (2010) Prognosis of Japanese metastatic renal cell carcinoma patients in the cytokine era: a cooperative group report of 1463 patients. Eur. Urol., 57, 317-325.
-
Nicolas-Avila,
J.A.,
Adrover,
J.M. &
Hidalgo,
A.
(2017) Neutrophils in homeostasis, immunity, and cancer. Immunity, 46, 15-28.
-
Ogawa,
K.,
Takamori,
Y.,
Suzuki,
K.,
Nagasawa,
M.,
Takano,
S.,
Kasahara,
Y.,
Nakamura,
Y.,
Kondo,
S.,
Sugamura,
K.,
Nakamura,
M. &
Nagata,
K.
(2003) Granulysin in human serum as a marker of cell-mediated immunity. Eur. J. Immunol., 33, 1925-1933.
-
Ohtake,
K.,
Takei,
H.,
Watanabe,
T.,
Sato,
Y.,
Yamashita,
T.,
Sudo,
K.,
Kuroki,
M.,
Chihara,
J. &
Sendo,
F.
(1997) A monoclonal antibody modulates neutrophil adherence while enhancing cell motility. Microbiol. Immunol., 41, 67-72.
-
Patel,
S.,
Fu,
S.,
Mastio,
J.,
Dominguez,
G.A.,
Purohit,
A.,
Kossenkov,
A.,
Lin,
C.,
Alicea-Torres,
K.,
Sehgal,
M.,
Nefedova,
Y.,
Zhou,
J.,
Languino,
L.R.,
Clendenin,
C.,
Vonderheide,
R.H.,
Mulligan,
C.,
et al. (2018) Unique pattern of neutrophil migration and function during tumor progression. Nat. Immunol., 19, 1236-1247.
-
Salem,
M.L.,
Zidan,
A.A.,
Attia,
M.,
El-Naggar,
R.E.,
Nassef,
M.,
Abou El-Azm,
A.R.,
El-Bate,
H.,
Yussif,
M.,
Galal,
S.,
Abo Senna,
M. &
El Demellawy,
M.
(2017) IFN-alpha-based treatment of patients with chronic HCV show increased levels of cells with myeloid-derived suppressor cell phenotype and of IDO and NOS. Immunopharmacol. Immunotoxicol., 39, 188-198.
-
Shinohara,
N.,
Obara,
W.,
Tatsugami,
K.,
Naito,
S.,
Kamba,
T.,
Takahashi,
M.,
Murai,
S.,
Abe,
T. &
Oba,
K.
(2015) Prognosis of Japanese patients with previously untreated metastatic renal cell carcinoma in the era of molecular-targeted therapy. Cancer Sci., 106, 618-626.
-
Skrzeczynska-Moncznik,
J.,
Bzowska,
M.,
Loseke,
S.,
Grage-Griebenow,
E.,
Zembala,
M. &
Pryjma,
J.
(2008) Peripheral blood CD14high CD16+ monocytes are main producers of IL-10. Scand. J. Immunol., 67, 152-159.
-
Solito,
S.,
Marigo,
I.,
Pinton,
L.,
Damuzzo,
V.,
Mandruzzato,
S. &
Bronte,
V.
(2014) Myeloid-derived suppressor cell heterogeneity in human cancers. Ann. NY Acad. Sci., 1319, 47-65.
-
Suzuki,
K.,
Watanabe,
T.,
Sakurai,
S.,
Ohtake,
K.,
Kinoshita,
T.,
Araki,
A.,
Fujita,
T.,
Takei,
H.,
Takeda,
Y.,
Sato,
Y.,
Yamashita,
T.,
Araki,
Y. &
Sendo,
F.
(1999) A novel glycosylphosphatidyl inositol-anchored protein on human leukocytes: a possible role for regulation of neutrophil adherence and migration. J. Immunol., 162, 4277-4284.
-
Takeda,
Y.,
Fu,
J.,
Suzuki,
K.,
Sendo,
D.,
Nitto,
T.,
Sendo,
F. &
Araki,
Y.
(2003) Expression of GPI-80, a β2-integrin-associated glycosylphosphatidylinositol-anchored protein, requires neutrophil differentiation with dimethyl sulfoxide in HL-60 cells. Exp. Cell Res., 286, 199-208.
-
Takeda,
Y.,
Kato,
T.,
Ito,
H.,
Kurota,
Y.,
Yamagishi,
A.,
Sakurai,
T.,
Araki,
A.,
Nara,
H.,
Tsuchiya,
N. &
Asao,
H.
(2016) The pattern of GPI-80 expression is a useful marker for unusual myeloid maturation in peripheral blood. Clin. Exp. Immunol., 186, 373-386.
-
Takeda,
Y.,
Nara,
H.,
Araki,
A. &
Asao,
H.
(2014) Human peripheral neutrophils express functional IL-21 receptors. Inflammation, 37, 1521-1532.
-
Veglia,
F.,
Perego,
M. &
Gabrilovich,
D.
(2018) Myeloid-derived suppressor cells coming of age. Nat. Immunol., 19, 108-119.