Abstract
Exercise is recommended for older patients with type 2 diabetes mellitus (T2DM), and increased physical activity contributes to better management of their condition. The conventional exercise test with treadmill or cycle ergometer (CE) for assessing physical capacity, such as peak oxygen uptake (VO2) and anaerobic threshold (AT), is not always usable for older patients with T2DM. The incremental sit-to-stand (ISTS) exercise is an incremental exercise test using external signals to control the sit-to-stand rate in a given time frame and can be performed in a small space using only a chair. This study aimed to examine the validity of the physical capacity assessment during the ISTS exercise, based on the relationships between the ISTS performance, peak VO2, AT on ISTS exercise and CE test, in older patients with T2DM. Twenty-two patients with T2DM (10 men, 12 women; mean age, 68.0 years; range, 61-77 years) performed ISTS exercise (according to an existing protocol) and CE test in a randomized manner. Peak VO2, AT, and completion time were determined for the ISTS exercise and CE test. Peak VO2 during ISTS exercise was significantly associated with that during the CE test (r = 0.89, p < 0.01). The completion time on the ISTS exercise was significantly associated with peak VO2 (r = 0.80, p < 0.01) and AT on the ISTS exercise (r = 0.78, p < 0.01). The ISTS exercise is a useful tool to determine the physical capacity and estimate peak VO2 and AT in older people with T2DM.
Introduction
Exercise is recommended for older patients with type 2 diabetes mellitus (T2DM), and increased physical activity contributes to better management of their condition; exercise is a critically important non-pharmacological therapeutic strategy as it improves glycemic and insulin sensitivity and prevents cardiovascular complications (Colberg et al. 2010). However, adherence to physical activity and exercise is poor among patients with T2DM, which further reduces physical capacity (Thomas et al. 2004; Zhao et al. 2008). Older patients with T2DM have been found to have 15%-20% lower physical capacity than controls (O’Connor et al. 2015). Furthermore, physical capacity is a strong independent predictor of mortality among patients with T2DM (Wei et al. 2000; Church et al. 2004). Hence, clinical guidelines recommend assessing the physical capacity, including peak oxygen uptake (VO2), anaerobic threshold (AT), and exercise prescription based on an individual’s physical capacity (Wasserman et al. 2012; American College of Sports Medicine 2013). Especially, moderate intensity exercise at the AT is recommended, ensuring its safety when performed by older patients.
Generally, physical capacity, such as peak VO2 or AT, is directly assessed using cardiopulmonary exercise testing (CPX), which is performed using a treadmill ergometer or cycle ergometer (CE) and is considered as the gold standard in clinical practice (Wasserman et al. 2012). However, the conventional tools to assess physical capacity are not always usable by and/or accessible to older patients with T2DM because CPX requires expensive equipment (Goto et al. 2007), and conventional exercise modalities, including treadmill ergometer and CE are not always feasible for patients who face difficulty in pedaling or walking.
The sit-to-stand (STS) exercise is one of the important physical activities of daily living for a large proportion of the population. The STS exercise is a useful tool to assess lower extremity muscle strength in older people and T2DM patients in clinical practice, as it is simple to perform and requires no specialized devices (Leenders et al. 2013). The incremental sit-to-stand exercise (ISTS) test, based on the external paced test, is developed to assess functional physical fitness (Nakamura et al. 2016). The ISTS is a simpler and more cost-effective test because it can be performed in a small space using a chair; moreover, the physical load intensity can be easily adjusted by changing the standing up and sitting down speed (Nakamura et al. 2016). In a previous study, the ISTS was found to be a valid, reproducible test to evaluate the physical capacity of healthy older women, and it could be performed safely (Nakamura et al. 2017). However, to the best of our knowledge, the ISTS has not been validated for older patients with T2DM. Older patients with T2DM have lower leg muscular strength than healthy older persons (Nomura et al. 2018). Furthermore, some studies have reported a lower VO2 response to submaximal workloads during exercise in patients with T2DM than that among controls (Regensteiner et al. 1998; O’Connor et al. 2012). Accordingly, because of the differences in leg muscular strength and cardiorespiratory response to exercise workload in patients with or without T2DM, it is unclear whether ISTS can be used to estimate physical capacity among older patients with T2DM as in healthy older persons.
The objective of this study was to examine the validity of physical capacity assessment during ISTS among older people with T2DM, based on the relationships between ISTS performance, peak VO2, and AT values on the ISTS and CE tests. We have hypothesized that the performance during ISTS would be significantly correlated with the peak VO2 and AT values of ISTS exercise and CE test.
Materials and Methods
Ethical considerations
Approval of all procedures was obtained from the ethics committee of the School of Medicine, Shinshu University, which is chaired by Eiji Tanaka, on 8 November, 2016 (protocol number 3174) and this study was performed per the guidelines provided in the Declaration of Helsinki. Informed consent was obtained from all the participants. This study was conducted at Matsumoto City Hospital from April 2017 to July 2019.
Study design and participants
The design for this study was a cross-sectional examination. We set the appropriate sample size on the basis of our hypothesis. Approximately 12 participants were needed based on the estimation of a standardized effect size for Pearson’s correlation analysis of 0.80, to achieve a statistical power of 80% with a two-sided significant level of 0.05 (Hulley et al. 2013). The participants in this study were older ambulatory patients with T2DM consulting Matsumoto city hospital. Participants who met the American Diabetes Association diagnosis criteria (Colberg et al. 2010) for T2DM and who were aged 60 years and over were included in this study. Exclusion criteria were: a fasting plasma glucose level over 250 mg/dL, proliferative retinopathy, severe peripheral neuropathy, nephropathy (overt nephropathy, stage 3; renal failure, stage 4), macrovascular complications such as ischemic cardiac disease, or autonomic neuropathy, or those with a physical impairment that could interfere with exercise.
Exercise protocols
All participants completed the ISTS exercise and the CE test on separate days within a range of 2 weeks in random order.
The ISTS test was performed with a height-adjustable chair and a computer to control the participants’ standing up speed. During the ISTS exercise, the participants repeated sit-to-stand and stand-to-sit, using their arms to push off the poles without any restriction on the strength used. The pole length was determined so that the participant’s elbow was in 30° flexion in the upright position. The participants were instructed to maintain an upright posture during standing and sitting, which is essential for the STS action (Fig. 1). The seating height of the chair was set at 120% of the distance from the floor to knee height, in the standing position (Nakamura et al. 2017). The standing-up frequency during the ISTS exercise was increased 2 times/min every 45 seconds from 6 times/min to 36 times/min over a 12-min exercise period (Table 1) (Nakamura et al. 2017). Audio and visual signals using down and up arrows on the computer screen were used to control the participants’ standing-up speed.
The CE test was performed using the incremental-ramp exercise protocol on a CE (Aerobike 75XLII; Combi, Tokyo, Japan). After a 3-min warming up exercise at 10 W, an incrementation rate of 10-15 W/min was used during the 12-min exercise period.
The ISTS and CE tests were continued until participants reached the 85% of the predicted maximum heart rate (HR) (Gellish et al. 2007), or missed the timing given by external signals three times consecutively during the ISTS test (Nakamura et al. 2017), or did not maintain a pedal rotation of 60 rotations/min during the CE test. Furthermore, exercise tests were stopped when participants met the general indications for stopping criteria of an exercise testing in the ACSM Guidelines (American College of Sports Medicine 2013).
Measurement
Information on demographic data (age, T2DM duration, medication, complications), body mass index (BMI), and laboratory parameters, such as HbA1c levels, were collected from patient hospital charts after the participants’ entry into this study before testing. Information on exercise habits (defined as walking and/or water walking ≥ 30 minutes a day, ≥ 3 days a week) was also collected from participants. All participants underwent physical examination: knee extensor muscle testing and body composition measurement. Measurement of isometric knee extensor muscle strength was obtained by using a hand-held dynamometer (μTas-F-100; Anima, Tokyo, Japan) (Izawa et al. 2014). The measurement was conducted on the right and left legs three times. The knee extensor muscle strength (Nm/kg) was determined based on the calculation; Strength (N) × lower leg length (m)/ body weight (kg), strength (N) was determined using the average of the largest value of both legs’ knee extensor muscle strength. Body composition, defined as the body fat percent (%) was measured using the InBody 770 (Inbody, Seoul, Korea), which uses bio-electrical impedance analysis (BIA) multi-frequency bio-impedance (Karelis et al. 2013).
During the ISTS and CE tests, respiratory valuables such as the oxygen uptake (VO2) and carbon dioxide output (VCO2) were continuously recorded via a breath-by-breath gas exchange analyzer (AT1100A; Anima). The system was calibrated prior to each test with accurate reference gases. The datasets were computed with the multigas analyzer software for the AT1100A. A nine-point moving average of the time series was obtained for calculating the respiratory valuables. The heart rate (HR) of each participant was recorded with an electrocardiogram (ECG), and a cardiologist monitored the electrocardiographic waveform during testing. Systolic blood pressure (BP) and diastolic BP were recorded at rest before warm-up and immediately following exercise completion. The rating of perceived exertion (RPE) scale was used to measure ventilator effort (RPE-V) and leg muscular fatigue (RPE-L) using Borg’s 15-point equivalent interval scale immediately following test completion (Green et al. 2003).
Peak VO2 and peak HR (average values calculated during the last 30 s of the ISTS and CE tests), and completion time during the ISTS test were determined. The AT was also determined during both tests. The AT point was determined by two evaluators using the following criteria for the gas exchange analysis: the breaking point when the minute ventilation VE/VO2 curve, having been stagnant or decreasing, begins to increase as the VE/VCO2 curve remains constant or decreases; the point when VCO2 increases in volume greater than the volume of VO2 (V-slope method) (Beaver et al. 1986). All VO2 values were expressed as relative rate per body mass (mL/min/kg) (Itoh et al. 2013).
Statistical analysis
Normality of all values was verified using the Shapiro-Wilk test. The relationships between peak VO2 and AT values for both tests and the completion time for the ISTS were tested with Pearson’s correlation coefficient or Spearman’s rank correlation coefficient. A simple linear regression analysis was used for peak VO2 or AT for the ISTS test and the completion time of the ISTS to predict the physical capacity based on the performance during the ISTS. Comparison between the physical workload values during both tests was performed using the paired t-test or the Wilcoxon rank sum test. Statistical analyses were performed for all measures using SPSS statistical software, version 22.0 (IBM, Chicago, IL, USA). A p value < 0.05 was considered significant.
Results
Participant characteristics and reasons for discontinuing exercise tests
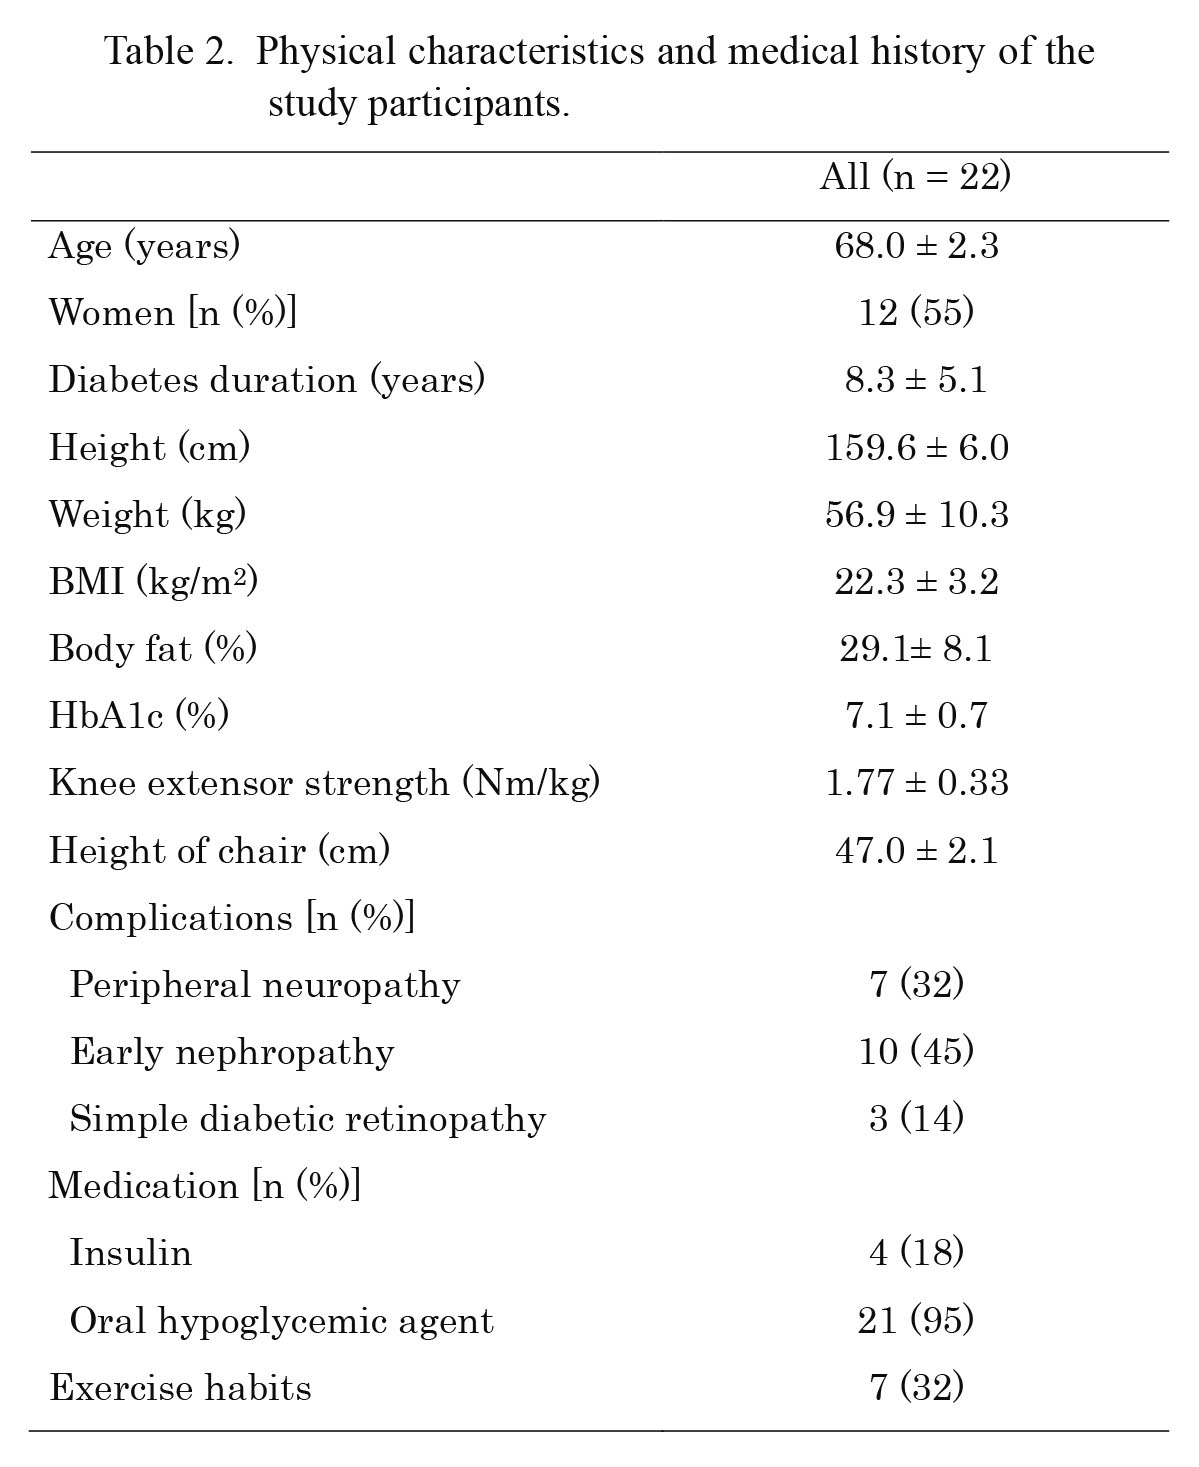
Twenty-two participants with T2DM for an average duration of 8.3 ± 5.1 years were enrolled in the present study. Their physical characteristics are shown in Table 2. Seven participants (32%) had diabetic peripheral neuropathy; however, it did not inversely affect their performance in the exercise tests. The reasons for discontinuing exercise tests were as follows; 1) During the ISTS test, three participants completed the ISTS exercise at 12min, fifteen participants reached 85% of the predicted maximum HR and the rest failed to follow the timing according to external signals, and 2) During the CE test, nineteen participants had an HR at 85% of the predicted maximum HR and the rest were unable to maintain 60 pedal rotations/min. None of the participants had knee pain during the exercise tests.
Comparisons and relationships of physical capacity during the two exercise tests
For all participants, the peak VO2, peak HR, AT, and Borg score of RPE-V and RPE-L for both tests were not significantly different (Tables 3 and 4). For men only, the peak VO2 during the ISTS test was significantly lower than that during the CE test (p = 0.04). The completion time (mean ± standard deviation) on the ISTS was 591.4 ± 90.9 seconds for all participants.
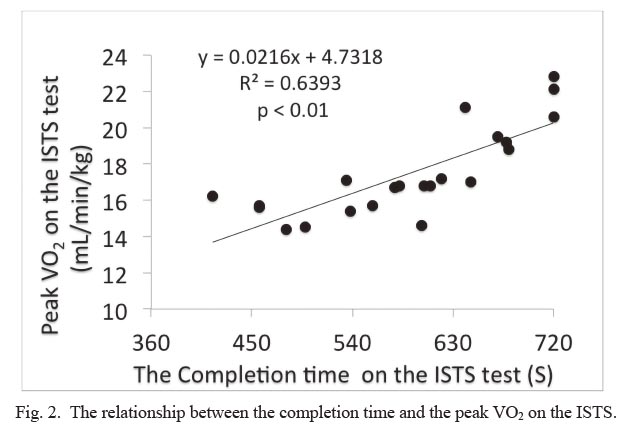
A significant association was observed between peak VO2 values (r = 0.89; p < 0.01) and AT values (r = 0.77; p < 0.01) for both tests. For men or women, significant associations were determined between peak VO2 values (respectively: r = 0.86, p < 0.01; and r = 0.93, p < 0.01) and AT values (respectively: r = 0.71, p < 0.01; and r = 0.76, p < 0.01) for both tests. The ISTS completion time was significantly associated with peak VO2 during the ISTS test (r = 0.80; p < 0.01) and AT during the ISTS test (r = 0.78; p < 0.01). These were represented using the following linear regression equation: peak VO2 of the ISTS test (mL/min/kg) = 0.0216 × the ISTS completion time (S) + 4.7318 (R2 = 0.639; p < 0.01) (Fig. 2), AT of the ISTS test (mL/min/kg) = 0.0166 × the ISTS completion time (S) + 4.5071 (R2 = 0.606; p < 0.01) (Fig. 3). The correlations between the ISTS completion time and the BMI, body fat %, and knee extensor strength were r = –0.34 (p = 0.12), r = –0.25 (p = 0.26), and r = 0.38 (p = 0.07), respectively.

Discussion
To the best of our knowledge, this was the first trial of an ISTS test to evaluate the physical capacity and predict the peak VO2 and AT using the ISTS performance of older patients with T2DM.
Validity of the ISTS test
This study indicates that the ISTS exercise is a valid test to evaluate peak VO2 and AT, and the ISTS test is helpful for predicting physical capacity of older patients with T2DM without macrovascular complications based on the performance on the ISTS exercise. This suggests that the ISTS settings, such as the height of the chairs or the incremental speed at which the participant stands up are suited for these participants to evaluate their physical capacity. Patients with T2DM have reduced lower leg muscular strength than among age-matched controls (Andersen et al. 2004; Nomura et al. 2018). STS performance, such as the 30-s chair stand test, is associated with leg muscular strength (Jones et al. 1999); thus, reduced leg muscular strength could pose a disadvantage for STS performance. However, the peak VO2 could be predicted based on the ISTS performance of older patients with T2DM, and was therefore not affected by leg muscular strength, because the ISTS test uses greater chair height (120% of knee height) and the participants use their arms to support the sit-to-stand motion, which differs from the CS30. Furthermore, during the ISTS test, no participant met the discontinuance criteria or had knee pain, and no significant differences were detected in the Borg scale between both tests. The ISTS test was therefore thought to be a safe physical workload for older patients with T2DM.
The peak VO2 of the ISTS test was not significantly different from that of the CE test among women. However, the peak VO2 of the ISTS test was approximately 6% lower than that of the CE test among men, and the difference was significant. This result could have occurred owing to the ceiling effect for men only; therefore, three men completed the ISTS test 12 min before reaching 85% of the predicted maximum HR; however, all males reached it during the CE test. Nonetheless, the significant correlation between peak VO2 of both tests for men only suggested that ISTS exercise is a potentially valid test for evaluating peak VO2 among older men with T2DM.
The linear regression equation obtained in this study to predict peak VO2 based on the ISTS performance differs from that among healthy older people in our previous study: peak VO2 of the ISTS test in T2DM older patients (mL/min/kg) = 0.0216 × the ISTS completion time (S) + 4.7318 (Fig. 2), compared with peak VO2 of the ISTS test in healthy older people (mL/min/kg) = 0.02 × the ISTS completion time (S) + 9.6 (Nakamura et al. 2017). The difference predicts a lower peak VO2 based on the same ISTS performance among older patients with T2DM than that among healthy older people. This could be attributed to the slow increase in oxygen consumption during onset of exercise and lower exercise tolerance than age-matched healthy individuals, which has been reported in a previous study (O’Connor et al. 2015). A lower VO2 response to submaximal workloads during exercise is seen among persons with T2DM than that among controls (Regensteiner et al. 1998; O’Connor et al. 2012). Furthermore, the VO2/workload relationship is also known to be impaired among patients with T2DM (Baldi et al. 2003). These findings appear to be owing to the impaired exercising muscle oxygen delivery linked to both cardiac and peripheral vascular dysfunction, such as T2DM-induced impairment of vascular control in contracting skeletal muscle (MacAnaney et al. 2011), reduced systemic vascular conductance response (O’Connor et al. 2015), or reduced exercise arteriovenous O2 difference (Baldi et al. 2003), However, a definitive conclusion remains elusive, because evidence against impairment is available in some studies (Thaning et al. 2011; Poitras et al. 2015). Nonetheless, there was a difference in oxygen uptakes related to physical workload between participants with or without T2DM during the ISTS exercise (Nakamura et al. 2017). Consequently, when predicting the peak VO2 using the ISTS test, the linear regression equation must be selected based on whether the participants have T2DM.
Utility of the ISTS test
Our study demonstrated that the ISTS test appears to be valid for predicting the AT of older patients with T2DM. Based on our results, the predicted AT for the ISTS performance ranged from 4.5 to 16.5 mL/min/kg; Hence, the ISTS test is useful for people with physical capacity in this range. Moderate intensity aerobic exercise training is recommended for most adults, including those with T2DM (American College of Sports Medicine 2013). Moderate exercise intensity is recommended at AT, which is equivalent to 40%-60% of the peak VO2, as reported in a previous study (Itoh et al. 2013). Accordingly, the ISTS test is potentially useful for prescribing exercise to older adults with T2DM.
Limitations of this study
The present study had several limitations. The present study did not separate patients into with or without neuropathy because of the small sample size; neuropathy significantly affects lower leg muscular strength (Nomura et al. 2018). Future studies could investigate the difference in the physical capacity assessed using the ISTS test between patients with or without diabetic neuropathy. Studies are also required to determine the validity of the ISTS test in evaluating the physical capacity in other populations such as older patients with macrovascular disease.
Conclusion
We show a significant association between physical capacity on the ISTS and CE tests, and the ISTS has the capacity to predict peak VO2 or AT values of older patients with T2DM from the ISTS performance. Assessing physical capacity among older patients with T2DM is important in the clinical setting for management of their condition. We believe that the ISTS test is useful as one of the tools for assessing physical capacity among older patients with T2DM without macrovascular complications, in situations where CPX is difficult to perform.
Acknowledgments
We are especially thankful to all the participants who cooperated in our study, as well as to the rehabilitation staff for their assistance in data collection for the study. This work was supported by the Shinshu Public Utility Foundation for the promotion of medical sciences.
Conflict of Interest
The authors declare no conflict of interest.
References
-
American College of Sports Medicine
(2013) Interpretation of Results. In ACSM’s Guidelines for Exercise Testing and Prescription, edited by
Pescatello,
L.S.,
Arena,
R.,
Riebe,
D. &
Thompson,
P.D.
Lippincott Williams & Wilkins, Philadelphia, PA, pp. 87-193.
-
Andersen,
H.,
Nielsen,
S.,
Mogensen,
C.E. &
Jakobsen,
J.
(2004) Muscle strength in type 2 diabetes. Diabetes, 53, 1543-1548.
-
Baldi,
J.C.,
Aoina,
J.L.,
Oxenham,
H.C.,
Bagg,
W. &
Doughty,
R.N.
(2003) Reduced exercise arteriovenous O2 difference in type 2 diabetes. J. Appl. Physiol. (1985), 94, 1033-1038.
-
Beaver,
W.L.,
Wasserman,
K. &
Whipp,
B.J.
(1986) A new method for detecting anaerobic threshold by gas exchange. J. Appl. Physiol. (1985), 60, 2020-2027.
-
Church,
T.S.,
Cheng,
Y.J.,
Earnest,
C.P.,
Barlow,
C.E.,
Gibbons,
L.W.,
Priest,
E.L. &
Blair,
S.N.
(2004) Exercise capacity and body composition as predictors of mortality among men with diabetes. Diabetes Care, 27, 83-88.
-
Colberg,
S.R.,
Albright,
A.L.,
Blissmer,
B.J.,
Braun,
B.,
Chasan-Taber,
L.,
Fernhall,
B.,
Regensteiner,
J.G.,
Rubin,
R.R. &
Sigal,
R.J.;
American College of Sports Medicine; American Diabetes Association
(2010) Exercise and type 2 diabetes: American College of Sports Medicine and the American Diabetes Association: joint position statement. Exercise and type 2 diabetes. Med. Sci. Sports Exerc., 42, 2282-2303.
-
Gellish,
R.L.,
Goslin,
B.R.,
Olson,
R.E.,
McDonald,
A.,
Russi,
G.D. &
Moudgil,
V.K.
(2007) Longitudinal modeling of the relationship between age and maximal heart rate. Med. Sci. Sports Exerc., 39, 822-829.
-
Goto,
Y.,
Saito,
M.,
Iwasaka,
T.,
Daida,
H.,
Kohzuki,
M.,
Ueshima,
K.,
Makita,
S.,
Adachi,
H.,
Yokoi,
H.,
Omiya,
K.,
Mikouchi,
H. &
Yokoyama,
H.;
Japanese Cardiac Rehabilitation Survey Investigators
(2007) Poor implementation of cardiac rehabilitation despite broad dissemination of coronary interventions for acute myocardial infarction in Japan: a nationwide survey. Circ. J., 71, 173-179.
-
Green,
J.M.,
Crews,
T.R.,
Bosak,
A.M. &
Peveler,
W.W.
(2003) Overall and differentiated ratings of perceived exertion at the respiratory compensation threshold: effects of gender and mode. Eur. J. Appl. Physiol., 89, 445-450.
-
Hulley,
S.B.,
Cummings,
S.R.,
Newman,
T.B.,
Browner,
W.S.,
Grady,
D.G. &
Newman,
T.B.
(2013) Designing Clinical Research, Lippincott Williams & Wilkins, Philadelphia, PA.
-
Itoh,
H.,
Ajisaka,
R.,
Koike,
A.,
Makita,
S.,
Omiya,
K.,
Kato,
Y.,
Adachi,
H.,
Nagayama,
M.,
Maeda,
T.,
Tajima,
A.,
Harada,
N. &
Taniguchi,
K.;
Committee on Exercise Prescription for Patients Members
(2013) Heart rate and blood pressure response to ramp exercise and exercise capacity in relation to age, gender, and mode of exercise in a healthy population. J. Cardiol., 61, 71-78.
-
Izawa,
K.P.,
Watanabe,
S. &
Oka,
K.
(2014) Muscle strength of male inpatients with heart failure with reduced versus preserved ejection fraction. Int. J. Cardiol., 172, e228-229.
-
Jones,
C.J.,
Rikli,
R.E. &
Beam,
W.C.
(1999) A 30-s chair-stand test as a measure of lower body strength in community-residing older adults. Res. Q. Exerc. Sport, 70, 113-119.
-
Karelis,
A.D.,
Chamberland,
G.,
Aubertin-Leheudre,
M. &
Duval,
C.;
Ecological mobility in Aging and Parkinson group
(2013) Validation of a portable bioelectrical impedance analyzer for the assessment of body composition. Appl. Physiol. Nutr. Metab., 38, 27-32.
-
Leenders,
M.,
Verdijk,
L.B.,
van der Hoeven,
L.,
Adam,
J.J.,
van Kranenburg,
J.,
Nilwik,
R. &
van Loon,
L.J.
(2013) Patients with type 2 diabetes show a greater decline in muscle mass, muscle strength, and functional capacity with aging. J. Am. Med. Dir. Assoc., 14, 585-592.
-
MacAnaney,
O.,
Reilly,
H.,
O’Shea,
D.,
Egana,
M. &
Green,
S.
(2011) Effect of type 2 diabetes on the dynamic response characteristics of leg vascular conductance during exercise. Diab. Vasc. Dis. Res., 8, 12-21.
-
Nakamura,
K.,
Nagasawa,
Y.,
Sawaki,
S.,
Yokokawa,
Y. &
Ohira,
M.
(2017) Development of an incremental sit-to-stand exercise for aerobic fitness evaluation. Int. J. Sports Med., 38, 827-832.
-
Nakamura,
K.,
Nagasawa,
Y.,
Sawaki,
S.,
Yokokawa,
Y. &
Ohira,
M.
(2016) Effect of different seat heights during an incremental sit-to-stand exercise test on peak oxygen uptake in young, healthy women. J. Sports Sci. Med., 15, 410-416.
-
Nomura,
T.,
Ishiguro,
T.,
Ohira,
M. &
Ikeda,
Y.
(2018) Diabetic polyneuropathy is a risk factor for decline of lower extremity strength in patients with type 2 diabetes. J. Diabetes Investig., 9, 186-192.
-
O’Connor,
E.,
Green,
S.,
Kiely,
C.,
O’Shea,
D. &
Egana,
M.
(2015) Differential effects of age and type 2 diabetes on dynamic vs. peak response of pulmonary oxygen uptake during exercise. J. Appl. Physiol. (1985), 118, 1031-1039.
-
O’Connor,
E.,
Kiely,
C.,
O’Shea,
D.,
Green,
S. &
Egana,
M.
(2012) Similar level of impairment in exercise performance and oxygen uptake kinetics in middle-aged men and women with type 2 diabetes. Am. J. Physiol. Regul. Integr. Comp. Physiol., 303, R70-76.
-
Poitras,
V.J.,
Bentley,
R.F.,
Hopkins-Rosseel,
D.H.,
LaHaye,
S.A. &
Tschakovsky,
M.E.
(2015) Independent effect of type 2 diabetes beyond characteristic comorbidities and medications on immediate but not continued knee extensor exercise hyperemia. J. Appl. Physiol. (1985), 119, 202-212.
-
Regensteiner,
J.G.,
Bauer,
T.A.,
Reusch,
J.E.,
Brandenburg,
S.L.,
Sippel,
J.M.,
Vogelsong,
A.M.,
Smith,
S.,
Wolfel,
E.E.,
Eckel,
R.H. &
Hiatt,
W.R.
(1998) Abnormal oxygen uptake kinetic responses in women with type II diabetes mellitus. J. Appl. Physiol. (1985), 85, 310-317.
-
Thaning,
P.,
Bune,
L.T.,
Zaar,
M.,
Saltin,
B. &
Rosenmeier,
J.B.
(2011) Functional sympatholysis during exercise in patients with type 2 diabetes with intact response to acetylcholine. Diabetes Care, 34, 1186-1191.
-
Thomas,
N.,
Alder,
E. &
Leese,
G.P.
(2004) Barriers to physical activity in patients.
-
Wasserman,
K.,
Hansen,
J.E.,
Sue,
D.Y.,
Stringer,
W. &
Whipp,
B.
(2012) Principles of Exercise Testing and Interception, Lippincott Williams & Wilkins, Philadelphia, PA.
-
Wei,
M.,
Gibbons,
L.W.,
Kampert,
J.B.,
Nichaman,
M.Z. &
Blair,
S.N.
(2000) Low cardiorespiratory fitness and physical inactivity as predictors of mortality in men with type 2 diabetes. Ann. Intern. Med., 132, 605-611.
-
Zhao,
G.,
Ford,
E.S.,
Li,
C. &
Mokdad,
A.H.
(2008) Compliance with physical activity recommendations in US adults with diabetes. Diabet. Med., 25, 221-227.