Abstract
Soluble suppressor of tumorigenicity 2 (sST2), galectin-3, growth differentiation factor (GDF)-15 and syndecan-1 represent biomarkers of cardiac remodeling, involved in heart failure (HF) progression. We hypothesize that their plasma concentrations, together with brain natriuretic peptide (BNP), are different in HF stratified by ejection fraction (EF), demonstrating correlations with echocardiographic parameters that indicate left ventricular (LV) hypertrophy; LV mass index (LVMI) and posterior wall and septum diameters. HF patients (n = 77) were classified according to EF: reduced EF < 40% (HFrEF), mid-range EF = 40-49% (HFmrEF), preserved EF > 50% (HFpEF). We found that plasma concentrations of four cardiac remodeling biomarkers were highest in HFrEF and lowest in HFpEF, p < 0.001. In HFpEF, remodeling biomarkers independently correlated with LVMI: sST2 (p = 0. 002), galectin-3 (p < 0.001), GDF-15 (p = 0.011), and syndecan-1 (p = 0.006), whereas galectin-3 correlated after multivariable adjustments (p = 0.001). Independent correlates of septum and posterior wall diameters, in HFpEF, were sST2 (p = 0.019; p = 0.026), galectin-3 (p = 0.011; p = 0.009), GDF-15 (p = 0.007; p = 0.001), and syndecan-1 (p = 0.005; p = 0.002). In HFrEF, only sST2, adjusted, correlated with LVMI (p = 0.010), whereas BNP correlated with LVMI (p = 0.002) and EF (p = 0.001). GDF-15 correlated with diastolic dysfunction in HFpEF (p = 0.046) and HFrEF (p = 0.024). Cardiac remodeling biomarkers are potential circulating indicators of LV hypertrophy in HFpEF, which may ensure timely recognition of disease progression among high-risk patients.
Introduction
Heart failure (HF) can be a heterogeneous clinical syndrome characterized by signs and symptoms caused by structural and/or functional cardiac abnormalities, resulting in reduced cardiac output or elevated intracardiac pressures during stress or rest (Metra and Teerlink 2017). The pathophysiology of chronic HF includes involvement of six major axes: neurohormonal activation, inflammation, oxidative stress, cardiomyocyte injury, cardiac remodeling and renal dysfunction, represented by different biomarkers (Richards 2018). Cardiac remodeling biomarkers which are currently supported with relevant evidence regarding their monitoring and prognostic accuracy in chronic HF include: the soluble suppressor of tumorigenicity 2 (sST2), galectin-3, growth differentiation factor (GDF)-15 and syndecan-1 (Chow et al. 2017; Carnes and Gordon 2020). None of them has, however, reached diagnostic potential of brain natriuretic peptide (BNP).
The suppressor of tumorigenicity 2 (ST2) represents a member of the interleukin (IL)-1 receptor family and can be found in two forms: a transmembrane (ST2L) and a soluble form (sST2) (Bayes-Genis et al. 2015). ST2L functions as a receptor for interleukin (IL)-33, cytokine secreted from the cardiac fibroblasts as an answer to myocardial stress, in order to mitigate cardiac damage and remodeling (Passino et al. 2015). Moreover, IL33/ST2L signaling has been demonstrated to be highly cardioprotective by preventing cardiac apoptosis, fibrosis and hypertrophy development (Passino et al. 2015). However, soluble ST2 sequesters IL33/ST2L interaction, by binding to IL-33, therefore disabling its favorable effects and leading to detrimental cardiac events, including adverse remodeling (Bayes-Genis et al. 2015; Passino et al. 2015).
Galectin-3, a β-galactoside-binding lectin, may be found in epithelial and endothelial cells and is secreted by active macrophages to the extracellular space, in order to transform resistant fibroblasts into matrix-producing cells (Passino et al. 2015). Additionally, healthy myocardium exhibits a very low galectin-3 expression; however, any kind of cardiac injury promptly induces its expression (Suthahar et al. 2018). Nevertheless, its continuous over-expression eventually leads to adverse cardiac remodeling (Suthahar et al. 2018).
Growth differentiation factor (GDF)-15 is a stress-responsive cytokine, belonging to the transforming growth factor-beta (TGF-β) receptor family and is physiologically expressed in the placenta and the central nervous system (Carnes and Gordon 2020). However, in pathological conditions such as hypoxia, ischemia, oxidative stress or inflammation it may be expressed in various tissues, including the heart, where it was shown to exert anti-hypertrophic properties (Mueller et al. 2015).
Syndecan-1 is a member of the proteoglycan family included in cell-matrix interactions and its elevated plasma concentrations may indicate diverse endothelial injury or a disruption of glycocalyx (Tromp et al. 2014). Consequently, syndecan-1 is up-regulated in fibrotic areas of the heart and promptly up-regulated after pressure-overload (Lunde et al. 2016). Nevertheless, syndecan-1 was demonstrated to be an essential mediator of angiotensin II-induced cardiac fibrosis, affecting quantity and quality of the collagen matrix (Schellings et al. 2010; Lunde et al. 2016).
To the best of our knowledge, there is no study that has compared plasma concentrations of these biomarkers in patients stratified within the category of ejection fraction according to the current European Society of Cardiology (ESC) guidelines on heart failure (Ponikowski et al. 2016).
We therefore established new objectives for this study: first, by reflecting different pathophysiological processes in the course of HF progression, our hypothesis was that concentrations of cardiac remodeling biomarkers (sST2, galectin-3, GDF-15, syndecan-1) and BNP may vary significantly according to patients’ classification based on the left ventricular ejection fraction (LVEF). Second, we sought to assess the possible correlations of these biomarkers with relevant clinical, laboratory, and echocardiographic characteristics in the HF subgroups with: reduced, mid-range and preserved ejection fraction.
Patients and Methods
Study design
This study is designed as a cross-sectional, single-center study conducted at the Institute for Treatment and Rehabilitation “Niska Banja”, Niska Banja, Serbia, from May to October 2018. All patients, aged ≥ 18 years, previously diagnosed with chronic heart failure, regardless of etiology, who had been admitted to the Institute for the purpose of rehabilitation were eligible for inclusion. The diagnosis of HF was clinically confirmed according to current ESC 2016 guidelines (Ponikowski et al. 2016) and required: symptoms of HF, BNP plasma concentration (> 35 pg/mL) and relevant structural heart changes (left ventricular mass index, LVMI ≥ 115 g/m2 for males and ≥ 95 g/m2 for females or left atrial dilation ≥ 40 mm) and/or diastolic abnormality (E/A ratio < 0.75 or ≥ 1.5).
Informed consent was obtained from all participants prior to the trial, and the study was approved by both institutional ethics committees: The Faculty of Medicine, Nis, University Nis, number 12-10580-2/3 and the Institute for Treatment and Rehabilitation “Niska Banja”, number 03-4185/1.
Study population
Out of 120 chronic heart failure patients, we selected 77 with complete medical charts, who met the inclusion criteria and were willing to participate in the study. Therefore, patients with chronic coronary artery disease, myocardial infarction (with or without ST-elevation), cardiomyopathy and valvular heart disease as primary causes of heart failure were classified as a clinical group. Heart failure patients who had any signs of chronic pulmonary disease, malignancies, diabetes mellitus, neurological disorders, systemic or infectious diseases or declined to sign “informed consent” were excluded from the trial.
All patients classified as a clinical group were given compensated clinical status and received the standard pharmacological therapy (Ponikowski et al. 2016). Within 24 hours of hospital admission all patients underwent the following: medical history assessment, physical examination, standard 12-lead electrocardiography, blood sampling and echocardiography.
According to the obtained LVEF, the major clinical group (n = 77) was subdivided into three subgroups. Patients with a validated LVEF ≥ 50% were classified as HFpEF (n = 25), patients with a LVEF 40-49% were classified as HFmrEF (n = 26), whereas those patients with a LVEF < 40% (n = 25), represented the HFrEF subgroup (Ponikowski et al. 2016). The control group (n = 35) consisted of healthy volunteers who were age and gender matched with the selected patients and were without any history of coronary artery disease or HF.
Echocardiographic measurements
All participants underwent two-dimensional echocardiography, using the commercially available system (ACUSON-SEQUOIA 256, NY) following the recommendations of the American Society of Echocardiography and the European Association of Cardiovascular Imaging (Lang et al. 2015). Left ventricular ejection fraction (LVEF) and LV dimensions; end-diastolic dimension (EDD) and end-systolic dimension (ESD), were assessed using the biplane method (Simpson’s biplane) and the dimensions of the left atrium and LV mass were provided by M mode imaging. Doppler‐derived mitral valve flow velocity waves (E-wave, A-wave, E/A ratio) were determined, where the E/A ratio, as the ratio of the early (E) to late (A) ventricular filling velocities was regarded as a parameter of diastolic dysfunction; E/A ratio < 0.75 or ≥ 1.5 (Ponikowski et al. 2016).
The structure and the function of the right heart was assessed by measuring the dimensions of the right ventricle (RV), systolic pulmonary artery pressure and the tricuspid annular plane systolic excursion (TAPSE) in an apical 4-chamber view. The maximum systolic excursion of the lateral tricuspid annulus was measured by M-mode, with TAPSE of < 17 mm indicating RV dysfunction (Rudski et al. 2010).
Echocardiographic parameters of particular interest were: left ventricular mass index (LVMI) expressed in g/m2, left ventricular (LV) internal dimensions in systole (ESD) and diastole (EDD), ventricular septal thickness in diastole, and LV posterior thickness in diastole, all expressed in millimeters (mm). LV mass was calculated according to the formula recommended by the American Society of Echocardiography and was indexed to the body surface area (Lang et al. 2015). We therefore used LVMI ≥ 115 g/m2 as the measure of the left ventricular hypertrophy for males and ≥ 95 g/m2 for females (Ponikowski et al. 2016) and dimensions of the posterior wall > 11 mm, and the septum > 11 mm.
Circulating biomarkers
Blood sampling was performed on admission, immediately after informed consent forms were signed and all standard biochemical measurements were obtained using the Sysmex XS 1000 apparatus, Europe GmbH. All aliquots were frozen at –80℃ within two hours of the venipuncture for the purpose of biomarker measurement. Plasma concentrations of sST2, galectin-3 and GDF-15 were measured using QuantikineR; R&D Systems, Inc. Minneapolis, MN, USA kits. BNP and syndecan-1 were also quantified using the sandwich enzyme immunoassay technique by Abcam, ab193694, UK. All measurements were determined according to the manufacturer’s instructions.
Statistical analyses
The data are presented as mean ± standard deviation, or as a frequency and as percentages. Differences in demographic, clinical, biochemical, and echocardiographic parameters between groups were measured using appropriate tests; Chi-squared test, ANOVA and Kruskal-Wallis test. The correlation between echocardiographic parameters and cardiac remodeling biomarkers was estimated using the Pearson and Spearman correlation coefficient. The multivariable linear regression (backward method) model was used to assess the correlation between echocardiographic parameters and evaluated biomarkers. The level of significance was set at p < 0.05. A complete case-analysis was performed. All statistical analyses were performed using R software, version 3.0.3 (R Foundation for Statistical Computing, Vienna, Austria) (R Core Team 2014).
Results
Baseline patient characteristics
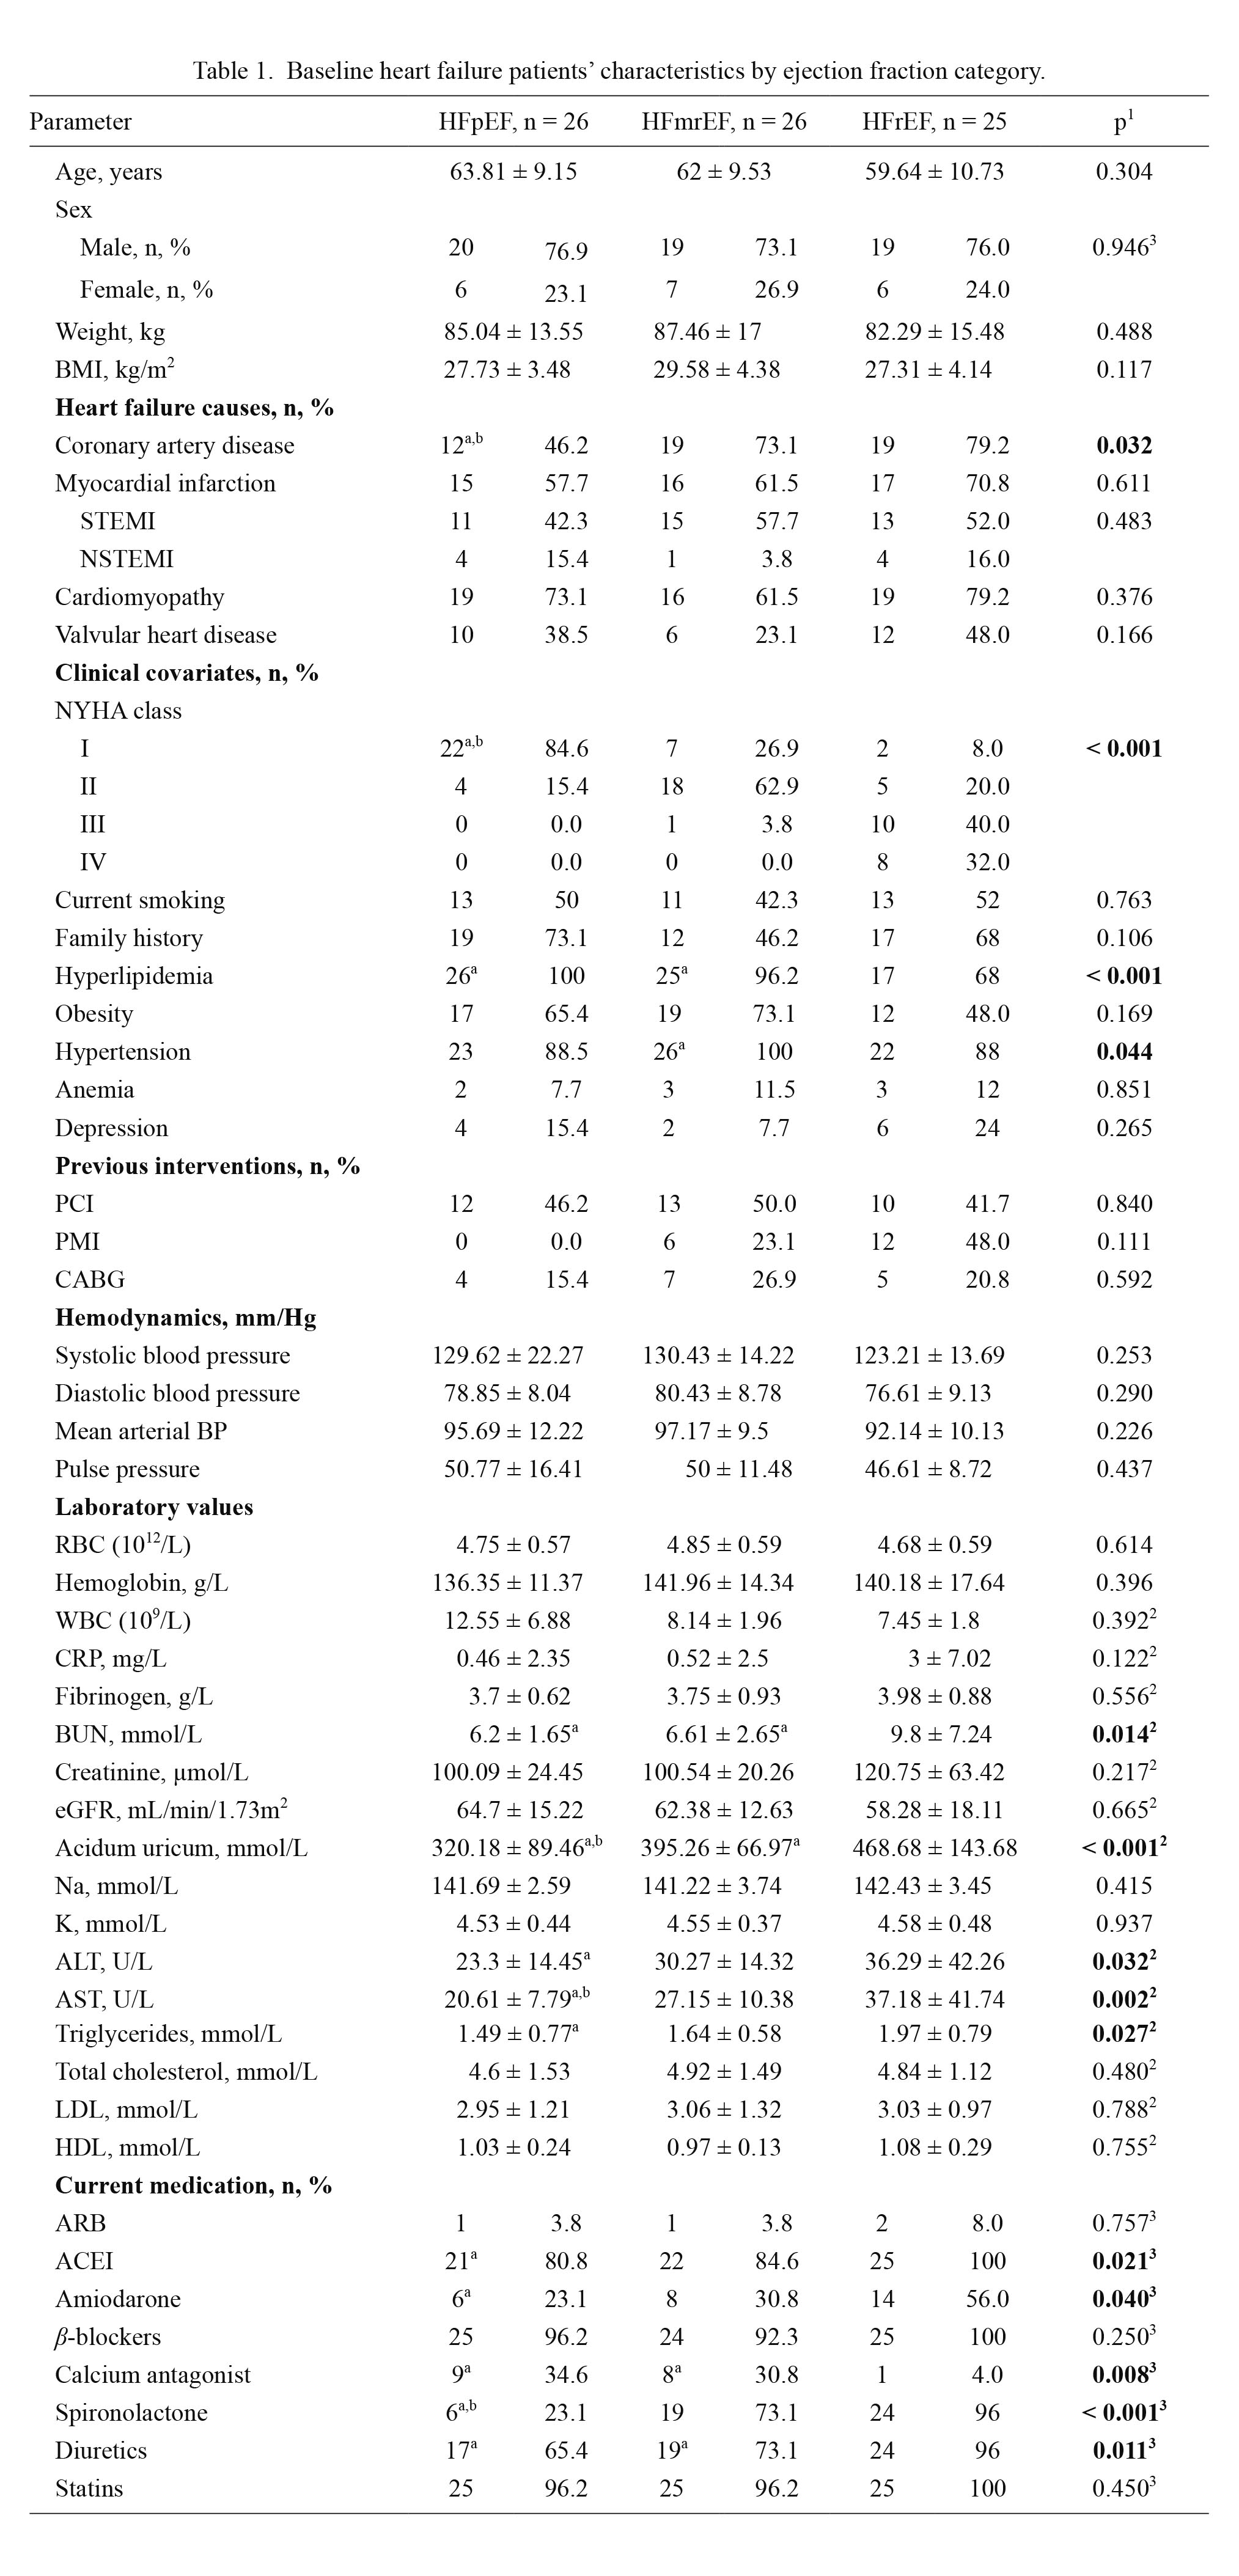
Our study sample included 26 HFpEF, 26 HFmrEF and 25 HFrEF patients and 35 community-based controls without HF. The baseline characteristics of HF patients are outlined in Table 1. Significant differences were obtained in the following: the presence of coronary artery disease (p = 0.032), being the highest in HFrEF (79.2%), NYHA class (p < 0.001), hyperlipidemia (p < 0.001), being the most prevalent in HFpEF patients (100%) compared to HFrEF (68%) and HFmrEF (96.2%) and hypertension (p = 0.032). Regarding laboratory data (Table 1), significant differences were found in blood urea nitrogen (p = 0.014), uric acid levels (p < 0.001), activity of AST (p = 0.032) and ALT (p = 0.002), and triglycerides (p = 0.027), with the highest values of all in HFrEF. Current medication was statistically different between groups as follows: ACEIs (p = 0.021), amiodarone (p = 0.040), calcium antagonists (p = 0.008), spironolactone (p < 0.001) and diuretics (p = 0.011) (Table 1).
Compared with the control group, as presented in Table 2, HF patients had significantly higher concentrations of all individual biomarkers (p < 0.001). Plasma concentrations of the evaluated biomarkers (BNP, sST2, galectin-3, GDF-15, and syndecan-1) are provided in Table 2, signaling a similar profile between the subgroups, being the highest in the HFrEF subgroup and the lowest in HFpEF (p < 0.001 for all biomarkers respectively). Nevertheless, regarding plasma concentrations of BNP and cardiac remodeling, biomarkers HFmrEF showed a complete intermediate profile, in between HFpEF and HFrEF, as presented in Fig. 1.
Echocardiographic parameters in clinical group and controls
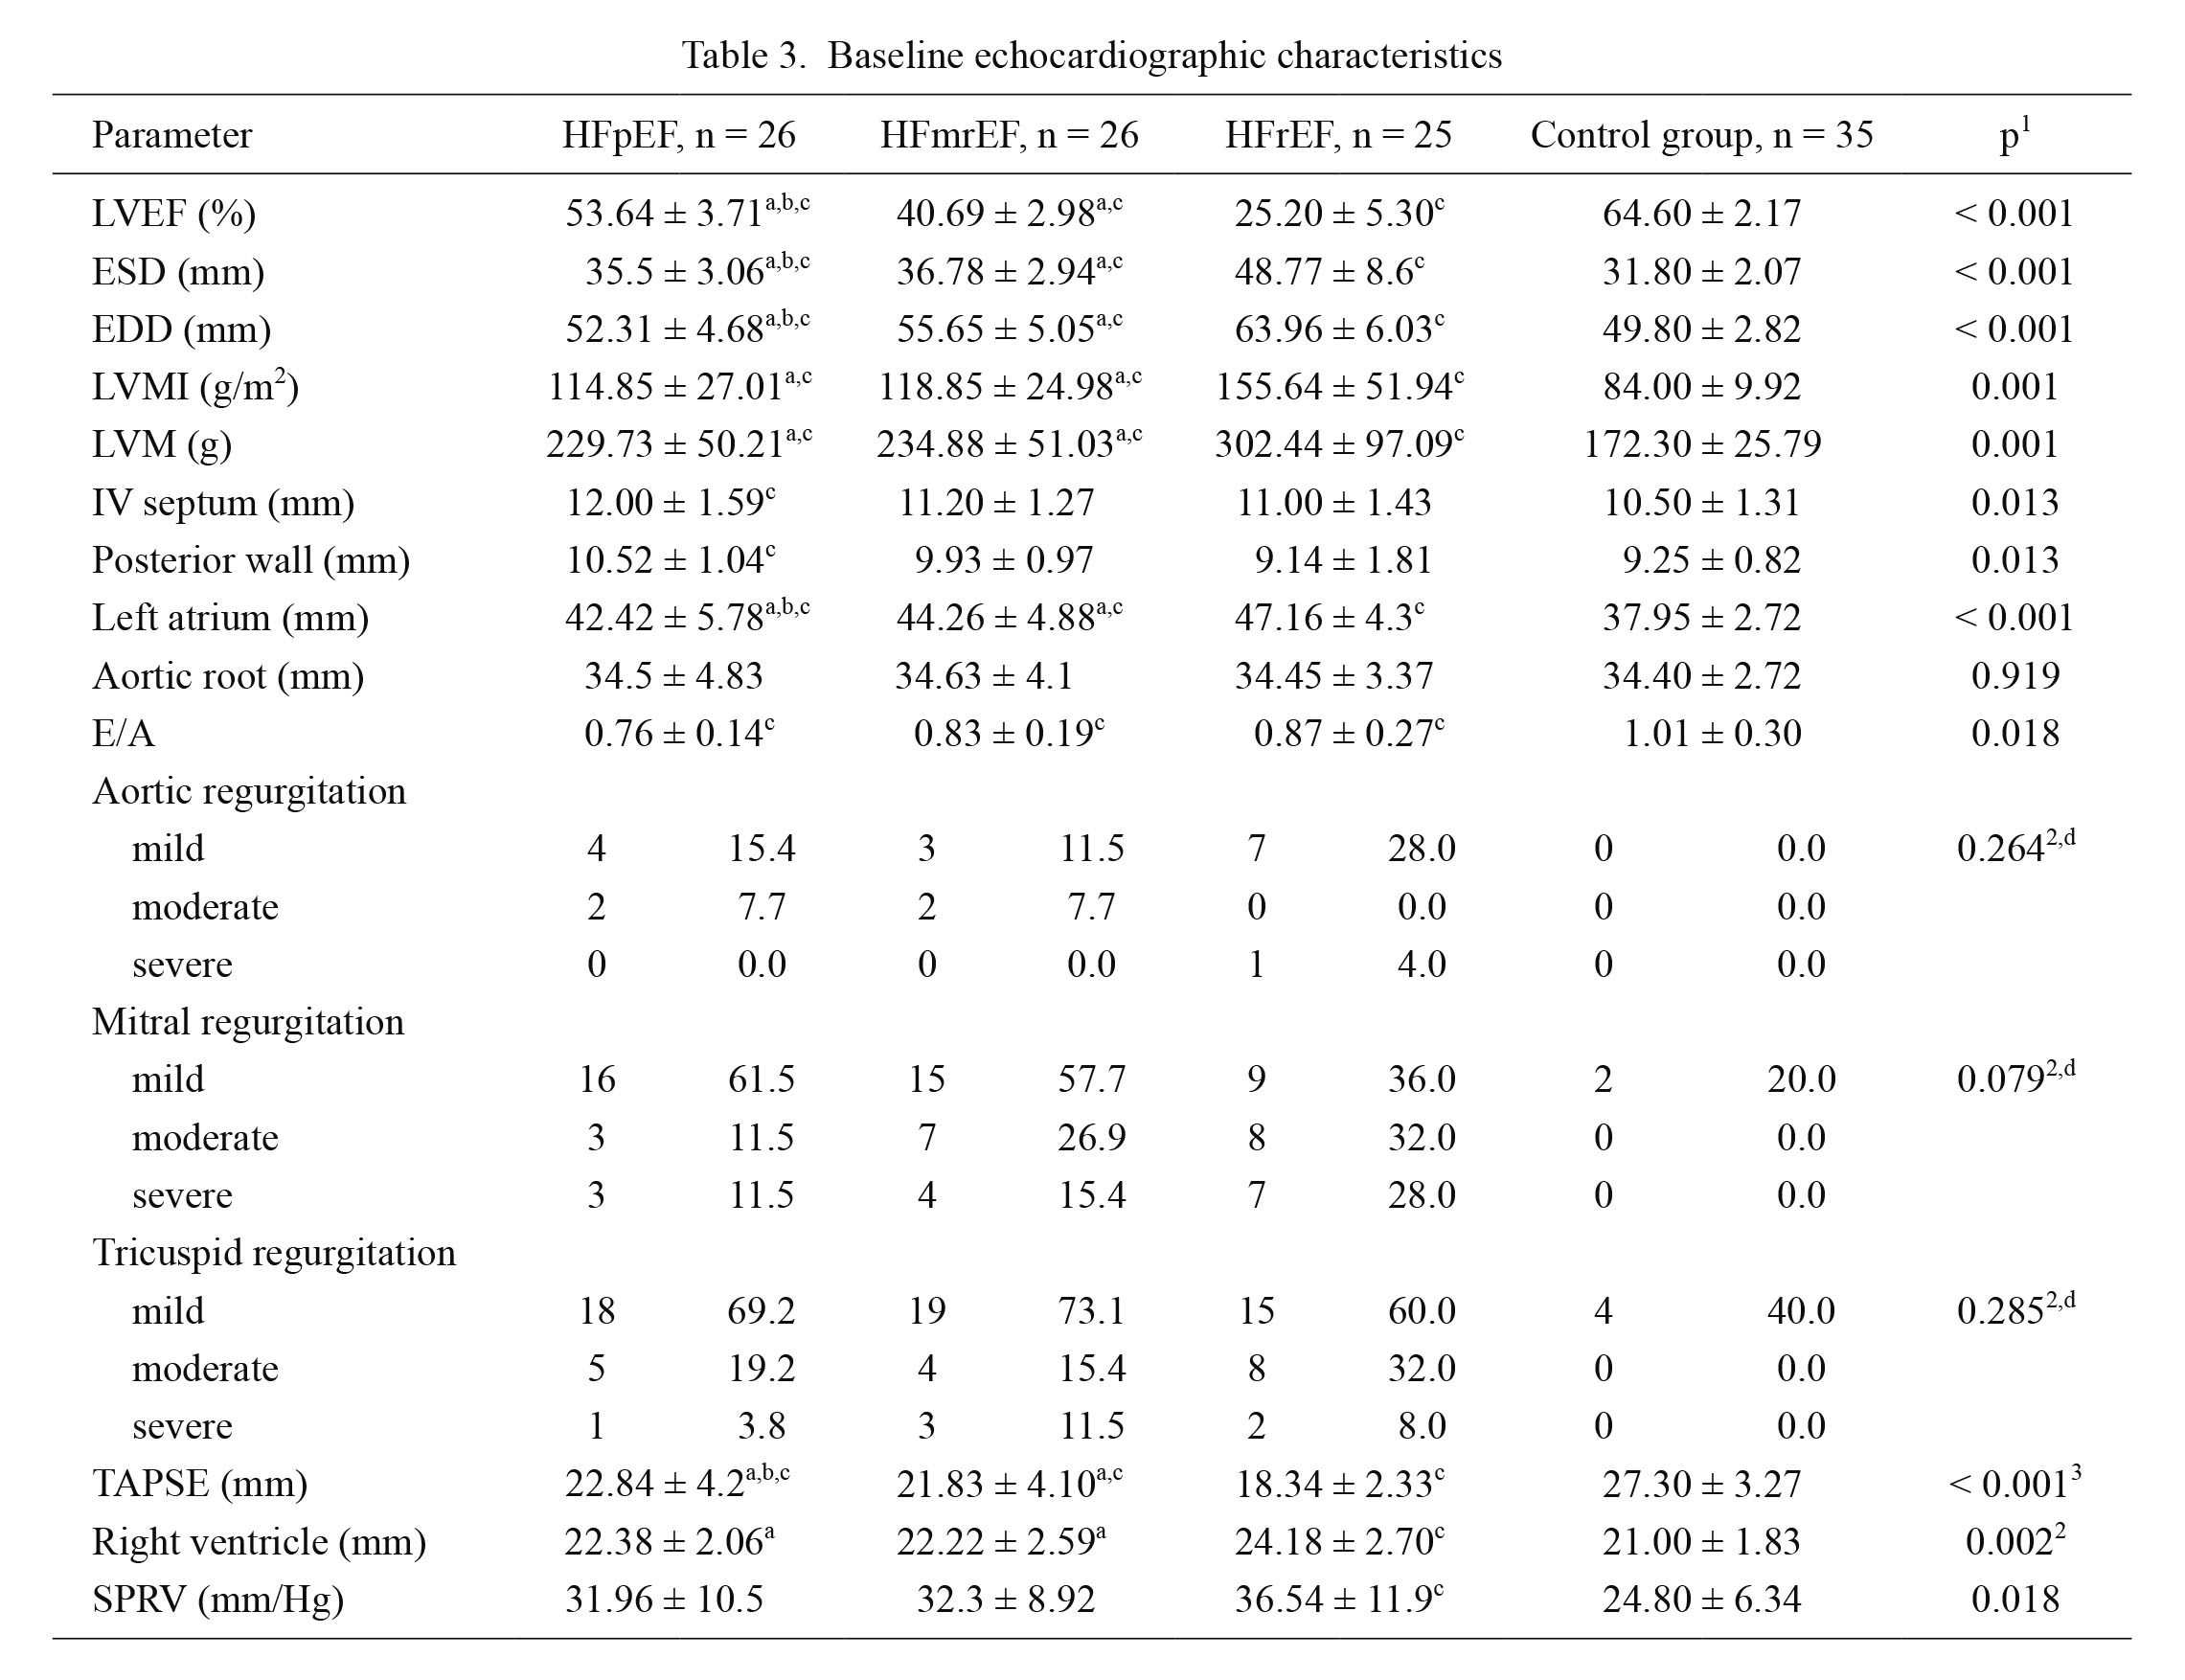
Regarding echocardiographic parameters, statistically significant differences were obtained in ESD (p < 0.001), EDD (p < 0.001), LVMI (p = 0.001), LVM (p = 0.001), interventricular septum diameter (p = 0.013), posterior wall diameter (p = 0.013), left atrium diameter (p < 0.001), diastolic dysfunction parameter, E/A (p = 0.018), TAPSE (p < 0.001), right ventricle diameter (p = 0.002) and systolic pressure of right ventricle (p = 0.018). The results of clinical and control group are presented in Table 3.
Clinical, laboratory and biomarker correlates of LVMI stratified by EF category
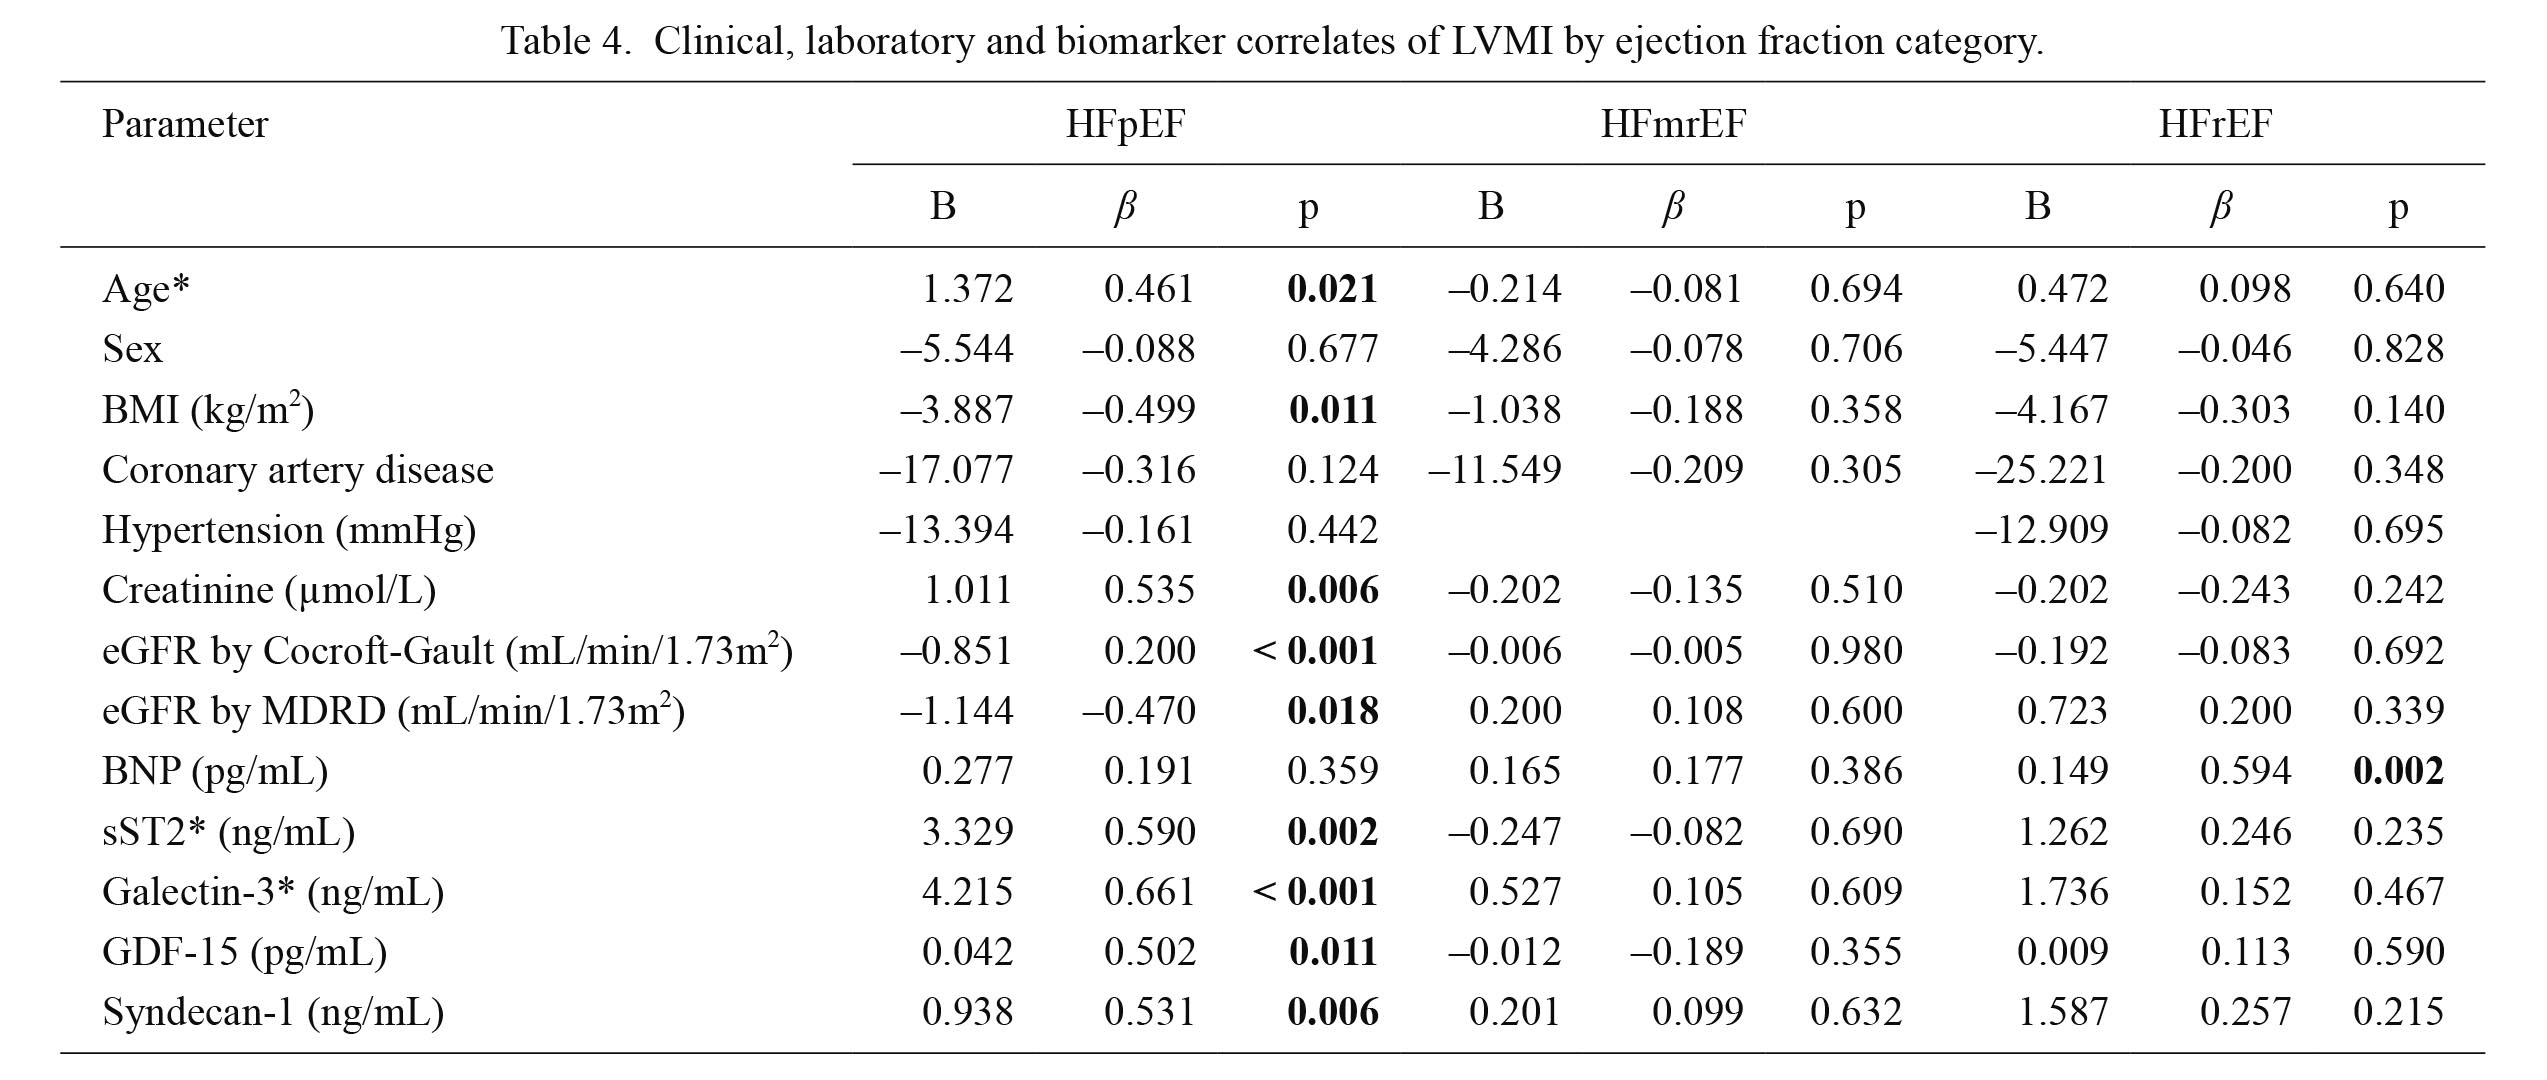
Univariable and multivariable (shown in brackets) analyses of clinical, laboratory and each biomarker correlates of LVMI are presented in Table 4 and its legends. In HFpEF patients statistically significant independent correlates of higher LVMI are as follows: older age (B = 1.372, β = 0.461, p = 0.021), higher body mass index (B = –3.887, β = –0.499, p = 0.011), higher plasma creatinine (B = 1.011, β = 0.535, p = 0.006), lower glomerular filtration rate estimated by the Cocroft-Gault equation (B = –0.851, β = 0.200, p < 0.001) and by modification of diet in renal disease (MDRD) equation (B = –1.144, β = –0.470, p = 0.018) and elevated plasma concentration of biomarkers: sST2 (B = 3.329, β = 0.590, p = 0.002), galectin-3 (B = 4.215, β = 0.661, p < 0.001), GDF-15 (B = 0.042, β = 0.502, p = 0.011) and syndecan-1 (B = 0.938, β = 0.531, p = 0.006). In multivariable analysis, after adjustment for age, BMI, sST2, galectin-3, GDF-15, and syndecan-1, correlates of LVMI in HFpEF were older age (B = 1.041, β = 0.349, p = 0.025) and elevated galectin-3 levels (B = 3.799, β = 0.595, p < 0.001).
The same multivariable analysis evidenced that sST2 concentration correlated with LVMI in HFrEF (B = 3.237, β = 0.632, p = 0.010), as shown in the legends to Table 4. However, BNP concentrations did not show any significant correlation with LVMI in HFpEF patients. Moreover, in patients with HFrEF a significant independent correlate of higher LVMI was an increased plasma concentration of BNP (B = 1.049, β = 0.594, p = 0.002). There were no interactions of LVMI with any of the evaluated parameters in HFmrEF patients. All data are shown in Table 4.
Biomarker correlates of echocardiographic parameters stratified by EF category
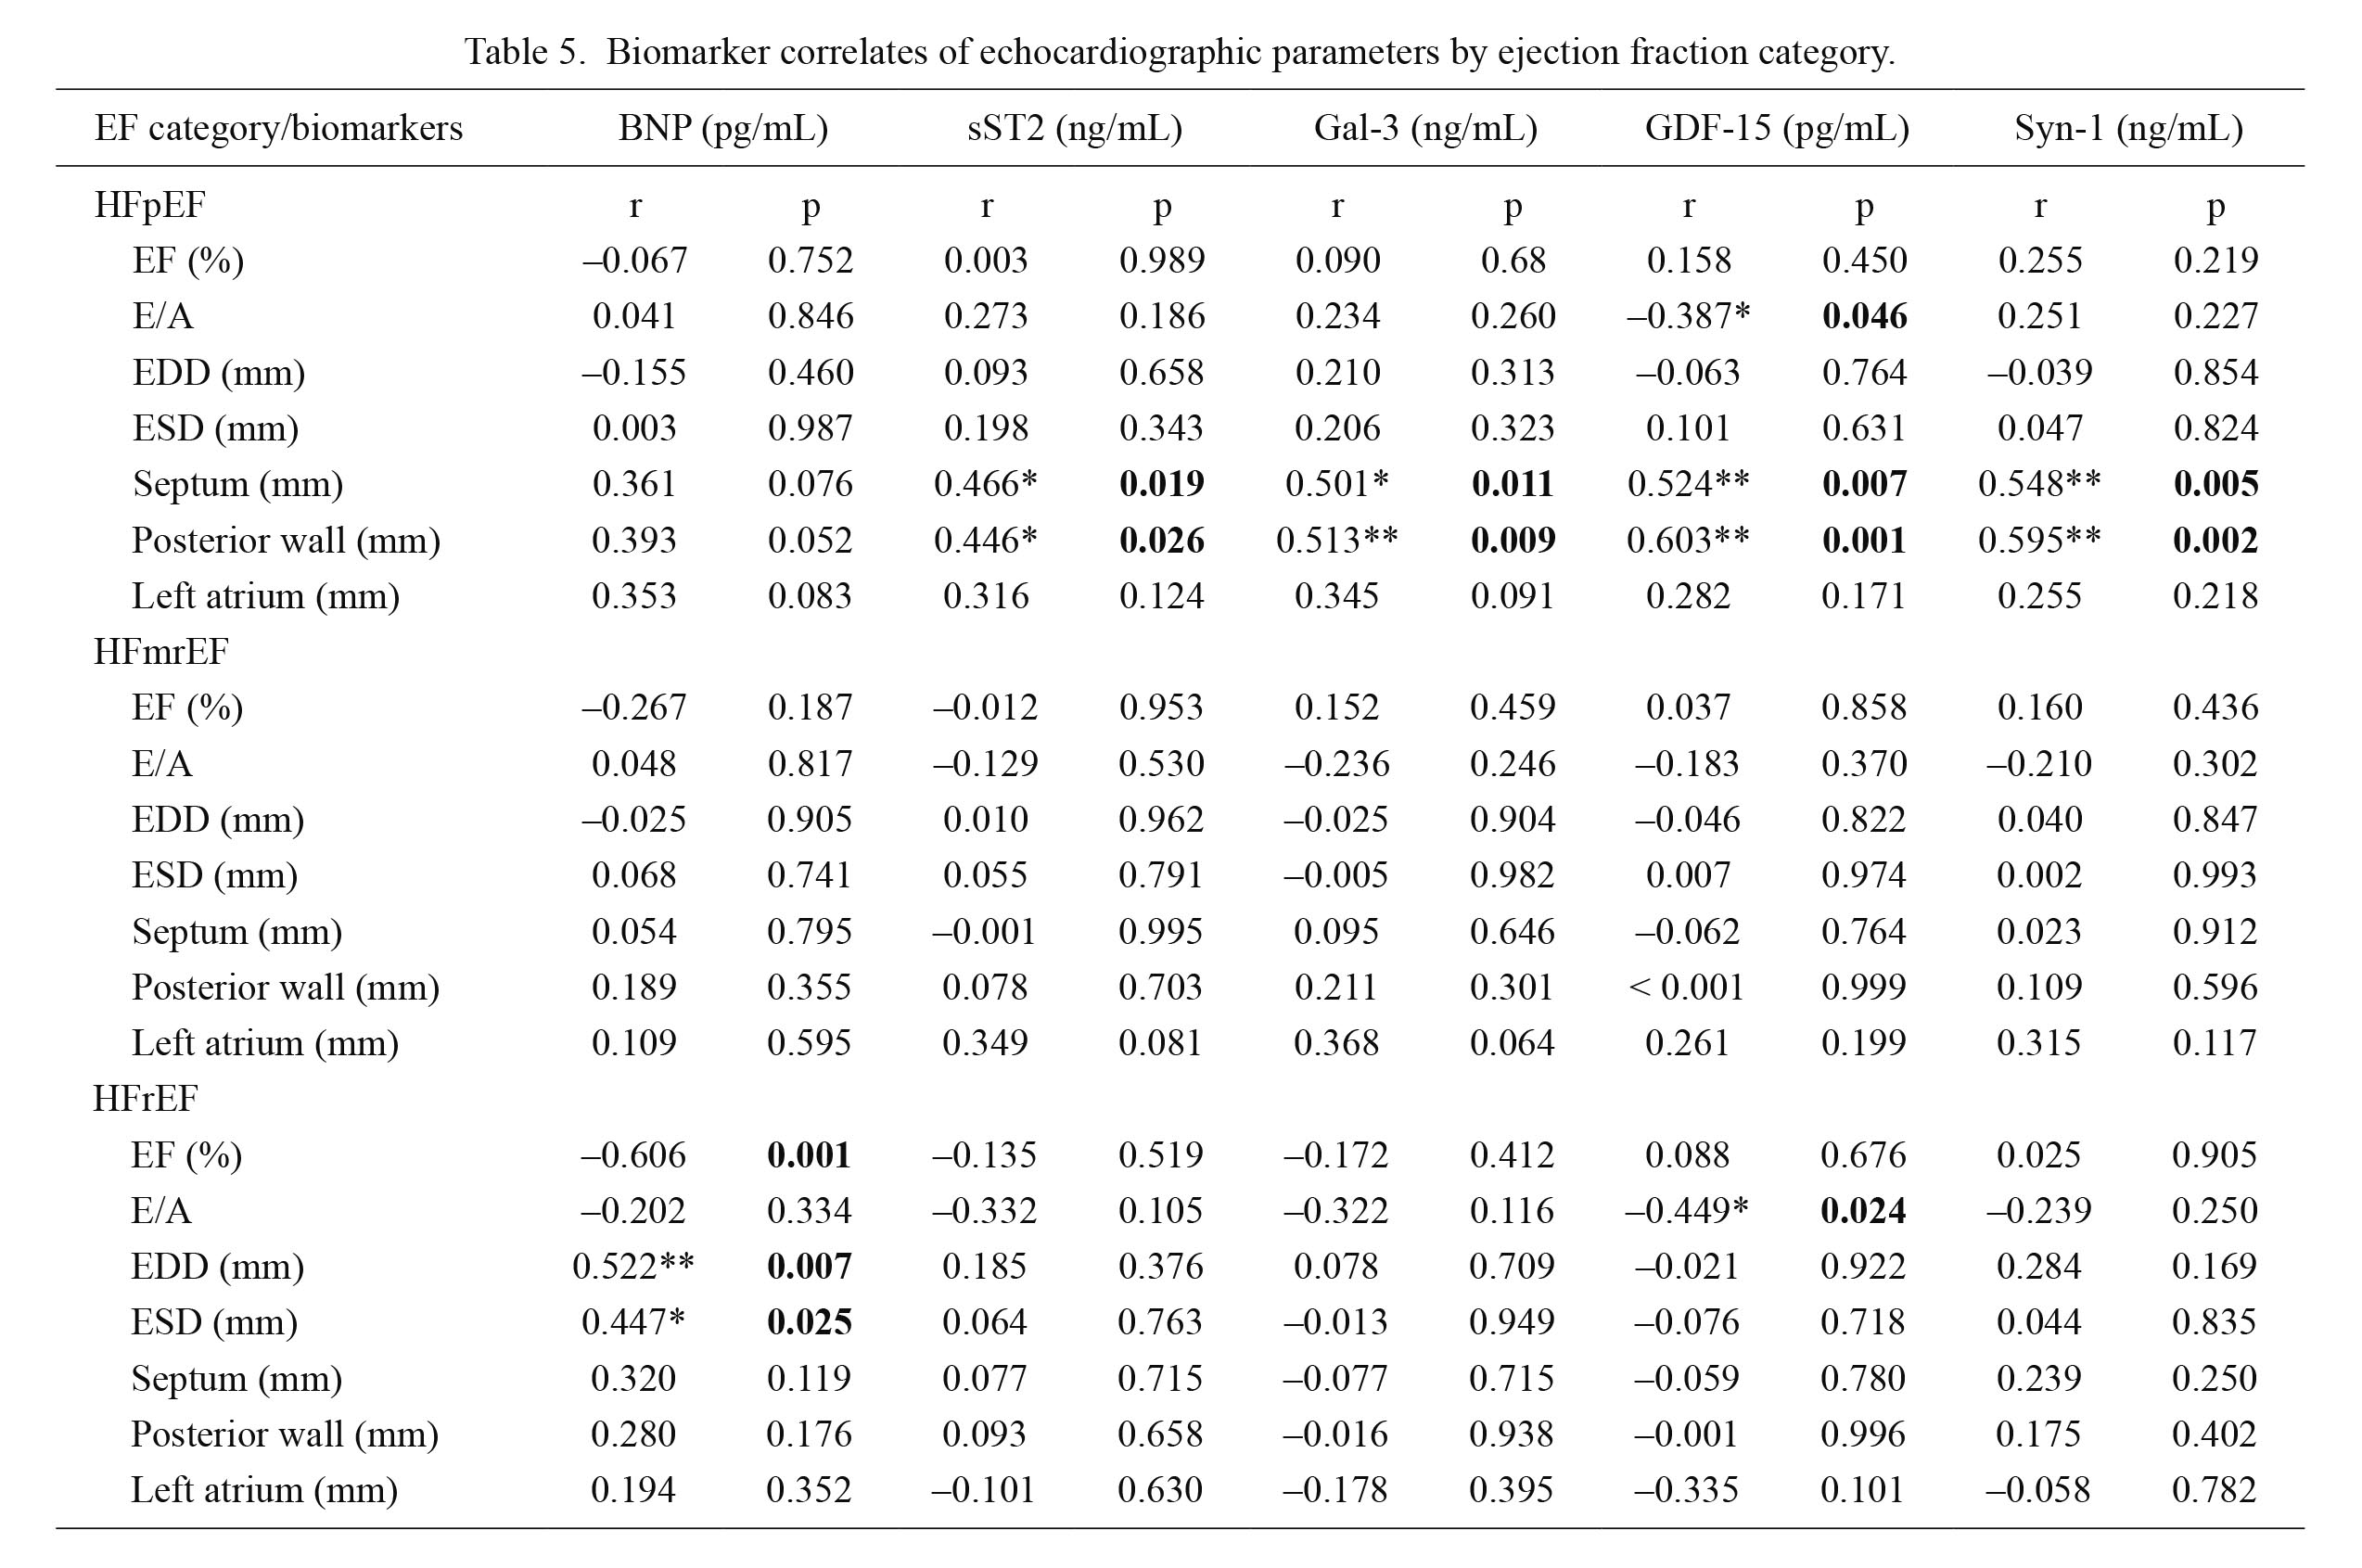
Biomarker correlates of echocardiographic parameters stratified by EF category are presented in Table 5. We assessed EF, E/A, EDD, ESD, diameters of septum, posterior wall and left atrium. In HFpEF patients cardiac remodeling biomarkers strongly correlated with the diameters of the posterior wall and the septum. The observed correlations of the septum were: sST2 (r = 0.466, p = 0.019), galectin-3 (r = 0.501, p = 0.011), GDF-15 (r = 0.524, p = 0.007) and syndecan-1 (r = 0.548, p = 0.005), while correlations of posterior wall were: sST2 (r = 0.446, p = 0.026), galectin-3 (r = 0.513, p = 0.009), GDF-15 (r = 0.603, p = 0.001) and syndecan-1 (r = 0.595, p = 0.002), respectively. Moreover, plasma BNP in HFpEF demonstrated correlations with diameters of the septum, the posterior wall and left atrium, but with no degree of statistical significance. In HFrEF patients plasma BNP strongly correlated with EF (r = –0.606, p = 0.001), with EDD (r = 0.522, p = 0.007) and ESD (r = 0.447, p = 0.025). Finally, the biomarker that demonstrated significant correlations with diastolic dysfunction in both groups of HF was GDF-15, being associated with E/A (r = –0.387, p = 0.046) in HFpEF and (r = –0.449, p = 0.024) in HFrEF.
To the same extent, as previously documented, in HFmrEF patients no significant correlations were demonstrated between echocardiographic parameters and evaluated biomarkers.
Discussion
The current study provides several clinically relevant findings: (i) plasma concentrations of all evaluated biomarkers were highest in HFrEF, and lowest in HFpEF; (ii) HFmrEF demonstrated an independent and intermediate biochemical and echocardiographical profile; (iii) plasma concentrations of cardiac remodeling biomarkers independently correlated with echocardiographic parameters of left ventricular hypertrophy in HFpEF, but not in HFrEF and HFmrEF; (iv) HFmrEF showed no statistically significant difference between the observed clinical and echocardiographic parameters and concentrations of biomarkers; (v) plasma BNP concentration strongly and independently correlated with LVMI, ejection fraction, end-diastolic and end-systolic dimensions in HFrEF; (vi) plasma sST2 concentration, adjusted for age, sex and comorbidities also correlated with LVMI in HFrEF; and (vii) GDF-15 demonstrated correlation with the diastolic dysfunction parameter (E/A) in both HFpEF and HFrEF.
To the best of our knowledge this is the first study that employed cardiac remodeling biomarkers in order to elucidate their correlations with echocardiographic parameters of left ventricular hypertrophy in three subtypes of chronic heart failure patients, HFpEF, HFmrEF and HFrEF. Moreover, there is insufficient evidence for their involvement in clinical practice (Ponikowski et al. 2016), and our results indicate that there may be some advantage in employing these markers, particularly in HFpEF.
Cardiac remodeling is an expected phenomenon in the clinical course of HF, predominantly resulting from interstitial fibrosis and left ventricular hypertrophy, leading to aggravation of cardiac dysfunction (Heusch et al. 2014). Left ventricular hypertrophy, together with increased left ventricular mass (LVM), represents an independent predictor of cardiovascular morbidity and premature death, in population studies, including chronic heart failure (Drazner et al. 2004; Kishi et al. 2014; Heinzel et al. 2015).
Soluble ST2 and galectin-3 are proven biomarkers of cardiac remodeling (Sharma et al. 2004; Bayes-Genis et al. 2015) and according to our results, both indicated strong correlations with LV hypertrophy parameters, further confirming their possible role in HF progression. The majority of published data favor the utility of sST2 and galectin-3 measurements in HF patients with EF > 50%, even suggesting a possible identification of subgroups of patients who may have the best response to anti-fibrotic therapy (D’Elia et al. 2015). Elevated plasma concentration of sST2 was demonstrated to be associated with parameters which indicate disease severity in patients with EF > 50% (Zile et al. 2016). It was also determined that, regardless of EF, sST2 was an independent predictor of mortality in the HF group (Manzano-Fernandez et al. 2011) and associated with diastolic dysfunction (Wang et al. 2013). Based on our findings, plasma levels of sST2 correlated with LV hypertrophy parameters, but not with diastolic dysfunction in HFpEF patients. However, after multivariable adjustments, sST2 also significantly correlated with increased LVMI in HFrEF. Our findings, therefore, expand the potential purpose of sST2 determination, beyond being useful in only HFpEF assessment.
We also established strong correlations of plasma GDF-15 and syndecan-1 concentrations with LV hypertrophy parameters; in HFpEF, to the same extent as galectin-3 and sST2. At the same time, an increased plasma concentration of GDF-15 significantly correlated with diastolic dysfunction (E/A) in two subtypes of heart failure: HFpEF and HFrEF. GDF-15, widely regarded as a marker of inflammation, has already been verified as a promising marker of diastolic dysfunction in HFpEF (Santhanakrishnan et al. 2012; Meluzin and Tomandi 2015). Our results are in line with these findings, manifesting their correlations with the parameters of LV hypertrophy, most probably in the context of chronic inflammation. Moreover, cut-off values for GDF-15 revealed a high sensitivity and specificity for the diagnosis of HFpEF (Stahrenberg et al. 2010; Santhanakrishnan et al. 2012). Our findings may give priority to this biomarker in the assessment of diastolic dysfunction, due to its strong correlation with E/A (test for diastolic performance of the heart), regardless of EF.
The plasma concentration of syndecan-1 showed similar results to the previously discussed biomarkers, also in EF > 50%. It was documented that its plasma concentration correlated with remodeling markers, sST2 and galectin-3, and that it independently correlated with clinical outcomes in HFpEF, but not HFrEF (Lei et al. 2012). The increase of syndecan-1 concentration in conditions such as ischemia and reperfusion may be considered protective (Reitsma et al. 2007). In chronic states, HF for instance, it rather reflects profibrotic processes and LV hypertrophy. Whether this elevation is of clinical significance relating to patients who presented with a higher risk of cardiac remodeling, predominantly in the HFpEF group, is yet to be established. Our findings give priority to syndecan-1 measurement primarily in HFpEF patients (EF > 50%).
Brain natriuretic peptide is currently used in the assessment of HF; however, its exact role in pathophysiology or phenotyping of HFpEF patients has not been sufficiently clarified (D’Elia et al. 2015). Our findings do not significantly contribute to that body of knowledge, since we did not prove the correlation of BNP and echocardiography parameters in HFpEF patients. This result is most probably due to the fact that BNP reflects increased wall stress, which exists in HFrEF, but does not indicate structural changes, documented in HFpEF (D’Elia et al. 2015). It may be that the measurement of BNP in HFpEF should be performed along with echocardiography and clinical assessment, in order to enhance the accuracy of results.
In conclusion, we document higher levels of cardiac remodeling biomarkers (sST2, galectin-3, GDF-15, and syndecan-1) and BNP in patients diagnosed with HF, whereas all of the evaluated plasma concentrations show a similar profile, the highest being in HFrEF patients and the lowest in HFpEF.
Higher plasma concentrations of all cardiac remodeling biomarkers were demonstrated to be independent and significantly correlated with LV hypertrophy parameters, left ventricular mass index (LVMI), and the diameters of the septum and the posterior wall in HFpEF, whereas plasma BNP concentrations were strongly and independently correlated with LVMI, ejection fraction, end-diastolic and end-systolic dimensions in HFrEF. GDF-15 demonstrated significant correlations with diastolic dysfunction in both HFpEF and HFrEF. The HFmrEF subgroup showed no statistical significance between observed clinical and echocardiographic parameters and concentrations of biomarkers, therefore the usefulness of these markers in HFmrEF patients is yet to be confirmed.
There is a logical need for the identification of circulating biomarkers for left ventricular hypertrophy monitoring, thereby allowing the timely identification of patients that are at high risk of disease progression. These results suggest a prominent role for cardiac remodeling biomarkers to fulfill when it comes to HFpEF; however, additional research in the larger group of patients is warranted.
Acknowledgments
This research was supported by a grant from the Ministry of Science and Technological Development, project number 43012 and by the Project of Serbian Academy of Science O-06-17. It was also supported by an Internal project of Faculty of Medicine, University of Nis, 2020, conducted by Dijana Stojanovic, M.D., Ph.D.
Author Contributions
Valentina Mitic and Dijana Stojanovic conceived the concept of the study and contributed to the design of the research. Valentina Mitic, Dejan Petrovic and Marina Deljanin Ilic were involved in clinical work and data collection. All authors of the study analyzed and interpreted results. Dijana Stojanovic, Miodrag Stojanovic and Aleksandra Ignjatovic completed statistical analyses. Valentina Mitic, Dijana Stojanovic, Marina Deljanin Ilic, Nikola Stefanovic, Gordana Kocic and Vladmila Bojanic searched the literature and prepared the manuscript. Marina Deljanin Ilic, Miodrag Stojanovic and Gordana Kocic coordinated funding for the project. All authors edited and approved the final version of the manuscript critically for important intellectual content.
Conflict of Interest
The authors declare no conflict of interest.
References
-
Bayes-Genis,
A.,
Richards,
A.M.,
Maisel,
A.S.,
Mueller,
C. &
Ky,
B.
(2015) Multimarker testing with ST2 in chronic heart failure. Am. J. Cardiol., 115, 76B-80B.
-
Carnes,
J. &
Gordon,
G.
(2020) Biomarkers in heart failure with preserved ejection fraction: an update on progress and future challenges. Heart Lung Circ., 29, 62-68.
-
Chow,
S.L.,
Maisel,
A.S.,
Anand,
I.,
Bozkurt,
B.,
de Boer,
R.A.,
Felker,
G.M.,
Fonarow,
G.C.,
Greenberg,
B.,
Januzzi,
J.L. Jr.,
Kiernan,
M.S.,
Liu,
P.P.,
Wang,
T.J.,
Yancy,
C.W. &
Zile,
M.R.;
American Heart Association Clinical Pharmacology Committee of the Council on Clinical Cardiology
(2017) Role of biomarkers for the prevention, assessment, and management of heart failure: a scientific statement from the American Heart Association. Circulation, 135, e1054-e1091.
-
D’Elia,
E.,
Vaduganathan,
M.,
Gori,
M.,
Gavazzi,
A.,
Butler,
J. &
Senni,
M.
(2015) Role of biomarkers in cardiac structure phenotyping in heart failure with preserved ejection fraction: critical appraisal and practical use. Eur. J. Heart Fail., 17, 1231-1239.
-
Drazner,
M.H.,
Rame,
J.E.,
Marino,
E.K.,
Gottdiener,
J.S.,
Kitzman,
D.W.,
Gardin,
J.M.,
Manolio,
T.A.,
Dries,
D.L. &
Siscovick,
D.S.
(2004) Increased left ventricular mass is a risk factor for the development of a depressed left ventricular ejection fraction within five years: the cardiovascular health study. J. Am. Coll. Cardiol., 43, 2207-2215.
-
Heinzel,
F.R.,
Hohendanner,
F.,
Jin,
G.,
Sedej,
S. &
Edelmann,
F.
(2015) Myocardial hypertrophy and its role in heart failure with preserved ejection fraction. J. Appl. Physiol.(1985), 119, 1233-1242.
-
Heusch,
G.,
Libby,
P.,
Gersh,
B.,
Yellon,
D.,
Bohm,
M.,
Lopaschuk,
G. &
Opie,
L.
(2014) Cardiovascular remodelling in coronary artery disease and heart failure. Lancet, 383, 1933-1943.
-
Kishi,
S.,
Armstrong,
A.C.,
Gidding,
S.S.,
Jacobs,
D.R. Jr.,
Sidney,
S.,
Lewis,
C.E.,
Schreiner,
P.J.,
Liu,
K. &
Lima,
J.A.
(2014) Relation of left ventricular mass at age 23 to 35 years to global left ventricular systolic function 20 years later (from the Coronary Artery Risk Development in Young Adults study). Am. J. Cardiol., 113, 377-383.
-
Lang,
R.M.,
Badano,
L.P.,
Mor-Avi,
V.,
Afilalo,
J.,
Armstrong,
A.,
Ernande,
L.,
Flachskampf,
F.A.,
Foster,
E.,
Goldstein,
S.A.,
Kuznetsova,
T.,
Lancellotti,
P.,
Muraru,
D.,
Picard,
M.H.,
Rietzschel,
E.R.,
Rudski,
L., et al.
(2015) Recommendations for cardiac chamber quantification by echocardiography in adults: an update from the American Society of Echocardiography and the European Association of Cardiovascular Imaging. Eur. Heart J. Cardiovasc. Imaging, 16, 233-270.
-
Lei,
J.,
Xue,
S.N.,
Wu,
W.,
Zhou,
S.X.,
Zhang,
Y.L.,
Yuan,
G.Y. &
Wang,
J.F.
(2012) Increased level of soluble syndecan-1 in serum correlates with myocardial expression in a rat model of myocardial infarction. Mol. Cell. Biochem., 359, 177-182.
-
Lunde,
I.G.,
Herum,
K.M.,
Carlson,
C.C. &
Christensen,
G.
(2016) Syndecans in heart fibrosis. Cell Tissue Res., 365, 539-552.
-
Manzano-Fernandez,
S.,
Mueller,
T.,
Pascual-Figal,
D.,
Truong,
Q.A. &
Januzzi,
J.L.
(2011) Usefulness of soluble concentrations of interleukin family member ST2 as predictor of mortality in patients with acutely decompensated heart failure relative to left ventricular ejection fraction. Am. J. Cardiol., 107, 259-267.
-
Meluzin,
J. &
Tomandl,
J.
(2015) Can biomarkers help to diagnose early heart failure with preserved ejection fraction? Dis. Markers, 2015, 426045.
-
Metra,
M. &
Teerlink,
J.R.
(2017) Heart failure. Lancet, 390, 1981-1995.
-
Mueller,
T.,
Leitner,
I.,
Egger,
M.,
Haltmayer,
M. &
Dieplinger,
B.
(2015) Association of the biomarkers soluble ST2, galectin-3 and growth-differentiation factor-15 with heart failure and other non-cardiac diseases. Clin. Chim. Acta, 445, 155-160.
-
Passino,
C.,
Barison,
A.,
Vergaro,
G.,
Gabutti,
A.,
Borrelli,
C.,
Emdin,
M. &
Clerico,
A.
(2015) Markers of fibrosis, inflammation, and remodeling pathways in heart failure. Clin. Chim. Acta, 443, 29-38.
-
Ponikowski,
P.,
Voors,
A.A.,
Anker,
S.D.,
Bueno,
H.,
Cleland,
J.G.,
Coats,
A.J.,
Falk,
V.,
Gonzalez-Juanatey,
J.R.,
Harjola,
V.P.,
Jankowska,
E.A.,
Jessup,
M.,
Linde,
C.,
Nihoyannopoulos,
P.,
Parissis,
J.T.,
Pieske,
B., et al.
(2016) 2016 ESC Guidelines for the diagnosis and treatment of acute and chronic heart failure: the task force for the diagnosis and treatment of acute and chronic heart failure of the European Society of Cardiology (ESC). Developed with the special contribution of the Heart Failure Association (HFA) of the ESC. Eur. J. Heart Fail., 18, 891-975.
-
R Core Team
(2014) R: a language and environment for statistical computing. R Foundation for Statistical Computing, Vienna, Austria. http://www.R-project.org/ [Accessed: November 30, 2017].
-
Reitsma,
S.,
Slaaf,
D.W.,
Vink,
H.,
van Zandvoort,
M.A. &
oude Egbrink,
M.G.
(2007) The endothelial glycocalyx: composition, functions, and visualization. Pflugers Arch., 454, 345-359.
-
Richards,
A.M.
(2018) Future biomarkers in cardiology: my favourites. Eur. Heart J., Suppl 20, G37-44.
-
Rudski,
L.G.,
Lai,
W.W.,
Afilalo,
J.,
Hua,
L.,
Handschumacher,
M.D.,
Chandrasekaran,
K.,
Solomon,
S.D.,
Louie,
E.K. &
Schiller,
N.B.
(2010) Guidelines for the echocardiographic assessment of the right heart in adults: a report from the American Society of Echocardiography endorsed by the European Association of Echocardiography, a registered branch of the European Society of Cardiology, and the Canadian Society of Echocardiography. J. Am. Soc. Echocardiogr., 23, 685-713; quiz 786-688.
-
Santhanakrishnan,
R.,
Chong,
J.P.,
Ng,
T.P.,
Ling,
L.H.,
Sim,
D.,
Leong,
K.T.,
Yeo,
P.S.,
Ong,
H.Y.,
Jaufeerally,
F.,
Wong,
R.,
Chai,
P.,
Low,
A.F.,
Richards,
A.M. &
Lam,
C.S.
(2012) Growth differentiation factor 15, ST2, high-sensitivity troponin T, and N-terminal pro brain natriuretic peptide in heart failure with preserved vs. reduced ejection fraction. Eur. J. Heart Fail., 14, 1338-1347.
-
Schellings,
M.W.,
Vanhoutte,
D.,
van Almen,
G.C.,
Swinnen,
M.,
Leenders,
J.J.,
Kubben,
N.,
van Leeuwen,
R.E.,
Hofstra,
L.,
Heymans,
S. &
Pinto,
Y.M.
(2010) Syndecan-1 amplifies angiotensin II-induced cardiac fibrosis. Hypertension, 55, 249-256.
-
Sharma,
U.C.,
Pokharel,
S.,
van Brakel,
T.J.,
van Berlo,
J.H.,
Cleutjens,
J.P.,
Schroen,
B.,
Andre,
S.,
Crijns,
H.J.,
Gabius,
H.J.,
Maessen,
J. &
Pinto,
Y.M.
(2004) Galectin-3 marks activated macrophages in failure-prone hypertrophied hearts and contributes to cardiac dysfunction. Circulation, 110, 3121-3128.
-
Stahrenberg,
R.,
Edelmann,
F.,
Mende,
M.,
Kockskamper,
A.,
Dungen,
H.D.,
Luers,
C.,
Binder,
L.,
Herrmann-Lingen,
C.,
Gelbrich,
G.,
Hasenfuss,
G.,
Pieske,
B. &
Wachter,
R.
(2010) The novel biomarker growth differentiation factor 15 in heart failure with normal ejection fraction. Eur. J. Heart Fail., 12, 1309-1316.
-
Suthahar,
N.,
Meijers,
W.C.,
Sillje,
H.H.W.,
Ho,
J.E.,
Liu,
F.T. &
de Boer,
R.A.
(2018) Galectin-3 activation and inhibition in heart failure and cardiovascular disease: an update. Theranostics, 8, 593-609.
-
Tromp,
J.,
van der Pol,
A.,
Klip,
I.T.,
de Boer,
R.A.,
Jaarsma,
T.,
van Gilst,
W.H.,
Voors,
A.A.,
van Veldhuisen,
D.J. &
van der Meer,
P.
(2014) Fibrosis marker syndecan-1 and outcome in patients with heart failure with reduced and preserved ejection fraction. Circ. Heart Fail., 7, 457-462.
-
Wang,
Y.C.,
Yu,
C.C.,
Chiu,
F.C.,
Tsai,
C.T.,
Lai,
L.P.,
Hwang,
J.J. &
Lin,
J.L.
(2013) Soluble ST2 as a biomarker for detecting stable heart failure with a normal ejection fraction in hypertensive patients. J. Card. Fail., 19, 163-168.
-
Zile,
M.R.,
Jhund,
P.S.,
Baicu,
C.F.,
Claggett,
B.L.,
Pieske,
B.,
Voors,
A.A.,
Prescott,
M.F.,
Shi,
V.,
Lefkowitz,
M.,
McMurray,
J.J. &
Solomon,
S.D. ;
Prospective Comparison of ARNI with ARB on Management of Heart Failure with Preserved Ejection Fraction (PARAMOUNT) Investigators
(2016) Plasma biomarkers reflecting profibrotic processes in heart failure with a preserved ejection fraction: data from the Prospective Comparison of ARNI With ARB on Management of Heart Failure with Preserved Ejection Fraction Study. Circ. Heart Fail., 9, pii: e002551.