Abstract
A developmental disorder is condition in which a person has deficiency in either physical, learning, language, or behavior, and people with developmental disorders often experience difficulties in their social lives. In Japan, no systematic surveys of developmental disorders targeting local residents have been reported, including working-age. Hence, we aimed to estimate the prevalence and determine the psychosocial factors associated with life satisfaction and psychological distress in the Fukushima prefecture. We conducted an Internet questionnaire survey among 4,030 residents (2,136 men and 1,894 women) aged 16-65 years who either had a job or were willing to work. Developmental disorders were defined based on participants’ self-reported history diagnosed by a psychiatrist or their responses to screening questionnaires. The prevalence of developmental disorders was 9.6% (n = 386). Subsequently, a secondary survey (on a first-come, first-served basis) was conducted to assess psychosocial factors among those with developmental disorders, and responses were received from 121 men and 79 women aged 16-65. Being a regular employee and disclosing diagnosis at the workplace was associated with higher job satisfaction. The participants living with a spouse and/or their children tended to feel satisfied with their life (multivariable-adjusted odds ratio (OR): 3.55), job (OR: 3.20), and income (OR: 4.68), whereas those living with parents tended to not feel satisfied with their life, job, or income. Working as a regular employee, having co-workers who understand developmental disorders, and living with a spouse or children are important social factors that increase life satisfaction among people with developmental disorders.
Introduction
Developmental disorders include a variety of common neuropsychiatric disorders, such as attention-deficit/hyperactivity disorder (ADHD), autism spectrum disorder (ASD), and specific learning disorder (SLD). ADHD is characterized by inattentiveness, hyperactivity, and impulsiveness (American Psychiatric Association 2013), ASD is characterized by impaired social communication and limited interests, repetitive behavioral symptoms (American Psychiatric Association 2013), and SLD refers to difficulty reading, writing, or calculating (American Psychiatric Association 2013). Thus, some people with these disorders experience difficulties at workplace. In fact, 61% of people with ADHD between the age of 23 and 32 years are reported to be more likely to have ever been fired compared with only 43% of those without ADHD (Kuriyan et al. 2013). Furthermore, a previous study reported that 35.9% of people aged 19-60 years with Asperger syndrome, a form of ASD, were unemployed, regardless of whether they had intellectual or speech disabilities (Kirchner and Dziobek 2014).
The prevalence of ADHD has been reported to be 3.0%-7.5% in school-age children (Goldman et al. 1998), and the prevalence in adults has been suggested to be 1.0%-6.0% (Wender et al. 2001). The estimated prevalence of ADHD in adults (18-44 years) was 4.4% in the United States (Kessler et al. 2006), 3.4% (range 1.2%-7.3%) in 10 countries in the Americas, Europe and the Middle East (Fayyad et al. 2007), and 3.6% in Brazil according to the Diagnostic and Statistical Manual of Mental Disorders-5 (DSM-5) criteria (Matte et al. 2015). On the other hand, the prevalence of ASD has been reported to be 1.8%-3.2% in Japan (Kawamura et al. 2008; Saito et al. 2020), 1.9% in the United States (Maenner et al. 2020), and 0.6% worldwide (range, 0.10%-1.89%) (Elsabbagh et al. 2012). Therefore, the issue of supporting employment for people with developmental disorders is of social importance given the prevalence of these disorders.
Genetic research on developmental disorders has progressed (Iossifov et al. 2014; de la Torre-Ubieta et al. 2016; Vorstman et al. 2017), neurobiological aspects have been explored (Sonuga-Barke et al. 2010; Bourgeron 2015), and particularly, brain function (Castellanos et al. 2002; Shaw et al. 2007; Scheres et al. 2007; Watanabe et al. 2019) and behavioral characteristics are better understood than they were in the past (American Psychiatric Association 2013). Some medications can relieve symptoms (Biederman and Spencer 1999; Newcorn et al. 2005; Cheng et al. 2007; Sallee et al. 2009), as can cognitive behavioral therapy, which is a talking therapy that can manage problems of developmental disorders by changing the way their thinking and behaviors. (Safer et al. 2003; Kose et al.2018). Moreover, specific laws and welfare support systems for people with developmental disorders have been established in Japan (JEED, Japan Organization for Employment of the Elderly, Persons with Disabilities and Job Seekers 2011). However, the epidemiological data of these people in the Japanese working population remains insufficient, including the prevalence rate, the use ratio of welfare support, employment situation, and life satisfaction.
The first purpose of this study was to investigate the prevalence of developmental disorders among the residents of Fukushima prefecture. This is the first study to examine the prevalence of developmental disorders through a questionnaire screening survey of community residents in Japan, including those of working age, in addition to a psychiatrist’s diagnosis. The second purpose of this study was to identify psychosocial factors, such as employment status, family structure, and public support, related to life satisfaction and psychological distress among individuals with developmental disorders in the working population. This will provide information on what type of social support is effective in increasing the life satisfaction, especially for people with developmental disorders who are either working or seeking employment.
Materials and Methods
Study population
In the primary survey, the target population was those aged 16-65 years who had a job or a willingness to work in Fukushima prefecture, which consists of 3 regions: Coastal, Central, and Aizu (mountainside). The total populations for the Coastal, Central, and Aizu regions are 451,276, 1,156,786, and 269,814, respectively; the working populations (aged 16-65 years) for the Coastal, Central, and Aizu regions are 248,106, 650,901, and 138,424, respectively. Because some people with developmental disorders experience difficulties in social life, they may not be adequately sampled in surveys that use health screening and other methods in communities or workplaces. Conversely, the rate of Internet use among people with developmental disorders is the same or higher than that of the general population (Wang et al. 2017). Therefore, we conducted our primary survey via Internet. The e-mail—requiring informed consent to participate in the survey—was sent to resident monitors in Fukushima prefecture (equally represented by sex, age group, and region) who were registered with Rakuten Insight, Inc., between July 17 and July 22, 2019. Ultimately, a total of 4,043 participants provided informed consent and completed the questionnaire. The Ethics Committee of the Fukushima Medical University approved this study (general 30102).
Primary survey: Assessment of developmental disorders
We asked for participants’ age, sex, and the region in which they were currently living in addition to diagnosis of developmental disorders by a psychiatrist, including ADHD, ASD (high-functioning autism, Asperger syndrome, and unspecified developmental disorder), SLD, or other developmental disorder (ODD). For those who did not have any of these diagnoses, we identified individuals suspected of having a developmental disorder by using screening questionnaires: the Adult ADHD Self-Report Screening Scale for DSM-5 (ASRS-5) (Ustun et al. 2017), which is a questionnaire that asks about characteristic ADHD using a cut-off score of 14 for the total score; and the Autism-Spectrum Quotient Japanese version (AQ-J) (Wakabayashi et al. 2004), which is a questionnaire that asks about characteristic ASD, using a cut-off score of 33 for the total score. Using these cut-offs, the sensibility of the AQ-J is 87.8% (Wakabayashi et al. 2004), and that of the ASRS-5 is 91.9% (Ustun et al. 2017).
Consequently, we obtained 4,030 valid responses (total participants) and identified 90 people with developmental disorders by psychiatrists’ diagnosis and 296 people suspected of having developmental disorders using screening questionnaires in the primary survey. We estimated the prevalence of developmental disorders (diagnosed and suspected) by using these data.
Secondary survey: Measurements of life satisfaction and psychological distress
In the next step, we conducted a secondary survey in the 386 total diagnosed/suspected participants. Of these, on a first-come-first-served basis, 200 people took part in the survey between August 1 and August 3, 2019 (Fig. 1). We surveyed every respondent regarding life satisfaction and their family structure (live with marriage partner, own child, and parent), and the Kessler psychological distress scale (K6) (Kessler et al. 2002) was used to measure the impact severity of mental health problems. We regarded a K6 score ≥ 13 as indicative of the presence of non-specific psychological distress (Kessler et al. 2002). We evaluated satisfaction of life, job, and income using a 6-level scale: very satisfied, satisfied, somewhat satisfied, somewhat unsatisfied, unsatisfied, and very unsatisfied, and we defined very satisfied, satisfied, and somewhat satisfied as life satisfaction and all others as unsatisfactory.
Measurements of the usage of mental and employment support and other variables
We asked about job status (workers, job seekers, and unemployed), clinical history of lifestyle-related diseases (hypertension, dyslipidemia, diabetes, gout, periodontal disease), and psychiatric disorders (depression, bipolar disorder, schizophrenia, anxiety disorder, or other).
Each prefecture has systems and facilities for living, medical, and employment support for people with developmental disorders. We asked the participants if they had a mental disability certificate and/or independence support medical recipient identification (ID) (yes/no), which is necessary for them to receive some kind of living, medical, and employment support.
We recorded the usage history of any public employment supports: employment support navigators (Hello Work offices), job training, vocational capability development centers, vocational rehabilitation centers (regional career center), workplace tour and training, trial employment program, employment support services and continuous employment support services, employment quota-levy system for persons with disabilities, and workplace adjustment support (job coaches). Information on the public employment support can be found on the website of the Japan Organization for Employment of the Elderly, Persons with Disabilities, and Job Seekers (JEED 2011). We also asked them about the usage history of livelihood support: day care (cognitive behavior therapy, recreation), disability pension system, and life support services.
For workers, in addition to these questions, we asked about the employment situation and job classification, whether they had worked for one year or longer (yes/no) and whether they had disclosed the diagnosis at the workplace (yes/no). We also asked whether they had anxiety about continuing to work in the current workplace. The anxiety was evaluated on a 4-level scale: no anxiety, almost no anxiety, a little anxiety, and a lot of anxiety. Moreover, we asked about their employment situation: public servant, full-time employee, contract employee, temporary employee, self-employed, sole proprietorship or freelance, part-time job, student, or homemaker. Furthermore, we asked about types of social insurance provided: health, employment, industrial accident, and nursing. Finally, we asked workers who wished to continue to work in their current workplace why they wished so on a 4-level scale: apply, somewhat apply, not very apply, and not apply.
Statistical analysis
Differences in the medical history and proportions of welfare support utilization and family structure among the groups of job status were tested for statistical significance using the Fisher’s exact test. Differences in the medical history, psychosocial factors, and life satisfaction among the groups of developmental disorder were also tested using the Fisher’s exact test. The odds ratios (ORs) of life satisfaction and psychological distress and 95% confidence intervals (CIs) for social factors were calculated with adjustments for age and other potentially confounding factors using the logistic regression model. The potentially confounding factors were age, sex, lifestyle-related diseases, and psychiatric disorders. Since satisfaction of job and income were closely related to job status, the analysis of associations of social factors with satisfaction of job and income were limited to those who had a job. SAS version 9.4 was used for the analyses. All probability values for the statistical tests were 2-tailed, with p values < 0.05 considered statistically significant.
Results
Characteristics of the participants
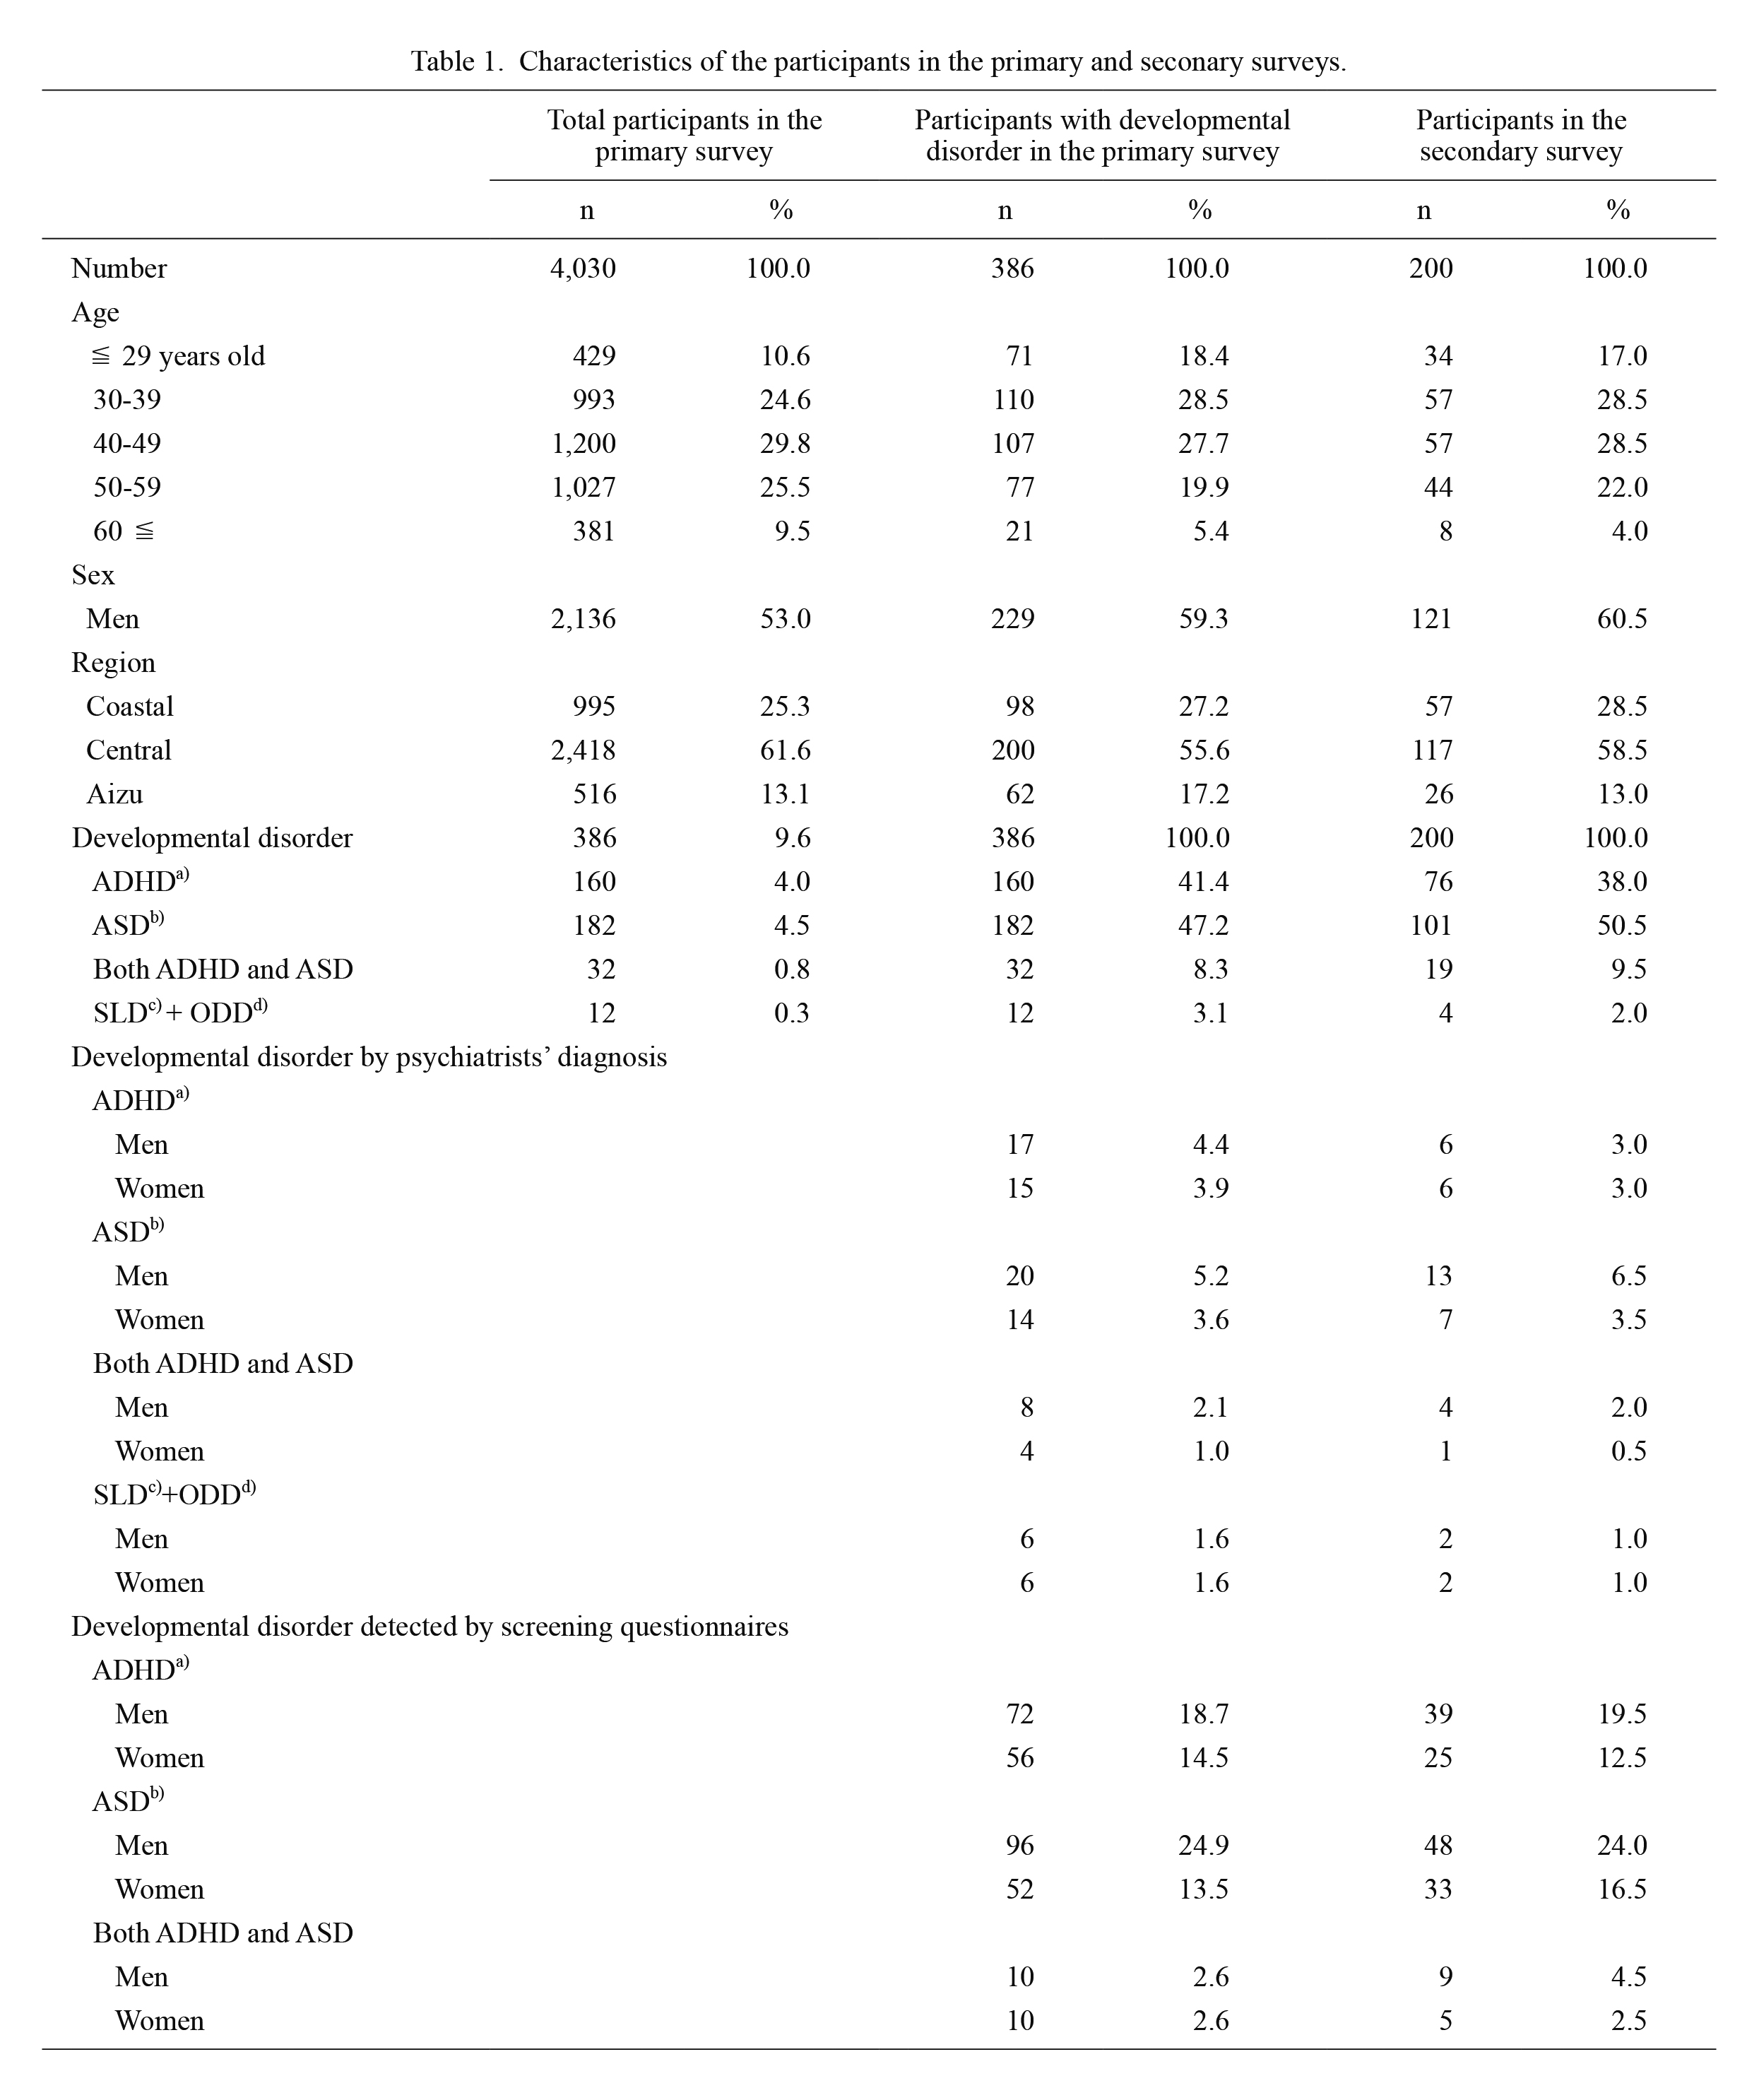
In the primary survey (Table 1), of the 4,030 participants aged 16-65 years, 386 (9.6%) were detected as having developmental disorders; 90 were diagnosed by a psychiatrist, and 296 were detected by a screening test. Of the 386 participants with developmental disorders, 160 had ADHD only (men, 89; women, 71), 182 had ASD only (men, 116; women, 66), 32 had both ADHD and ASD (men, 18; women, 14), and 12 had SLD/ODD (men, 6; women, 6). Of the 386 participants with developmental disorders, 200 men and women participated in the secondary survey. Comparison of the 386 participants with the 200 respondents revealed no differences between the two groups in terms of age structure, sex, region, or type of developmental disorders.
Medical history, psychological distress, and public support by job status
In the secondary survey, 200 participants aged 16-65 years (121 men and 79 women) with developmental disorders were analyzed for job-related factors. There were no significant regional differences in the proportions of the current workers (Coastal: 46%, Central: 53%, and Aizu: 46%). Table 2 shows the proportions of medical history, psychological distress, and usage of medical, employment and livelihood support based on job status. Of the 200 participants, 101 participants were employed and 99 were unemployed; among the unemployed participants, 21% (n = 21) were job seeking and 79% (n = 78) were not. The group of 101 current workers consisted of 15 public servants, 56 full-time employees, 9 self-employees, and 21 nonregular employees. Of the 200 participants, 78 (39%) participants had a medical history of a psychiatric disorder, 104 (52%) participants had psychological distress, 41 (21%) participants had a mental disability certificate and/or an independence support medical recipient ID, and 69 (35%) participants had a usage history of any one or more of the employment supports (Table 2). Proportions of the diagnosis of developmental disorders, history of psychiatric disorder, having mental disability certification/independence support medical recipient ID, and usage history of employment and livelihood support tended to be higher in the participants with job seeking; although, there was no statistical significance for proportion of psychological distress among the groups (Table 2). Proportions of the participants who lived with a marriage partner and their child or children tended to be lower in the participants with job seeking. Fig. 2 shows the proportions of the reasons for workers wanting to continue working in their current workspace among the 101 current workers. The major reasons were, “I can do the work by myself” and “In order to support own family” (Fig. 2).

Table 3 shows the proportions of mental status, job-related factors, family structure, usage of public support, and life satisfaction by developmental disorder in the secondary survey. The proportions of the participants with diagnosis of developmental disorders and usage of livelihood support tended to be higher in the group of SLD/ODD when compared with the other groups. The proportions of current workers for the groups of ADHD, ASD, and ADHD/ASD were 48.7%, 53.5%, and 52.6%, respectively, while that for the group of SLD/ODD was 0%. The proportions of those with psychological distress tended to be higher in the groups of ADHD/ASD (73.7%) and SLD/ODD (75.0%), compared with those in the group of ADHD (42.1%) and ASD (54.5%). For life satisfaction, there were no differences in life, job, and income among the groups. Furthermore, for family structure, there were no differences in living with partner, children, and parents among groups.

As shown in Table 4, compared with nonregular employees, the participants who worked in regular employment tended to feel more satisfied with life (multivariable-adjusted OR 4.47; 95% CI 1.35-14.84) and their job (OR 4.13; 95% CI 1.26-13.52). Among workers with a developmental disorders, to disclose the diagnosis in the workplace tended to be associated with higher levels of job satisfaction (OR 3.93; 95% CI 0.74-20.92). The participants who lived with a marriage partner tended to feel satisfied with life (OR 3.55; 95% CI 1.85-6.81), job (OR 3.20; 95% CI 1.30-7.85), and their income (OR 4.68; 95% CI 1.80-12.20). The participants who lived with their child or children also tended to feel satisfied with life (OR 3.22; 95% CI 1.74-5.99), job (OR 3.77; 95% CI 1.55-9.16), and income (OR 4.11; 95% CI 1.69-10.02); however, those who lived with parents tended to not feel satisfied with life (OR 0.58; 95% CI 0.31-1.09), job (OR 0.37; 95% CI 0.15-0.91), or income (OR 0.41; 95% CI 0.17-1.01). Having anxiety about continuing to work in the current workplace was inversely associated with satisfaction with life, job, and income, and was positively associated with psychological distress. The adjusted ORs (95% CI) of satisfaction with life, job, and income, and psychological distress for those having anxiety when compared with the workers without anxiety were 0.17 (0.05-0.57), 0.10 (0.03-0.34), 0.15 (0.05-0.46), and 3.84 (1.15-12.83), respectively. There were no associations between developmental disorders and satisfaction with life, job, and income. Furthermore, as a sensitivity analysis, a similar analysis was performed using only those classified as having developmental disorders by a psychiatrist’s diagnosis. The results of this analysis were essentially the same.

Discussion
The present study showed that the prevalence of ADHD, ASD, both ADHD and ASD, and SLD/ODD was 4.0%, 4.5%, 0.8%, and 0.3%, respectively, and that of total developmental disorders was 9.6% in the working population of Fukushima prefecture. Considering life satisfaction in relation to developmental disorders, there appear to be some factors that increase satisfaction: to work as a regular employee, understanding of their diagnosis in the workplace, and living with a spouse or child. Therefore, to help ensure better quality of life for individuals with developmental disorders, it is important to support their social life so they can work as a regular employee, to achieve an understanding of developmental disorders in the workplace, and to reduce their anxiety so they can continue working.
The prevalence of adults (18-44 years) with ADHD in the United States has been reported to be 4.4% (men 2.7%, women 1.7%) by interview-based research (Kessler et al. 2006), and in 10 countries of the Americas, Europe, and the Middle East was 3.4% (range, 1.2%-7.3%) by interview-based research (Fayyad et al. 2007). In the present study, the prevalence of ADHD with diagnosis was 1.1%; the prevalence was lower than that in previous reports (Kessler et al. 2006; Fayyad et al. 2007; Matte et al. 2015). However, when we added the results of the screening questionnaire, the prevalence of ADHD was within the range of previous reports, which included both clinically diagnosed and undiagnosed cases. On the other hand, the prevalence of ASD with diagnosis in the present study was 1.1%, similar to those reported in previous studies (Kawamura et al. 2008; Elsabbagh et al. 2012; Saito et al. 2020; Maenner et al. 2020), which was estimated from the sum of people diagnosed in the past: 1.8% among children in Toyota city (Kawamura et al. 2008), 3.2% among children in Hirosaki city (Saito et al. 2020), 1.9% among children in the United States (Maenner et al. 2020), and 0.62% (range 0.01-1.89) (Elsabbagh et al. 2012) worldwide. However, when we added the results of the screening questionnaire, the prevalence of ASD was 5.3%, higher than the range of previous reports. Because the prevalence of previous studies had calculated children who were diagnosed on clinical grounds, there could be many adults with suspected, but not diagnosed, ASD.
In the present study, no sex difference in the prevalence of ADHD was observed. A previous study had reported that there was no significant sex difference in the prevalence of adult ADHD (Moffitt et al. 2015). Therefore, our study is in line with the previous report. On the other hand, the prevalence of ASD was higher in men than in women in the present study, and the ratio of men versus women was 1.7: 1, whereas it had been 3: 1 in a previous report (Loomes et al. 2017). The number of participants who had never been diagnosed, but were suspected in the screening survey, was greater than that of diagnosed people with ASD in the present study, especially women. We speculate that, because some people with ASD tend to have no serious problems in their daily lives, many of them might not have had a chance to consult a psychiatrist and receive a diagnosis.
Regarding the satisfaction with life and/or their job, working as a regular employee was associated with greater satisfaction in the participants with developmental disorders. Furthermore, disclosing their developmental disorder diagnosis in the workplace tended to increase participants’ job satisfaction. We suggest that receiving a diagnosis and disclosing it in the workplace could lead to better understanding among co-workers. Furthermore, those living with a spouse or child had higher satisfaction with life, job, and income. Many regular employees might be financially independent; thus, they can afford to marry and have children. On the other hand, those living with their parents had lower satisfaction with life, job, and income. Many nonregular employees might not be financially independent and thus forced to live with their parents, which could lead to their low satisfaction.
In our study, although the participants with developmental disorders tended to live their life with poor mental health, only 20.5% of those used the certified welfare supports. In Japan, only those with the certificated welfare supports can use the official welfare supports and/or psychiatric rehabilitation except for employment support navigators (Hello Work Offices) and job training. However, it could be difficult to receive a diagnosis and apply to the certified welfare support system due to the mental burden and complicated procedure for application. Therefore, we speculate many of these individuals did not go to a psychiatric hospital and receive a diagnosis unless in serious trouble.
Considering associations between developmental disorders and psychiatric disorders, the present study is in line with the results of previous studies. It has been reported that adolescents with ADHD are likely to have a secondary psychiatric disorder: 18.6% for major depression, 19.4% for bipolar disorder, and 47.1% for any anxiety disorders (Kessler et al. 2006). On the other hand, a higher AQ-Short score (Hoekstra et al. 2011), which indicates tendency toward autistic traits, is associated with depression (Suzuki et al. 2020). Furthermore, the lifetime prevalence of psychiatric and psychosocial problems among adults with normal-intelligence ASD is reported to be 52% for mood disorders and 50% for anxiety disorders (Hofvander et al. 2009). As a result, they might not begin seeking employment even if they have a willingness to work. In other words, a secondary mental disorder could be one of the causes of the high proportion of unemployed people with developmental disorders. Therefore, it is important to prevent secondary psychiatric disorders in these individuals so that they continue working throughout their lives.
Our study has some potential limitations. First, the representativeness of the study participants is unknown because we conducted the survey via Internet. In the present study, however, the participants were recruited in broad age groups (from 16-65 years) and over a wide range throughout Fukushima prefecture. As a result, the proportions of the participants, those of the respondents to the questionnaire, and those with developmental disorders were similar to the proportions of the populations in the 3 regions in Fukushima prefecture. Furthermore, the prevalence of developmental disorders was within the range of previous reports (Wender et al. 2001; Kessler et al. 2006; Fayyad et al. 2007; Kawamura et al. 2008; Matte et al. 2015; Saito et al. 2020; Maenner et al. 2020). Second, use of questionnaires to detect suspected cases of developmental disorders in this study might have led to misclassification, although we used validated questionnaires. Third, it might be difficult to detect a person with SLD by screening questions via Internet because some have difficulty reading and writing. This difficulty could have led to selection bias; in the present study, the prevalence of SLD was lower than in a previous report (American Psychiatric Association 2013). Fourth, the participants in the present study consisted of only people who had a job or a willingness to work. Therefore, people who have no job or are unwilling to work were not counted. This difference could have led to an underestimation of the prevalence of developmental disorders. Fifth, the fact that no other similar studies have been conducted with this age group in Japan makes it difficult to compare these results from Fukushima prefecture with those from other areas in Japan. Because it is unclear whether the results of this study are specific to Fukushima prefecture, similar studies should be conducted in other regions. Finally, because we analyzed associations between psychosocial factors and life satisfaction among those with developmental disorders, it is unknown whether these associations were observed particularly among individuals with developmental disorders.
We concluded that the prevalence of developmental disorders was estimated at 9.6% among men and women aged 16-65 years who have a job or willingness to work in Fukushima prefecture. Among those with developmental disorders, working as a regular employee, an understanding of developmental disorders among co-workers, and living with a spouse or child could be associated with increased life satisfaction. Further study in another setting is needed to elucidate the prevalence in adults and the psychosocial factors associated with life satisfaction among individuals with developmental disorders.
Acknowledgments
The present study was financially supported by Fukushima-ken Industrial Health Center foundation and Gushinkai foundation. Furthermore, we received variable advice about the survey from Employment and Life Support Centers for People with Disabilities in Fukushima prefecture.
Conflict of Interest
The authors declare no conflict of interest.
References
-
American Psychiatric Association
(2013) Diagnostic and statistical manual of mental disorders, 5th ed., American Psychiatric Publishing, Arlington, Washington, DC, USA.
-
Biederman,
J. &
Spencer,
T.
(1999) Attention-deficit/hyperactivity disorder (ADHD) as a noradrenergic disorder. Biol. Psychiatry, 46, 1234-1242.
-
Bourgeron,
T.
(2015) From the genetic architecture to synaptic plasticity in autism spectrum disorder. Nat. Rev. Neurosci., 16, 551-563.
-
Castellanos,
F.X.,
Lee,
P.P.,
Sharp,
W.,
Jeffries,
N.O.,
Greenstein,
D.K.,
Clasen,
L.S.,
Blumenthal,
J.D.,
James,
R.S.,
Ebens,
C.L.,
Walter,
J.M.,
Zijdenbos,
A.,
Evans,
A.C.,
Giedd,
J.N. &
Rapoport,
J.L.
(2002) Developmental trajectories of brain volume abnormalities in children and adolescents with attention-deficit/hyperactivity disorder. JAMA, 288, 1740-1748.
-
Cheng,
J.Y.,
Chen,
R.Y.,
Ko,
J.S. &
Ng,
E.M.
(2007) Efficacy and safety of atomoxetine for attention-deficit/hyperactivity disorder in children and adolescents-meta-analysis and meta-regression analysis. Psychopharmacology (Berl.), 194, 197-209.
-
de la Torre-Ubieta,
L.,
Won,
H.,
Stein,
J.L. &
Geschwind,
D.H.
(2016) Advancing the understanding of autism disease mechanisms through genetics. Nat. Med., 22, 345-361.
-
Elsabbagh,
M.,
Divan,
G.,
Koh,
Y.J.,
Kim,
Y.S.,
Kauchali,
S.,
Marcín,,
C.,
Montiel-Nava,
C.,
Patel,
V.,
Paula,
C.S.,
Wang,
C.,
Yasamy,
M.T. &
Fombonne,
E.
(2012) Global prevalence of autism and other pervasive developmental disorders. Autism Res., 5, 160-179.
-
Fayyad,
J.,
De Graaf,
R.,
Kessler,
R.,
Alonso,
J.,
Angermeyer,
M.,
Demyttenaere,
K.,
De Girolamo,
G.,
Haro,
J.M.,
Karam,
E.G.,
Lara,
C.,
Lépine,
J.P.,
Ormel,
J.,
Posada-Villa,
J.,
Zaslavsky,
A.M. &
Jin,
R.
(2007) Cross-national prevalence and correlates of adult attention-deficit hyperactivity disorder. Br. J. Psychiatry, 190, 402-409.
-
Goldman,
L.S.,
Genel,
M.,
Bezman,
R.J. &
Slanetz,
P.J.
(1998) Diagnosis and treatment of attention-deficit/hyperactivity disorder in children and adolescents. Council on Scientific Affairs, American Medical Association. JAMA, 279, 1100-1107.
-
Hoekstra,
R.A.,
Vinkhuyzen,
A.A.,
Wheelwright,
S.,
Bartels,
M.,
Boomsma,
D.I.,
Baron-Cohen,
S.,
Posthuma,
D. &
van der Sluis,
S.
(2011) The construction and validation of an abridged version of the autism-spectrum quotient (AQ-Short). J. Autism Dev. Disord., 41, 589-596.
-
Hofvander,
B.,
Delorme,
R.,
Chaste,
P.,
Nydén,
A.,
Wentz,
E.,
Ståhlberg,
O.,
Herbrecht,
E.,
Stopin,
A.,
Anckarsäter,
H.,
Gillberg,
C.,
Råstam,
M. &
Leboyer,
M.
(2009) Psychiatric and psychosocial problems in adults with normal-intelligence autism spectrum disorders. BMC Psychiatry, 9, 35.
-
Iossifov,
I.,
O’Roak,
B.J.,
Sanders,
S.J.,
Ronemus,
M.,
Krumm,
N.,
Levy,
D.,
Stessman,
H.A.,
Witherspoon,
K.T.,
Vives,
L.,
Patterson,
K.E.,
Smith,
J.D.,
Paeper,
B.,
Nickerson,
D.A.,
Dea,
J.,
Dong,
S., et al.
(2014) The contribution of de novo coding mutations to autism spectrum disorder. Nature, 515, 216-221.
-
Japan Organization for Employment of the Elderly, Persons with Disabilities and Job Seekers (JEED)
(2011) Employment services for persons with disabilities. http://www.jeed.go.jp/english/disability/index.html [Accessed: June 28 2020].
-
Kawamura,
Y.,
Takahashi,
O. &
Ishii,
T.
(2008) Reevaluating the incidence of pervasive developmental disorders: impact of elevated rates of detection through implementation of an integrated system of screening in Toyota, Japan. Psychiatry Clin. Neurosci., 62, 152-159.
-
Kessler,
R.C.,
Adler,
L.,
Barkley,
R.,
Biederman,
J.,
Conners,
C.K.,
Demler,
O.,
Faraone,
S.V.,
Greenhill,
L.L.,
Howes,
M.J.,
Secnik,
K.,
Spencer,
T.,
Ustun,
T.B.,
Walters,
E.E. &
Zaslavsky,
A.M.
(2006) The prevalence and correlates of adult ADHD in the United States: results from the National Comorbidity Survey Replication. Am. J. Psychiatry, 163, 716-723.
-
Kessler,
R.C.,
Andrews,
G.,
Colpe,
L.J.,
Hiripi,
E.,
Mroczek,
D.K.,
Normand,
S.L.,
Walters,
E.E. &
Zaslavsky,
A.M.
(2002) Short screening scales to monitor population prevalences and trends in non-specific psychological distress. Psychol. Med., 32, 959-976.
-
Kirchner,
J. C. &
Dziobek,
I.
(2014) Toward the successful employment of adults with autism: a first analysis of special interests and factors deemed important for vocational performance. Scand. J. Child Adolesc. Psychiatr. Psychol., 2, 77-85.
-
Kose,
L.K.,
Fox,
L. &
Storch,
E.A.
(2018) Effectiveness of cognitive behavioral therapy for individuals with autism spectrum disorders and comorbid obsessive-compulsive disorder: a review of the research. J. Dev. Phys. Disabil., 30, 69-87.
-
Kuriyan,
A.B.,
Pelham,
W.E. Jr.,
Molina,
B.S.,
Waschbusch,
D.A.,
Gnagy,
E.M.,
Sibley,
M.H.,
Babinski,
D.E.,
Walther,
C.,
Cheong,
J.,
Yu,
J. &
Kent,
K.M.
(2013) Young adult educational and vocational outcomes of children diagnosed with ADHD. J. Abnorm. Child Psychol., 41, 27-41.
-
Loomes,
R.,
Hull,
L. &
Mandy,
W.P.L.
(2017) What is the male-to-female ratio in autism spectrum disorder? A systematic review and meta-analysis. J. Am. Acad. Child Adolesc. Psychiatry, 56, 466-474.
-
Maenner,
M.J.,
Shaw,
K.A.,
Baio,
J.,
EdS,
Washington, A.,
Patrick,
M.,
DiRienzo,
M.,
Christensen,
D.L.,
Wiggins,
L.D.,
Pettygrove,
S.,
Andrews,
J.G.,
Lopez,
M.,
Hudson,
A.,
Baroud,
T.,
Schwenk,
Y., et al.
(2020) Prevalence of autism spectrum disorder among children aged 8 years: autism and developmental disabilities monitoring network, 11 sites, United States, 2016. MMWR Surveill. Summ., 69, 1-12.
-
Matte,
B.,
Anselmi,
L.,
Salum,
G.A.,
Kieling,
C.,
Goncalves,
H.,
Menezes,
A.,
Grevet,
E.H. &
Rohde,
L.A.
(2015) ADHD in DSM-5: a field trial in a large, representative sample of 18- to 19-year-old adults. Psychol. Med., 45, 361-373.
-
Moffitt,
T.E.,
Houts,
R.,
Asherson,
P.,
Belsky,
D.W.,
Corcoran,
D.L.,
Hammerle,
M.,
Harrington,
H.,
Hogan,
S.,
Meier,
M.H.,
Polanczyk,
G.V.,
Poulton,
R.,
Ramrakha,
S.,
Sugden,
K.,
Williams,
B.,
Rohde,
L.A., et al.
(2015) Is adult ADHD a childhood-onset neurodevelopmental disorder? Evidence from a four-decade longitudinal cohort study. Am. J. Psychiatry, 172, 967-977.
-
Newcorn,
J.H.,
Spencer,
T.J.,
Biederman,
J.,
Milton,
D.R. &
Michelson,
D.
(2005) Atomoxetine treatment in children and adolescents with attention-deficit/hyperactivity disorder and comorbid oppositional defiant disorder. J. Am. Acad. Child Adolesc. Psychiatry, 44, 240-248.
-
Safer,
D.J.,
Zito,
J.M. &
DosReis,
S.
(2003) Concomitant psychotropic medication for youths. Am. J. Psychiatry, 160, 438-449.
-
Saito,
M.,
Hirota,
T.,
Sakamoto,
Y.,
Adachi,
M.,
Takahashi,
M.,
Osato-Kaneda,
A.,
Kim,
Y.S.,
Leventhal,
B.,
Shui,
A.,
Kato,
S. &
Nakamura,
K.
(2020) Prevalence and cumulative incidence of autism spectrum disorders and the patterns of co-occurring neurodevelopmental disorders in a total population sample of 5-year-old children. Mol. Autism, 11, 35.
-
Sallee,
F.R.,
Lyne,
A.,
Wigal,
T. &
McGough,
J.J.
(2009) Long-term safety and efficacy of guanfacine extended release in children and adolescents with attention-deficit/hyperactivity disorder. J. Child Adolesc. Psychopharmacol., 19, 215-226.
-
Scheres,
A.,
Milham,
M.P.,
Knutson,
B. &
Castellanos,
F.X.
(2007) Ventral striatal hyporesponsiveness during reward anticipation in attention-deficit/hyperactivity disorder. Biol. Psychiatry, 61, 720-724.
-
Shaw,
P.,
Eckstrand,
K.,
Sharp,
W.,
Blumenthal,
J.,
Lerch,
J.P.,
Greenstein,
D.,
Clasen,
L.,
Evans,
A.,
Giedd,
J. &
Rapoport,
J.L.
(2007) Attention-deficit/hyperactivity disorder is characterized by a delay in cortical maturation. Proc. Natl. Acad. Sci. USA, 104, 19649-19654.
-
Sonuga-Barke,
E.,
Bitsakou,
P. &
Thompson,
M.
(2010) Beyond the dual pathway model: evidence for the dissociation of timing, inhibitory, and delay-related impairments in attention-deficit/hyperactivity disorder. J. Am. Acad. Child Adolesc. Psychiatry, 49, 345-355.
-
Suzuki,
T.,
Miyaki,
K. &
Tsutsumi,
A.
(2020) Which autistic traits are related to depressive symptoms in Japanese workers? Ind. Health, 58, 414-422.
-
Ustun,
B.,
Adler,
L.A.,
Rudin,
C.,
Faraone,
S.V.,
Spencer,
T.J.,
Berglund,
P.,
Gruber,
M.J. &
Kessler,
R.C.
(2017) The World Health Organization Adult Attention-Deficit/Hyperactivity Disorder Self-Report Screening Scale for DSM-5. JAMA Psychiatry, 74, 520-527.
-
Vorstman,
J.A.S.,
Parr,
J.R.,
Moreno-De-Luca,
D.,
Anney,
R.J.L.,
Nurnberger,
J.I. Jr. &
Hallmayer,
J.F.
(2017) Autism genetics: opportunities and challenges for clinical translation. Nat. Rev. Genet., 18, 362-376.
-
Wakabayashi,
A.,
Tojo,
Y.,
Baron-Cohen,
S. &
Wheelwright,
S.
(2004) The Autism-Spectrum Quotient (AQ) Japanese version: evidence from high-functioning clinical group and normal adults. Shinrigaku Kenkyu, 75, 78-84 (in Japanese).
-
Wang,
B.Q.,
Yao,
N.Q.,
Zhou,
X.,
Liu,
J. &
Lv,
Z.T.
(2017) The association between attention deficit/hyperactivity disorder and internet addiction: a systematic review and meta-analysis. BMC Psychiatry, 17, 260.
-
Watanabe,
T.,
Rees,
G. &
Masuda,
N.
(2019) Atypical intrinsic neural timescale in autism. Elife, 8, e42256.
-
Wender,
P.H.,
Wolf,
L.E. &
Wasserstein,
J.
(2001) Adults with ADHD. An overview. Ann. NY Acad. Sci., 931, 1-16.