Abstract
Coronavirus disease 2019 (COVID-19), caused by severe acute respiratory syndrome coronavirus 2 (SARS-CoV-2), is the world’s largest public health concern in 2021. This study evaluated the associations of the prevalence of airway symptoms among the tested individuals and data regarding the natural environmental factors with the weekly number of newly diagnosed COVID-19 patients in Sendai City (Nt). For the derivatives of the screening test results, data from individuals with a contact history who underwent nasopharyngeal swab reverse transcription-polymerase chain reaction (RT-PCR) testing between July 2020 and April 2021 (6,156 participants, including 550 test-positive patients) were used. The value of Nt correlated with the weekly RT-PCR test-positive rate after close contact, prevalence of cough symptoms in test-positive individuals or in test-negative individuals, lower air temperature, lower air humidity, and higher wind speed. The weekly test-positive rate correlated with lower air humidity and higher wind speed. In cross-correlation analyses, natural environmental factors correlated with the regional epidemic status on a scale of months, whereas the airway symptoms among non-COVID-19 population affected on a scale of weeks. When applying an autoregression model to the serial data of Nt, large-scale movements of people were suggested to be another factor to influence the local epidemics on a scale of days. In conclusion, the prevalence of cough symptoms in the local population, lower air humidity or higher wind speed, and large-scale movements of people in the locality would jointly influence the local epidemic status of COVID-19.
Introduction
The coronavirus disease 2019 (COVID-19) pandemic, which is caused by severe acute respiratory syndrome coronavirus 2 (SARS-CoV-2), is the world’s largest public health concern in 2021 (Rehman et al. 2021; Reid et al. 2021). The disease has infected more than 100 million people worldwide, with more than 3 million deaths by April 2021. Since the advent of the pandemic, variants of the virus (e.g., D614G mutation, SARS-CoV-2 VOC 202012/01, H69-V70 deletion in the spike gene) have emerged intermittently (Galloway et al. 2021; Kemp et al. 2021; Korber et al. 2020; Wise 2020). Thus, the resolution of the pandemic is hard to foresee.
As droplet infection is the primary mode of transmission, avoiding unprotected close contact with COVID-19 infected patients is highly important to prevent infection (Furuse et al. 2020; Siordia 2020). Close contact with patients is an established significant risk factor that warrants a screening test for COVID-19, and the people with close contact are recommended to isolate to prevent further spread (Ferretti et al. 2020). Since COVID-19 infection is mainly transmitted through droplets, possible effects of seasonal factors like air temperature and humidity on the transmissibility of COVID-19 have been expected (Mecenas et al. 2020; Ward et al. 2020), as observed in influenza virus infections (Mecenas et al. 2020; Sajadi et al. 2020). Theoretically, the basic reproduction number (R0) for the infection, which is a dimensionless number that is defined as the average number of secondary cases in a totally susceptible population, can be described as

where c is the rate of contact between susceptible individuals and infected patients, p is the transmissibility (i.e., probability of transmission) of an infectious disease, and D is the mean infectious period (i.e., duration of infectivity) (Guerra et al. 2017). The transmissibility (p) is comprised of multiple factors, and can change chronologically by the local natural environmental factors, contact factors, and behavioral patterns in terms of infection control measures. Consequently, R0 is also not a constant value for each infection (Park et al. 2020), and can change chronologically depending on the local environmental and demographic factors. If the offspring distribution follows a negative binominal distribution with dispersion parameter k, the probability of extinction (π) of an infection in a population is described with R0 as below (Nishiura et al. 2012):

Thus, transmissibility in a specific locality at a specific time period is important to estimate the subsequent regional epidemic status. However, whether the SARS-CoV-2 transmission rate after close contact with COVID-19 patients actually correlates with lower atmospheric temperature and humidity levels has not been fully confirmed yet. Besides, the possible impact of other natural environmental factors, such as hours of sunlight and wind speed, or the prevalence of airway symptoms among local populations on the regional epidemic status has not yet been widely evaluated and is yet to be fully elucidated.
This study evaluated the associations of the aforementioned natural environmental factors or the prevalence of cough symptoms in the locality with the regional epidemic status of COVID-19. Chronological changes in the weekly number of patients newly diagnosed with COVID-19 in Sendai City were assessed together with other data derived from reverse transcription-polymerase chain reaction (RT-PCR) test results and data on natural environmental factors. We then checked for correlations between the local epidemic status (the weekly number of newly diagnosed patients in the locality) and natural environmental factors or the local prevalence of airway symptoms.
Methods
Study design
Data on the weekly total number of patients newly diagnosed with COVID-19 in Sendai City, which was used as a main outcome in this study, were released by the local government (Sendai City; https://www.city.sendai.jp/). The individuals enrolled in this study, from which RT-PCR test results-derived data were obtained, were those with contact (close/lower-risk) with COVID-19 patients and who were tested for the presence of the SARS-CoV-2 viral nucleocapsid gene (N2-region of the N-gene) by nasopharyngeal swab tests at our screening test center between July 2020 and April 2021. This single testing center diagnosed more than 10% of all patients with COVID-19 in Sendai City, Japan, during the study period. Throughout the study period, the local prevalence of the new variant strains of the virus was negligibly low, and most of the participants were not vaccinated against COVID-19. Thus, the participants of this study can be regarded as an almost totally susceptible population. Data regarding age and sex were collected from all the enrolled individuals. The contact history was assessed and confirmed by a local government staff at registration for the screening test for all participants. The weekly SARS-CoV-2 test positivity rate after close or lower-risk contact was calculated for each week with 5 or more tested individuals. The 95% confidence intervals (CI) for the weekly test positivity rates were obtained from weeks with > 10 tested individuals. The 95% CI of the weekly test positivity rates were not obtained from weeks with 10 or less tested individuals, because the range of 95% CI becomes much larger in weeks with 10 or fewer individuals and may bias the analyses. The prevalence of cough symptoms among the RT-PCR test-positive individuals and among the RT-PCR test-negative individuals were calculated for each week with 5 or more tested individuals. The 95% CI of the cough prevalence was achieved only from the week with > 10 individuals in each subgroup because of the same reason as described above. Test-negative individuals who were tested based on recent contact history were considered to represent the local non-COVID-19 population. Based on this premise, the estimated prevalence of cough symptoms among the local population was approximated by that among RT-PCR test-negative individuals who were tested based on recent contact history. Data regarding lower-risk contact history were collected from September 2020, and data regarding the place of contact (household/outside the residences) were collected from November 2020. Consequently, data regarding the place of contact was available from 24 of the 41 weeks of study period. From these 24 weeks, both the test-positive rates after close contact based on > 10 tested individuals in those with household and with non-household contact were available from 19 weeks.
In addition to the weekly test positivity rate by the contact level and cough prevalence in the healthy local population, weekly averages of air temperature (daily average, °C), air humidity (daily average and daily minimum, %), air volumetric humidity (g/m3), hours of sunlight (hours/day), and wind speed (daily average, m/s) of the same area as the testing center (Sendai City) in the same week were also collected. Data on the natural environmental factors in the locality were acquired from the Japan Meteorological Agency (http://www.jma.go.jp/jma). The absolute volumetric humidity (pw) [g/m3] was calculated from the air temperature (t) in degrees Celsius (℃) and the relative humidity (φ) [%] using the following approximate formulas:

A history of close contact was established based on the fulfilment of all of the following four criteria: (1) contact with a COVID-19 patient between 2 days before and 14 days after the onset of symptoms, (2) not wearing of masks, (3) contact involving < 1 m distance, and (4) ≥ 15 min of contact. If the contacted patients were asymptomatic, contact from 2 days before the test with positive result was used as the criterion. Lower-risk contact was defined as contact with COVID-19 patients in the same facility, but did not fulfill the above-described criteria for close contact.
Positivity for the N2 gene was confirmed by RT-PCR using the primers and the probe developed by the National Institute of Infectious Disease, Japan (NIID_2019-nCOV_N_F2, R2, and P2) (Shirato et al. 2020). The RT-PCR method was described in detail in our previous report (Ishii et al. 2021). It has been known that the transmissibility of COVID-19 infection is different between symptomatic and asymptomatic COVID-19 patients (Chen et al. 2020; He et al. 2020; Qiu et al. 2021). The data regarding the presence of symptoms in the contacted COVID-19 patients were not collected in this study.
Statistics
The distributions of the quantitative variables were described using the median and interquartile range (IQR; 25-75 percentiles). Comparisons of the distributions of the two variables were performed using the Mann−Whitney U test. Correlations between the weekly SARS-CoV-2 test positivity rate after close contact and the weekly average of seasonal natural factors (air temperature, humidity, hours of sunlight, and wind speed) in the same week were then evaluated. The level of correlation coefficients was evaluated using Spearman’s correlation coefficient (rho, ρ). The statistical significance of rho was evaluated using the test of no correlation. In an attempt to perform a time series analysis, the values of cross-correlation between the factors of natural environment or local population and the weekly number of patients newly diagnosed with COVID-19 in Sendai City with a different time lags (X weeks) were calculated for different values of X (from −9 to +9) using the following equations:

Where:
T is the number for observed weeks since July 12th, 2020,
Time lag X ={Z| −9 ≤ Z ≤ +9},
Ft is the weekly data of each environmental factor (F) per week (t),
Nt is the number (N) of newly diagnosed COVID-19 patients in Sendai City in week of t,
R(Ft) and R(Nt) are the ranks of data in the week of t, and
R(F) and R(N) are the mean ranks
As Nt is significantly influenced by the numbers of patient in the preceding several days to weeks, time series analyses for the serial data of Nt were further performed. Under the stationarity assumption, the stationary auto-regression (AR) model with the order of p, described as AR(p) model (i.e., an AR process that depend on p past observations), can be described as below:

where Ø is the sample auto-regression coefficient for the subsequent number with each lag, and εt is the residual of the fitted p-order autoregression model. The order of the best fitted autoregression model was determined by using the Akaike’s Information Criterion (AIC). The transition of εt was visually evaluated by drawing a line graph. The presence of autocorrelation in each variable was tested by the Ljung-Box test. Statistical significance was set at P < 0.05. Statistical analyses were performed using IBM SPSS Statistics (version 22.0; IBM Corp., Armonk, NY, USA) and R Statistical Software (version 4.0.5; R Foundation, Vienna, Austria) for time series analyses.
Ethics
This study was approved by the Institutional Review Board of Tohoku University Graduate School of Medicine (approval number: 2020-1-535). All procedures in this study were performed in accordance with the principles of the current version of the Declaration of Helsinki, as revised in 2013. The Institutional Review Board waived the need for written informed consent to avoid the risk of spreading the infection and also due to the urgent need to collect necessary information about the infection of global concern. Informed consent was obtained in an opt-out manner.
Results
Participants
A flow diagram for the enrollment of study participants is shown in Fig. 1. Altogether, 6,156 consecutive participants (3,226 men [52.4%] and 2,930 women [47.6%]) with a contact history with COVID-19 patients, who underwent testing at our testing center, were enrolled in this study. Among them, 3,176 (51.6%) had a history of close contact and the remaining 2,980 (48.4%) had a lower-risk contact with COVID-19 patients. The median and IQR of the age in the enrolled participants was 22 (9-44) years. Of these enrolled participants, 550 (8.9%) were confirmed to be SARS-CoV-2 test-positive. In detail, 420 (13.2%) of the 3,176 individuals with close contact were RT-PCR test-positive, and 130 (4.4%) of the 2,980 individuals with lower-risk contact were RT-PCR test-positive. The median and IQR of the weekly rate of tested individuals with a close contact history among whole participants with a contact history (close or lower-risk) was 53.0% (42.6-64.8%).

The weekly SARS-CoV-2 test positivity rate after close contact with COVID-19 patients based on > 10 tested individuals was available from 38 of 41 weeks during the study period, whereas the same after lower-risk contact was available from 28 of 41 weeks. In the former group with close contact history, the median and IQR of the weekly test positivity rate was 9.0% (5.5-14.7%). For those in the latter group with lower-risk contact history, the median and IQR of the weekly test positivity rate was 4.1% (0.0-6.5%).
Correlations between the total COVID-19 patients in Sendai City and the evaluated variables
The chronological change in the daily number of newly diagnosed COVID-19 patients in Sendai City during the study period is shown in Fig. 2A. In addition to the irregular occurrence of cluster outbreaks, there were several large waves of local epidemics with a week-to-month scale. The chronological change in the weekly RT-PCR test-positive rate among the individuals tested at the drive-through center with a recent contact history with COVID-19 patients is shown in Fig. 2B. The chronological change in the weekly prevalence of cough symptoms among individuals who tested positive or negative for SARS-CoV-2 on RT-PCR after contact history with COVID-19 patients is shown in Fig. 2C. The prevalence of cough symptoms among the individuals tested negative on RT-PCR was regarded to approximately represents the cough prevalence in the locality among the whole local population. The chronological change in the weekly atmospheric humidity levels (daily average and minimum of relative humidity, calculated absolute volumetric humidity) is shown in Fig. 2D. Rather than changes in atmospheric humidity levels, changes in the prevalence of cough symptoms among local healthy control populations (represented by RT-PCR test-negative cases with a contact history) showed a more synchronized pattern with changes in the number of newly diagnosed COVID-19 patients in Sendai City.

To screen the possible background factors of the fluctuation in the number of local COVID-19 patients, Spearman’s correlation coefficients (rho) between the weekly number of newly diagnosed COVID-19 patients in Sendai City and other evaluated variables derived from the RT-PCR test results or the natural environmental factors in the same concurrent week were calculated (Table 1). A moderate to strong positive correlation with the number of COVID-19 patients in the locality was confirmed in the weekly RT-PCR test-positive rate (i.e., a possible marker of transmissibility) among individuals with close contact history (rho = +0.574, p < 0.0001) or among individuals with lower-risk contact history (rho = +0.438, p = 0.0199). Scatter plots for these pairs of variables are shown in Fig. 3A and Fig. 3B. Furthermore, a moderate to strong positive correlation with the number of COVID-19 patients in Sendai City was confirmed in the weekly prevalence of cough symptoms among individuals with positive RT-PCR test results (rho = +0.548, p = 0.0004) or with negative RT-PCR test results (rho = +0.475, p = 0.0017). Scatter plots for these pairs of variables are shown in Fig. 3C and Fig. 3D. For reference, the weekly prevalence of cough symptoms was significantly higher among those with RT-PCR test-positive results than among those with RT-PCR test-negative results (median: 22.7% vs. 8.1%, Mann-Whitney U test, p < 0.0001). There was no significant correlation between the weekly prevalence of cough symptoms in RT-PCR test-positive individuals and RT-PCR test-negative individuals (rho = +0.127, p = 0.4529).
Regarding the natural environmental factors, a lower air temperature (rho = −0.644, p < 0.0001), lower air relative humidity (rho = −0.656, p < 0.0001), lower air absolute volumetric humidity (rho = −0.653, p < 0.0001), and higher wind speed (rho = +0.404, p = 0.0088) were significantly correlated with the number of newly diagnosed COVID-19 patients in the same week in Sendai City.
Correlations between COVID-19 transmissibility and natural environmental factors
Based on the finding that the weekly RT-PCR test-positive rate among individuals with close contact history and some natural environmental factors showing moderate to strong positive correlations with the weekly number of newly diagnosed COVID-19 patients, the correlations between the weekly test-positive rate after close contact and the evaluated natural environmental factors are shown in Fig. 4. Both a lower atmospheric relative humidity (rho = −0.444, p = 0.0037) and a higher wind speed showed significant moderate correlations with COVID-19 transmissibility after close contact. Meanwhile, the correlations in a lower absolute volumetric humidity (rho = −0.335, p = 0.0320) and a lower air temperature (rho = −0.261, p = 0.0993) were only weak or non-significant.
Because the prevalence of cough symptoms, especially in the COVID-19 population, were suggested to significantly influence COVID-19 transmissibility, further analyses to check for the correlations between the cough prevalence in RT-PCR test-positive participants and the evaluated natural environmental factors were performed. The calculated Spearman’s rho was −0.5430 (p = 0.0005) for the daily average of air relative humidity in the same week, −0.502 (p = 0.0016) for the daily average of absolute volumetric humidity, −0.407 (p = 0.0125) for the daily average of air temperature, and +0.296 (p = 0.0755) for the daily average of wind speed. These findings showed that the local COVID-19 epidemics, airway symptoms in the local population, and seasonal environmental factors (lower atmospheric temperature and humidity) closely correlate with each other.
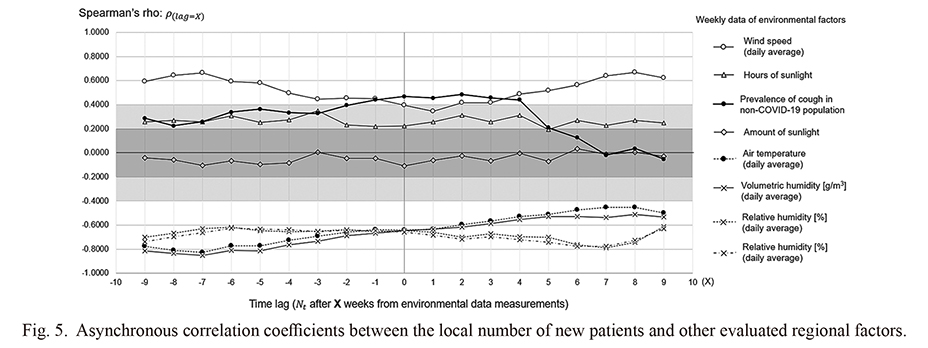
Asynchronous correlations between the local epidemics and environmental factors
To evaluate the time dependency and the existence of a time lag in the association between the regional epidemic status and local environmental or epidemiological factors using a cross-correlation method, Spearman’s rho between each evaluated variable and the weekly number of patients newly diagnosed with COVID-19 with a time lag of up to ± 9 weeks were comprehensively calculated and shown as a line graph in Fig. 5. None of the evaluated natural environmental factors showed apparent time dependency in the short to medium term with the local epidemic situation; the rho values were almost constant or showed only with a gradual change throughout the assessment period. Meanwhile, the calculated rho for the prevalence of cough symptoms among the whole local population, as estimated based on the prevalence among test-negative individuals with a contact history, showed a sharp decrement when for a time lag of ≥ 5 weeks. These results imply that natural environmental factors influenced the local epidemic status on a scale of months, whereas the local prevalence of cough symptoms among the local population may affected the epidemic status on a scale of days to weeks.
Lastly, to search for further factors that may influence the local epidemics with shorter time scales, we evaluated the autoregression in the weekly number of newly diagnosed COVID-19 patients in Sendai City (Nt). The correlogram and partial correlogram for serial data of the weekly numbers of newly diagnosed COVID-19 patients in Sendai are shown in Fig. 6A. The presence of autoregression process in Nt was confirmed (Ljung-Box test, p < 0.0001). The partial autocorrelation coefficients revealed that the best fitted AR model would be with second-order, which was reconfirmed by using the AIC. The fitted AR(2) model derived the following equation:
Nt = 24.30 + 1.428 ∙ Nt-1 − 0.631 ∙ Nt-2 + εt
The transition of εt during the study period is shown in Fig. 6B. There are three apparent positive peaks (i.e., the number of Nt is larger than that purely predicted from Nt-1 and Nt-2). The first peak matched to the timing of the occurrence of the largest cluster outbreak in Sendai, occurred at a local festival with shared foods. The second peak took place just after the New Year holidays with a nationwide movement of the people. The origin of the third peak was uncertain, but the peak swiftly disappeared after the “Go To Eat” Campaign that intended to boost the eating-out industry in the locality was suspended. The absence of autoregression process in εt was statistically confirmed (Ljung-Box test, p = 0.8030). These findings demonstrated that, in addition to an elevated COVID-19 transmissibility based on potential risks including the environmental factors evaluated in the present study, large-scale movements of people also significantly influence the local COVID-19 epidemics.
Discussion
In this study, significant correlations with possible concurrency were confirmed between the number of newly diagnosed COVID-19 patients in the locality, a higher SARS-CoV-2 transmission rate after contact with patients, a higher prevalence of cough symptoms in the local population, and some natural environmental factors (lower atmospheric humidity, higher wind speed). Several studies have suggested that atmospheric temperature and humidity may affect the spread of COVID-19 infection (Mecenas et al. 2020; Ward et al. 2020). Although the presence of correlation does not always indicate a causal relationship between the variables, the results of this study further supported the theory that a lower atmospheric temperature and humidity may play roles in the transmission of COVID-19 infection. This could be explained by the widely accepted route of SARS-CoV-2 transmission via droplet infection, rather than via fomite infection through high-touch surfaces (Goldman 2020). It is known that the time of stay in the air and the range of spread for particles containing infectious pathogens are significantly suppressed by the increased atmospheric humidity level (Noti et al. 2013). These facts imply the potential importance of maintaining a moderate level of atmospheric humidity during the winter season to suppress the spread of COVID-19 infection. Further research is warranted to study the levels of atmospheric humidity and SARS-CoV-2 transmission rate after contact with COVID-19 patients in the same time period and medical area (i.e., with homogeneous proportion of coronavirus variants with different transmission rates) to verify the suggested role of environmental factors in the spread of the infection. In addition, this study showed a significant positive correlation between wind speed and SARS-CoV-2 transmissibility, which has not been reported or proposed to date. Whether this correlation is based on a causal relationship between these two factors is unknown; however, this finding may imply a possible theory that a facilitated air convection by a higher wind speed may increase the range of spread of particles containing infectious pathogens in the air. However, because there was a significant negative correlation between the weekly air humidity and wind velocity (rho = −0.655, p < 0.0001), this apparent correlation between the wind speed and SARS-CoV-2 transmissibility might be a product of the confounding effect of the air humidity level as a covariance. Further validation is needed to determine the possible association between COVID-19 transmissibility and the daily wind speed in the locality.
Another notable finding of this study was that the prevalence of cough symptoms among the local non-COVID-19 population (presumptively represented by RT-PCR test-negative individuals after contact with COVID-19 infected patients) showed a significant positive correlation with the weekly number of newly diagnosed COVID-19 patients in the same locality. Because these two populations with different test positivity results are mutually exclusive populations without overlap, this finding implies that a possible association may exist between the prevalence of upper respiratory symptoms in the whole local population and COVID-19 transmissibility in the same locality. One of the possibilities may be that the manifestation of coughing related to the COVID-19 infection after the incubation period was accelerated by some unidentified local factors (e.g., environmental factors, coexisting common diseases). Another possibility may be that the COVID-19 transmissibility during the incubation period was elevated by such local conditions. Conceivable situations that may affect the local prevalence of cough symptoms include the turn of seasons with rapid changes in atmospheric temperature and humidity levels, spread of common cold in the winter seasons, season of hay fever, and seasons with asthma exacerbation (D’Amato et al. 2018; Passali et al. 2018; Satia et al. 2016; Teach et al. 2015). The results of this study also showed significant correlations between the prevalence of cough symptoms in RT-PCR test-positive COVID-19 patients and the air temperature (rho = −0.407, p = 0.0125) or humidity (rho = −0.502, p = 0.0005). In the seasons with potential factors that may increase the cough symptoms among the local population, additional caution and infection control measures may be required to suppress the spread of COVID-19 in the locality.
A limitation of the present study is that we were unable to determine which of the factors, i.e., the atmospheric temperature, humidity, and wind speed, contributed most to the SARS-CoV-2 transmission rate, as these factors were significantly correlated with each other. Another limitation includes the fact that the number of tested individuals and COVID-19 patients in the summer season of 2020 was much less than that in the winter season from 2020 to 2021. To conclude the possible association between atmospheric humidity levels and COVID-19 transmissibility, a similar analysis with a large number of tested individuals will be needed in the summer of 2021. Lastly, the estimated prevalence of cough symptoms in the local population was approximated based on the prevalence in test-negative individuals who were tested based on recent contact history; however, selection bias was possible in the RT-PCR-tested individuals. Individuals with a recent contact history who are symptomatic may be more likely to undergo a screening test compared to individuals with a contact history who are asymptomatic. To determine the impact of airway symptoms among the local population on the regional epidemic status, further research is needed, employing a real local population from the area (i.e., not at the screening test center).
In conclusion, the local epidemic status of COVID-19 infection significantly correlated with the concurrent COVID-19 transmission rate, prevalence of cough symptoms among the local population (both COVID-19 and non-COVID-19 populations), lower atmospheric humidity, and higher wind speed, all of which were significantly correlated with each other. Natural environmental factors were correlated with the regional epidemic status on a monthly scale, whereas airway symptoms in the local population showed a correlation on a weekly scale. Additional caution and additional infection control measures may be required during seasons with these possible environmental risks that may directly or indirectly increase SARS-CoV-2 transmissibility.
Acknowledgments
The authors deeply thank all medical staffs who joined and cooperated to the present COVID-19 screening test project. Also, we deeply thank local government staffs of Sendai City, Miyagi Prefecture, and public health centers for supporting the present study by establishing and managing the testing center, interviewing each individual ahead of testing about the contact history and symptoms, and performing contact tracing based on the achieved test results.
Conflict of Interest
The authors declare no conflict of interest.
References
-
Chen,
Y.,
Wang,
A.H.,
Yi,
B.,
Ding,
K.Q.,
Wang,
H.B.,
Wang,
J.M.,
Shi,
H.B.,
Wang,
S.J. &
Xu,
G.Z.
(2020) Epidemiological characteristics of infection in COVID-19 close contacts in Ningbo city. Zhonghua Liu Xing Bing Xue Za Zhi, 41, 667-671.
-
D’Amato,
M.,
Molino,
A.,
Calabrese,
G.,
Cecchi,
L.,
Annesi-Maesano,
I. &
D’Amato,
G.
(2018) The impact of cold on the respiratory tract and its consequences to respiratory health. Clin. Transl. Allergy, 8, 20.
-
Ferretti,
L.,
Wymant,
C.,
Kendall,
M.,
Zhao,
L.,
Nurtay,
A.,
Abeler-Dörner,
L.,
Parker,
M.,
Bonsall,
D. &
Fraser,
C.
(2020) Quantifying SARS-CoV-2 transmission suggests epidemic control with digital contact tracing. Science, 368, eabb6936.
-
Furuse,
Y.,
Sando,
E.,
Tsuchiya,
N.,
Miyahara,
R.,
Yasuda,
I.,
Ko,
Y.K.,
Saito,
M.,
Morimoto,
K.,
Imamura,
T.,
Shobugawa,
Y.,
Nagata,
S.,
Jindai,
K.,
Sunagawa,
T.,
Suzuki,
M.,
Nishiura,
H., et al.
(2020) Clusters of coronavirus disease in communities, Japan, January-April 2020. Emerg. Infect. Dis., 26, 2176-2179.
-
Galloway,
S.E.,
Paul,
P.,
MacCannell,
D.R.,
Johansson,
M.A.,
Brooks,
J.T.,
MacNeil,
A.,
Slayton,
R.B.,
Tong,
S.,
Silk,
B.J.,
Armstrong,
G.L.,
Biggerstaff,
M. &
Dugan,
V.G.
(2021) Emergence of SARS-CoV-2 B.1.1.7 Lineage - United States, December 29, 2020-January 12, 2021. MMWR Morb. Mortal. Wkly. Rep., 70, 95-99.
-
Goldman,
E.
(2020) Exaggerated risk of transmission of COVID-19 by fomites. Lancet Infect. Dis., 20, 892-893.
-
Guerra,
F.M.,
Bolotin,
S.,
Lim,
G.,
Heffernan,
J.,
Deeks,
S.L.,
Li,
Y. &
Crowcroft,
N.S.
(2017) The basic reproduction number (R(0)) of measles: a systematic review. Lancet Infect. Dis., 17, e420-e428.
-
He,
D.,
Zhao,
S.,
Lin,
Q.,
Zhuang,
Z.,
Cao,
P.,
Wang,
M.H. &
Yang,
L.
(2020) The relative transmissibility of asymptomatic COVID-19 infections among close contacts. Int. J. Infect. Dis., 94, 145-147.
-
Ishii,
T.,
Kushimoto,
S.,
Katori,
Y.,
Kure,
S.,
Igarashi,
K.,
Fujita,
M.,
Takayama,
S.,
Abe,
M.,
Tanaka,
J.,
Kikuchi,
A.,
Abe,
Y.,
Imai,
H.,
Inaba,
Y.,
Iwamatsu-Kobayashi,
Y.,
Nishioka,
T., et al.
(2021) Predictors of SARS-CoV-2 positivity based on RT-PCR swab tests at a drive-through outpatient clinic for COVID-19 screening in Japan. Tohoku J. Exp. Med., 253, 101-108.
-
Kemp,
S.A.,
Collier,
D.A.,
Datir,
R.P.,
Ferreira,
I.,
Gayed,
S.,
Jahun,
A.,
Hosmillo,
M.,
Rees-Spear,
C.,
Mlcochova,
P.,
Lumb,
I.U.,
Roberts,
D.J.,
Chandra,
A.,
Temperton,
N.,
Sharrocks,
K.,
Blane,
E., et al.
(2021) SARS-CoV-2 evolution during treatment of chronic infection. Nature, 592, 277-282.
-
Korber,
B.,
Fischer,
W.M.,
Gnanakaran,
S.,
Yoon,
H.,
Theiler,
J.,
Abfalterer,
W.,
Hengartner,
N.,
Giorgi,
E.E.,
Bhattacharya,
T.,
Foley,
B.,
Hastie,
K.M.,
Parker,
M.D.,
Partridge,
D.G.,
Evans,
C.M.,
Freeman,
T.M., et al.
(2020) Tracking changes in SARS-CoV-2 spike: evidence that D614G increases infectivity of the COVID-19 virus. Cell, 182, 812-827.e819.
-
Mecenas,
P.,
Bastos,
R.,
Vallinoto,
A.C.R. &
Normando,
D.
(2020) Effects of temperature and humidity on the spread of COVID-19: a systematic review. PLoS One, 15, e0238339.
-
Nishiura,
H.,
Yan,
P.,
Sleeman,
C.K. &
Mode,
C.J.
(2012) Estimating the transmission potential of supercritical processes based on the final size distribution of minor outbreaks. J. Theor. Biol., 294, 48-55.
-
Noti,
J.D.,
Blachere,
F.M.,
McMillen,
C.M.,
Lindsley,
W.G.,
Kashon,
M.L.,
Slaughter,
D.R. &
Beezhold,
D.H.
(2013) High humidity leads to loss of infectious influenza virus from simulated coughs. PLoS One, 8, e57485.
-
Park,
M.,
Cook,
A.R.,
Lim,
J.T.,
Sun,
Y. &
Dickens,
B.L.
(2020) A systematic review of COVID-19 epidemiology based on current evidence. J. Clin. Med., 9, 967.
-
Passali,
D.,
Cingi,
C.,
Staffa,
P.,
Passali,
F.,
Muluk,
N.B. &
Bellussi,
M.L.
(2018) The international study of the allergic rhinitis survey: outcomes from 4 geographical regions. Asia Pac. Allergy, 8, e7.
-
Qiu,
X.,
Nergiz,
A.I.,
Maraolo,
A.E.,
Bogoch, II,
Low, N. &
Cevik,
M.
(2021) The role of asymptomatic and pre-symptomatic infection in SARS-CoV-2 transmission: a living systematic review. Clin. Microbiol. Infect., 27, 511-519.
-
Rehman,
M.F.U.,
Fariha,
C.,
Anwar,
A.,
Shahzad,
N.,
Ahmad,
M.,
Mukhtar,
S. &
Farhan Ul Haque,
M.
(2021) Novel coronavirus disease (COVID-19) pandemic: a recent mini review. Comput. Struct. Biotechnol. J., 19, 612-623.
-
Reid,
M.,
Abdool-Karim,
Q.,
Geng,
E. &
Goosby,
E.
(2021) How will COVID-19 transform global health post-pandemic? Defining research and investment opportunities and priorities. PLoS Med., 18, e1003564.
-
Sajadi,
M.M.,
Habibzadeh,
P.,
Vintzileos,
A.,
Shokouhi,
S.,
Miralles-Wilhelm,
F. &
Amoroso,
A.
(2020) Temperature, humidity, and latitude analysis to estimate potential spread and seasonality of coronavirus disease 2019 (COVID-19). JAMA Netw. Open, 3, e2011834.
-
Satia,
I.,
Badri,
H.,
Al-Sheklly,
B.,
Smith,
J.A. &
Woodcock,
A.A.
(2016) Towards understanding and managing chronic cough. Clin. Med. (Lond.), 16, s92-s97.
-
Shirato,
K.,
Nao,
N.,
Katano,
H.,
Takayama,
I.,
Saito,
S.,
Kato,
F.,
Katoh,
H.,
Sakata,
M.,
Nakatsu,
Y.,
Mori,
Y.,
Kageyama,
T.,
Matsuyama,
S. &
Takeda,
M.
(2020) Development of genetic diagnostic methods for detection for novel coronavirus 2019(nCoV-2019) in Japan. Jpn. J. Infect. Dis., 73, 304-307.
-
Siordia,
J.A. Jr.
(2020) Epidemiology and clinical features of COVID-19: a review of current literature. J. Clin. Virol., 127, 104357.
-
Teach,
S.J.,
Gergen,
P.J.,
Szefler,
S.J.,
Mitchell,
H.E.,
Calatroni,
A.,
Wildfire,
J.,
Bloomberg,
G.R.,
Kercsmar,
C.M.,
Liu,
A.H.,
Makhija,
M.M.,
Matsui,
E.,
Morgan,
W.,
O’Connor,
G. &
Busse,
W.W.
(2015) Seasonal risk factors for asthma exacerbations among inner-city children. J. Allergy Clin. Immunol., 135, 1465-1473.e1465.
-
Ward,
M.P.,
Xiao,
S. &
Zhang,
Z.
(2020) Humidity is a consistent climatic factor contributing to SARS-CoV-2 transmission. Transbound. Emerg. Dis., 67, 3069-3074.
-
Wise,
J.
(2020) Covid-19: new coronavirus variant is identified in UK. BMJ, 371, m4857.


