Regular Contribution
Urinary Exosomal MicroRNAs as New Noninvasive Biomarkers of IgA Nephropathy
2022 Volume 256 Issue 3 Pages 215-223
Details
2022 Volume 256 Issue 3 Pages 215-223
Immunoglobulin A nephropathy (IgAN) is the most common type of primary glomerulonephritis. It is very important to find new noninvasive biomarkers for the diagnosis and treatment of IgAN. The purpose of this study was to explore the clinical value of urinary exosomal miRNAs in IgAN. In this study, urinary exosomes were isolated from 29 IgAN patients and 29 healthy controls. The miRNA was analyzed by high-throughput sequencing. The expression of hsa-miR-451a and hsa-let-7d-3p was examined by real-time quantitative polymerase chain reaction (RT-qPCR). The diagnostic value of miRNAs was evaluated using receiver operating characteristic (ROC) curves. Here, hsa-miR-451a and hsa-let-7d-3p were upregulated in IgAN patients compared with healthy controls. We evaluated the diagnostic value of hsa-miR-451a and hsa-let-7d-3p using ROC curves; hsa-miR-451a (AUC = 0.805, p = 0.001), hsa-mir-7d-3p (AUC = 0.76, p = 0.0049), and the combination of hsa-miR-451a and hsa-let-7d-3p (AUC = 0.8125, p = 0.0007). Hsa-miR-451a has correlations with Lee’s grades (r = 0.511, p = 0.021), and 24-h urinary protein excretion (UPE; r = 0.557, p = 0.011). Hsa-let-7d-3p showed correlations with Lee’s grades (r = 0.6, p = 0.005), UPE (r = 0.518, p = 0.019), serum creatinine (r = 0.564, p = 0.01), and estimated glomerular filtration rate (r = −0.532, p = 0.016). According to the Oxford classification, for hsa-miR-451a, S0 had lower levels than S1 (p = 0.016); for hsa-mir-7d-3p, M0 had lower levels than M1 (p = 0.05). These findings suggest that hsa-miR-451a and hsa-let-7d-3p may serve as noninvasive biomarkers for the evaluation of IgAN.
Immunoglobulin A nephropathy (IgAN) is the most common form of chronic glomerulonephritis in the world. IgAN is an important cause of end-stage renal disease (ESRD) (Berthoux et al. 2008). The gold standard for diagnosis of IgA nephropathy is renal biopsy (Moresco et al. 2015). Although recent advances made in medical devices have improved the safety of renal biopsy, the procedure is invasive, and cannot be repeated frequently. Therefore, it is extremely important to find a potential noninvasive biomarker for the early evaluation of IgAN.
Urine has the advantages of large available quantity, noninvasive collection, and simple handling. Therefore, urine is an ideal source of biomarkers for the diagnosis of kidney disease (Wang and Szeto 2007). Exosomes, small membrane-bound lipid vesicles with a diameter of 30-200 nm, are present in urine (Pisitkun et al. 2004; Shao et al. 2018). The exosome membrane surface expresses CD9 and CD63 (Vlassov et al. 2012), and exosomes contain mRNA and miRNA (Valadi et al. 2007). MiRNAs are a class of endogenous noncoding RNAs about 22 nucleotides in length, which play a role in post-transcriptional regulation by binding to mRNA (Bartel 2004; Farh et al. 2005; Esteller 2011). Urinary exosomes may originate from renal proximal tubular epithelial cells (Khurana et al. 2017). Exosomes can protect encapsulated small RNAs and prevent small RNAs from being degraded by enzymes (Cheng et al. 2014; Ohno and Kuroda 2016).
MiRNA plays an important role in the progression of nephropathy, and thus is a promising biomarker in kidney disease (Lorenzen et al. 2011; Chandrasekaran et al. 2012). Several studies have suggested that exosomal miRNAs may be potential biomarkers for kidney disease, such as systemic lupus erythematosus, diabetic nephropathy and so on (Barutta et al. 2013; Perez-Hernandez et al. 2015; Xie et al. 2017; Chen et al. 2019; Li et al. 2020; Tsuji et al. 2020). Therefore, exosomal miRNA may serve as a noninvasive biomarker in nephropathy.
In this study, we assessed the differential expression of urinary exosome miRNAs in patients with IgAN compared to healthy control (HC) and validated whether urinary exosome miRNA can be used as a biomarker for the evaluation of IgAN.
We designed the screening and validation phases of this study. In the screening phase, we collected urine samples from 9 IgAN patients and 9 HCs for high-throughput sequencing to identify differentially expressed miRNAs. In the validation phase, we collected urine samples from 20 IgAN patients and 20 HC subjects for real-time quantitative polymerase chain reaction (RT-qPCR) to validate candidate miRNAs.
SubjectsWe recruited 29 patients with IgAN, who had a confirmed first renal biopsy between December 2019 and December 2020 from the Department of Nephrology at the Shanxi Provincial People’s Hospital. We excluded patients with secondary IgA nephropathy and other concomitant renal diseases. We simultaneously recruited 29 volunteers who were confirmed to be normal by the Laboratory Department of Shanxi Provincial People’s Hospital. Basic information about the subjects was collected, such as age, sex, serum creatinine (Scr), estimated glomerular filtration rate (eGFR) and 24-h urinary protein excretion (UPE), at the time of kidney biopsy. All subjects signed informed consent and were approved by the Ethics Committee of Shanxi Provincial People’s Hospital.
Sample collection and processingSelected IgAN patients and HC subjects who met inclusion criteria collected morning urine before treatment. Urine samples were centrifuged at 3,000 × g for 15 min within 2 h after collection. The precipitate was discarded, and the supernatant was collected in new sterile centrifuge tube and stored at −80℃ for later use.
Urinary exosome isolationUsing high-throughput sequencing technology, exosomes were extracted from 3 pooled IgAN urine samples and 3 pooled urine samples of HC. The pooled samples were collected from 3 individuals with 20 mL urine each. For RT-qPCR, a 20 mL urine sample was collected from each person. Exosomes were extracted according to the urine exosome extraction kit instructions (Beijing BioRab Technology Co. Ltd, Beijing, China). Urine samples were centrifuged at 3,000 × g for 15 min at 4℃, discarding precipitate and leaving supernatant. The supernatant was poured into a clean centrifuge tube, and the urine sample was centrifuged at 10,000 × g for 20 minutes at 4℃, discarding precipitate and leaving supernatant. The supernatant was then poured into a clean centrifuge tube, and 1 mL of extract was added for every 4 mL of urine and mixed well for 1 min until the liquid was well mixed. After the overnight storage in a 4℃ refrigerator, the urine sample was centrifuged at 10,000 × g for 60 min at 4℃, discarding the supernatant and leaving the precipitate. The precipitate was resuspended in 80 μl exosome preservation solution, and the exosome sample was obtained.
Scanning electron microscopy (SEM)The exosomes were isolated with a urine exosome extraction kit and resuspended in phosphate-buffered saline. The exosomes were applied to a 200 mesh copper grid for 20 min, and the residual liquid at the edge of the copper mesh was absorbed using filter paper. Next, 2% phosphotungstic acid solution (HT152-250ML, Sigma, Darmstadt, Germany) was added for 10 min, and the copper grids were dried under incandescent lighting for 2 min. Photomicrographs were obtained using a transmission electron microscope.
Western blotThe exosomes were isolated with a urine exosome extraction kit, and the extracted protein was separated using 10% sodium dodecyl sulfate poly-acrylamide gel electrophoresis (SDS-PAGE) (Solarbio, Beijing, China). The protein transferred to polyvinylidene difluoride (PVDF) membranes, and the membranes were incubated with 5% nonfat milk for 1 h at room temperature. Then, the membrane was incubated with primary antibody (CD9, 1:1,000; CD63, 1:1,000) overnight at 4°C. Next, the membrane was washed with 1 × Tris-buffered saline (TBST) 3 times, for 10 min each, and then incubated with secondary antibodies (1:10,000) for 1 h. After washing with 1 × TBST 3 times, proteins of interest were detected using a gel imaging system.
RNA extractionExosomal RNA was isolated using an miRcute miRNA Isolation Kit (Tiangen Biotech, Beijing, China) following the manufacturer’s instructions. The concentration (ng/ml) and purity (A260/A280) of the RNAs were measured using a NanoDrop 2000 spectrophotometer (ThermoFisher Scientific, Waltham, MA, USA).
High-throughput sequencingIn this experiment, the single-ended 50 bp sequencing mode of the illumina Hiseq sequencing platform was used for high-throughput sequencing of samples. The original data need to be removed by primers and adaptor sequences, and the sequencing fragments should be qualitatively checked and finally the length screened to finally select the sequencing fragments with reliability. Reads from each sample were compared with the existing miRNA database (miRBase) and the predicted results of new miRNAs to calculate the miRNA expression level. DESEQ software (Bioconductor, Seattle, WA, USA) was used to analyze the differential expression between the sample group control and the sample group case. The expression level of each sample and the intra-group mean were calculated, and the inter-group difference fold change was calculated, and then log2 (fold change) was calculated. When p was ≤ 0.05 and log2 (fold change) was ≥ 1, we believed that such genes were significantly different between groups. We performed high-throughput sequencing (Jingneng Biotechnology, Shanghai, China).
RT- qPCR analysisRT-qPCR was performed according to Minimum Information for Publication of Quantitative Real-Time PCR Experiments (MIQE) guidelines to confirm hsa-miR-451a and hsa-let-7d-3p (Bustin et al. 2009). RT-qPCR was performed using a miRcute plus miRNA First-Strand cDNA Synthesis Kit (Tiangen Biotech) according to manufacturer’s instructions. RT-qPCR was performed on an RT-PCR instrument using an miRcute plus miRNA qPCR Detection Kit (Tiangen Biotech) according to the manufacturer’s protocol. Relative miRNA expression was calculated following the delta-delta Ct method.
Bioinformatic analysisWe predicted target genes using the online algorithm: miRDB (http://www.mirdb.org/), miRTaBase (http://mirtarbase.cuhk.edu.cn/), and targetScan (http://www.targetscan.org) (Lewis et al. 2005). The network of miRNAs and target genes was constructed using Cytoscape software (https://www.cytoscape.org/). In order to understand the function of hsa-miR-451a and hsa-let-7d-3p, we performed gene ontology (GO) analysis using a DAVID online analysis tool (https://david.ncifcrf.gov) (Huang et al. 2009).
Statistical analysisStatistical analysis was performed using SPSS® version 22.0 software (IBM®, Armonk, New York, NY, USA), GraphPad Prism® 8 (GraphPad Software, Inc., San Diego, CA, USA), and Cytoscape software for graphing. The data are presented as mean ± standard deviation (SD). Nonparametric Mann-Whitney test for 2 independent samples was performed to identify the differences in exosomal miRNA expression between the IgAN and HCs groups. The joint predictors were obtained by logistic regression analysis. Receiver operating characteristic (ROC) curve was utilized to evaluate the diagnostic value of urinary exosomal miRNAs. We used Spearman’s rank correlation analysis to assess correlations between exosomal miRNAs and clinical parameters. P ≤ 0.05 was considered statistically significant.
Twenty-nine IgAN patients and 29 HC subjects participated in this study. Demographic and clinical characteristics of the subjects were recorded (Table 1). UPE (g/24 h) and Scr of IgAN patients were significantly higher than the HC group. Also, IgAN patients had significantly lower levels of eGFR than the HC group.
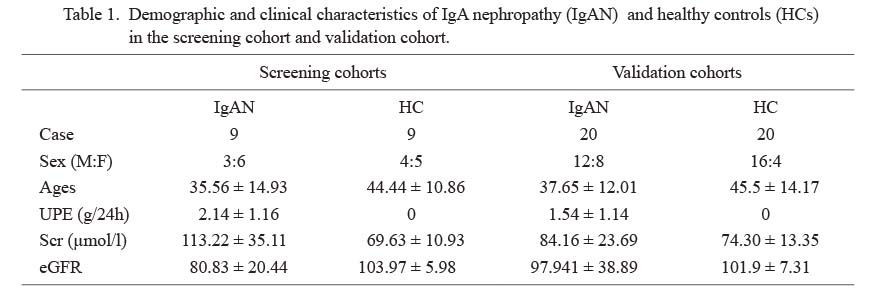
Demographic and clinical characteristics of IgA nephropathy (IgAN) and healthy controls (HCs) in the screening cohort and validation cohort.
Data are shown as number or mean ± SD.
M, male; F, female; UPE, 24-hour urinary protein excretion; Scr, serum creatinine; eGFR, estimated glomerular filtration rate.
Exosomes were isolated with a urine exosome extraction kit and observed on transmission electron microscopy (Fig. 1). We performed western blot analysis to confirm the presence of exosomal markers CD9 and CD63. (Fig. 2).

The shape and structure of urinary exosomes under transmission electron microscopy. Bars = 200 nm. Magnification = 150,000×.
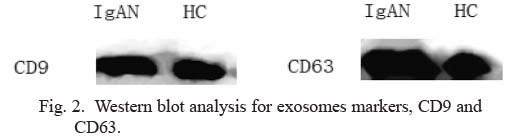
Western blot analysis for exosomes markers, CD9 and CD63.
IgAN, IgA nephropathy; HC, healthy control.
High-throughput sequencing was performed to analyze the urine exosomal miRNA expression profiles in IgAN patients and HC subjects (Table 2, Figs. 3, 4). We identified 9 differentially expressed miRNAs [p < 0.05, log2 (fold change) > 10]. Seven miRNAs were upregulated in the IgAN group compared with the HC group.

Differential expression profiles of exosomal miRNA profiles in the IgA nephropathy group and the healthy controls group.
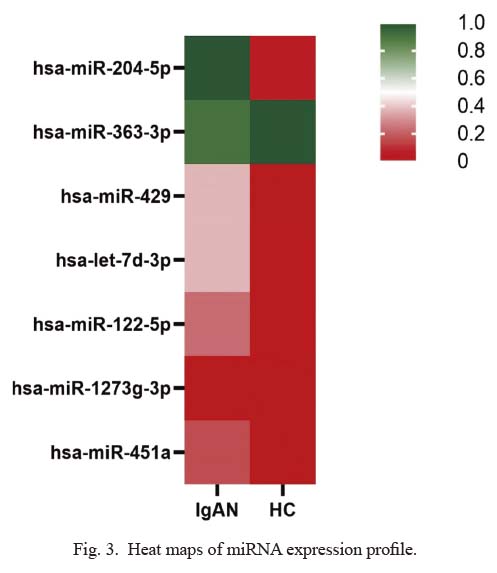
Heat maps of miRNA expression profile.
Heat map colors represent exosomal miRNA expression: red represents low expression, and green represents high expression. IgAN, IgA nephropathy; HC, healthy control.

Volcano Plot of miRNA expression profile.
Heat map colors represent exosomal miRNA expression: red represents p value ≤ 0.05 and log2 (fold change) ≥ 1, and black represents p value > 0.05.
We performed RT-qPCR to confirm the results of the high-throughput sequencing technology. RT-qPCR results showed that hsa-miR-451a and hsa-let-7d-3p were significantly upregulated in the IgAN group compared with the HC group (Fig. 5), which was consistent with the high-throughput sequencing results.

Comparison of relative expression levels of hsa-mir-451a and hsa-let-7d-3p between IgA nephropathy (IgAN) group and healthy control (HC) group.
Whisker-Box plots show the expression of hsa-mir-451a (A) and hsa-let-7d-3p (B) in the IgAN and HC groups. Expression levels were measured by RT-qPCR. Statistical analysis using Mann-Whitney U test showed that hsa-miR-451a and hsa-let-7D-3p were significantly upregulated in IgAN group compared with HC group.
We performed ROC curve analysis to evaluate the diagnostic value of urine exosomal miRNAs in IgAN. The AUC and p values of the miRNAs were as follows: AUC = 0.805, p = 0.001 for hsa-miR-451a; AUC = 0.76, p = 0.0049 for hsa-mir-7d-3p; AUC = 0.8125, p = 0.0007 for hsa-miR-451a and hsa-let-7d-3p combined (Fig. 6). These results suggested that hsa-miR-451a and hsa-let-7d-3p may be new biomarkers for diagnosis of IgAN, while the combination of hsa-miR-451a and hsa-let-7d-3p has higher diagnostic value.

Receiver Operating Characteristic (ROC) curve to analyze the sensitivity and specificity of hsa-mir-451a and hsa-let-7d-3p for distinguishing IgA nephropathy (IgAN).
Hsa-mir-451a (Area under the curve; AUC = 0.805, p = 0.001), hsa-mir-7d-3p (AUC = 0.76, p = 0.0049), and the combination of hsa-mir-451a and hsa-let-7d-3p (AUC = 0.8125, p = 0.0007).
We analyzed the correlations between urinary exosomal miRNAs and clinical parameters (Table 3). Hsa-miR-451a expression showed positive correlations with Lee’s grades (r = 0.511, p = 0.021), UPE (r = 0.557, p = 0.011), and Scr (r = 0.358, p = 0.121), and was negatively correlated with eGFR (r = −0.358, p = 0.082). Hsa-let-7d-3p expression showed positive correlations with Lee’s grades (r = 0.6, p = 0.005), UPE (r = 0.518, p = 0.019), and Scr (r = 0.564, p = 0.01), and was negatively correlated with eGFR (r = −0.532, p = 0.016). Relationship between hsa-miR-451a and hsa-mir-7d-3p levels and pathological parameters in IgAN was classified according to the Oxford classification (Fig. 7). The whisker-box plots depict the relative expression level of hsa-miR-451a and hsa-mir-7d-3p. For hsa-miR-451a, S0 had significantly lower levels than S1 (S0 vs. S1, p = 0.016). For hsa-mir-7d-3p, M0 had significantly lower levels than M1 (M0 vs. M1, p = 0.05).

Correlations between hsa-mir-451a/hsa-let-7d-3p and clinical parameters in IgA nephropathy.
r, Spearman correlation coefficient; 95% CI, 95% confidence interval; UPE, 24-hour urinary protein excretion; Scr, serum creatinine; eGFR, estimated glomerular filtration rate.
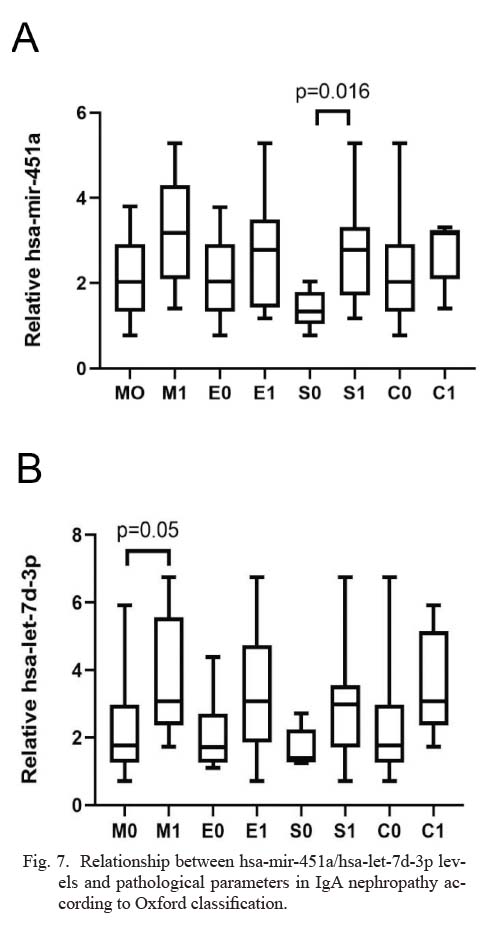
Relationship between hsa-mir-451a/hsa-let-7d-3p levels and pathological parameters in IgA nephropathy according to Oxford classification.
The whisker-box plots depict the relative expression level of hsa-mir-451a and hsa-let-7d-3p. Data were analyzed by Mann-Whitney U test. For hsa-mir-451a, M0 vs. M1, p = 0.106; E0 vs. E1, p = 0.425; S0 vs. S1, p = 0.016; C0 vs. C1, p = 0.239. For hsa-let-7d-3p, M0 vs. M1, p = 0.05; E0 vs. E1, p = 0.053; S0 vs. S1, p = 0.15; C0 vs. C1, p = 0.064.
For hsa-miR-451a, there were 29, 40, and 22 target genes predicted by TargetScan, miRDB, and miRTaBase. For hsa-let-7d-3p, there were 490, 44, and 23 target genes predicted by TargetScan, miRDB, and miRTaBase. Target genes predicted by 2 algorithms were selected (Fig. 8A, B). We predicted 16 targets genes for hsa-miR-451a and 43 target genes for hsa-let-7d-3p (Fig. 8C, D).

Target genes predicted of the hsa-mir-451a and hsa-let-7d-3p.
Hsa-mir-451a and hsa-let-7d-3p target genes predicted by Targetscan, miRDB and miRTaBase (A and B). The network of target genes and hsa-mir-451a and hsa-let-7d-3p by Cytoscape software (C and D).
In order to understand the function of hsa-miR-451a and hsa-let-7d-3p, we performed GO functional enrichment analysis using the DAVID analysis tool. GO functional enrichment analysis includes cellular component (CC), molecular function (MF), and biological process (BP) (Fig. 9). The most significantly enriched GO terms were regulation of mRNA stability (BP), extracellular exosome (CC), and transferase activity (MF).
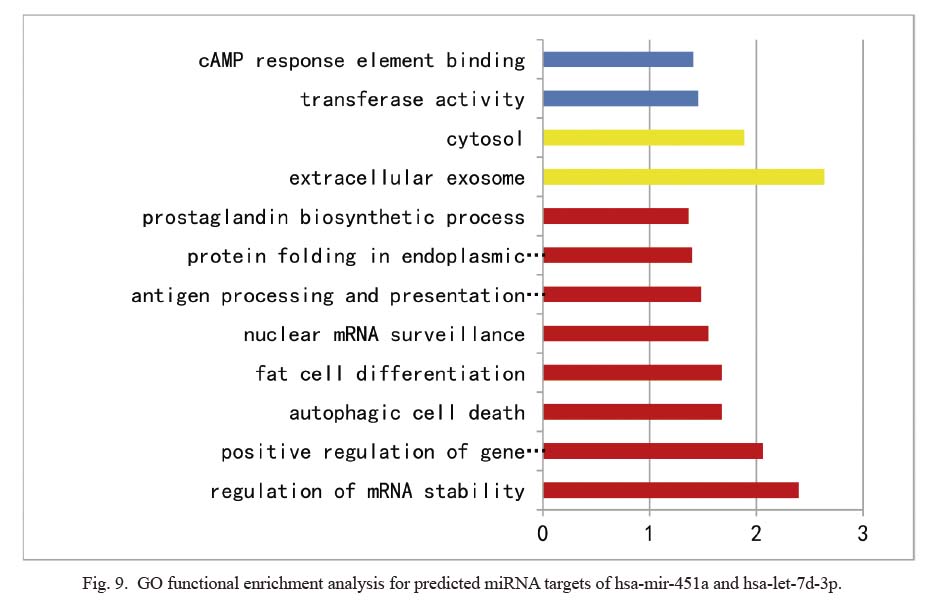
GO functional enrichment analysis for predicted miRNA targets of hsa-mir-451a and hsa-let-7d-3p.
We performed GO functional enrichment analysis using DAVID analysis tool. Red represents biological process (BP), yellow represents cellular component (CC), and blue represents molecular function (MF).
IgAN is a common primary glomerular disease in China, and the search for novel biomarkers is crucial for its diagnosis. Recent studies have shown that urinary exosomal circRNAs as new noninvasive biomarkers of IgAN, suggesting the potential roles of urinary exosomal circRNAs and miRNAs in the development of IgAN (Gao et al. 2020). In kidney disease, miRNA is present in urinary exosomes, and miRNA are potential biomarkers in kidney disease (Lv et al. 2013).
In the present study, exosomes were successfully extracted. Through high-throughput sequencing and RT-qPCR, it was found that the expression levels of hsa-miR-451a and hsa-let-7d-3p in IgAN patients were significantly higher than those in the HC group. Exosomes hsa-miR-451a and hsa-let-7d-3p exhibited high AUCs for an IgAN diagnosis. The combination of hsa-miR-451a and hsa-let-7d-3p had higher AUCS. Hsa-miR-451a and hsa-let-7d-3p were significantly related to eGFR, Lee’s grades, UPE, and Scr. According to Oxford classification, for hsa-mir-451a, S0 had significantly lower levels than S1 (S0 vs. S1, p = 0.016); for hsa-mir-7d-3p, M0 had significantly lower levels than M1 (M0 vs. M1, p = 0.05). Therefore, our study suggested that the exosomes hsa-miR-451a and hsa-let-7d-3p had clinical diagnostic value in the diagnosis of IgAN, while the combination of hsa-mir-451a and hsa-let-7d-3p had a higher diagnostic value.
Hsa-mir-451a and hsa-let-7d-3p play important roles in renal diseases. Hsa-miR-451a may be a promising biomarker of adrenal myelolipoma (Decmann et al. 2018). Ding et al. (2016) reported the miRNA expression profiles of HC subjects and patients with type 2 diabetes who were screened based on microarray. MiRNAs were validated by RT-qPCR. The study found that hsa-miR-451a has differential expressions in patients with type 2 diabetes mellitus compared with HC subjects, and that hsa-miR-451a dysregulation may be related to the pathogenesis of diabetic nephropathy (Ding et al. 2016). MiR-451 inhibits neutrophil chemotaxis through p38 MAPK and is an important target for the treatment of autoimmune arthritis (Murata et al. 2014). MiR-451 affects CD4+ T-cell function (Morandi and Pistoia 2013). In CD4 T lymphocytes, hsa-let-7d-3p was significantly differentially expressed (Wang-Renault et al. 2018).
In the next experiment, first, the sample size should be further expanded. Second, further investigation is needed to clarify whether hsa-mir-451a and hsa-let-7d-3p have the relationship with clinical and pathological severity in other kidney diseases. Third, the pathogenesis of this disease needs to be further studied.
In conclusion, we analyzed the expression of urinary exosome miRNA in patients with IgAN and HC subjects. Exosomes hsa-miR-451a and hsa-let-7d-3p in IgAN were significantly higher than those in the HC, and the levels of both hsa-miR-451a and hsa-let-7d-3p were correlated with disease severity. Exosome hsa-miR-451a and hsa-let-7d-3p may be noninvasive biomarkers for the evaluation of IgAN.
The authors declare no conflict of interest.