Abstract
Fluid mechanics show that high-density gases need more energy while flowing through a tube. Thus, high-density anesthetic gases consume more energy to flow and less energy for lung inflation during general anesthesia. However, its impact has not been studied. Therefore, this study aimed to investigate the effects of high-density anesthetic gases on tidal volume in laboratory and clinical settings. In the laboratory study, a test lung was ventilated at the same pressure-controlled ventilation with 22 different gas compositions (density range, 1.22-2.27 kg/m3) using an anesthesia machine. A pneumotachometer was used to record the tidal volume of the test lung and the respiratory gas composition; it showed that the tidal volume of the test lung decreased as the respiratory gas density increased. In the clinical study, the change in tidal volume per body weight, accompanied by gas composition change (2% sevoflurane in oxygen and with 0-30-60% of N2O), was recorded in 30 pediatric patients. The median tidal volume per body weight decreased by 10% when the respiratory gas density increased from 1.41 kg/m3 to 1.70 kg/m3, indicating a significant between-group difference (P < 0.0001). In both settings, an increase in respiratory gas density decreased the tidal volume during pressure-controlled ventilation, which could be explained by the fluid dynamics theory. This study clarified the detailed mechanism of high-density anesthetic gas reduced the tidal volume during mechanical ventilation and revealed that this phenomenon occurs during pediatric anesthesia, which facilitates further understanding of the mechanics of ventilation during anesthesia practice and respiratory physiology.
Introduction
Lung compliance and airway resistance are known to affect the tidal volume (TV) during pressure-controlled ventilation (PCV). However, the impact of respiratory gas composition changes on the actual TV of the patient during PCV is not widely understood. It is important for anesthesiologists to understand the factors that can change the actual TV.
To date, some laboratory studies have shown that the gas density in the breathing system influences airway resistance (Mondoñedo et al. 2017). Recent clinical studies showed that anesthetic gases, which have higher densities than air and oxygen, increase airway resistance (Habre et al. 2001; Nyktari et al. 2011). However, this phenomenon has not been well recognized due to two conflicting characteristics of anesthetic gases. Volatile anesthetics have a physiological broncho-dilatory effect that decreases the resistance of small airways in clinical settings, and anesthetic gases in physical nature have a higher density, requiring higher energy to flow (Goff et al. 2000). These characteristics can neutralize each other. Comprehensive studies wherein the laboratory and clinical data are analyzed based on the laws of physics are required to understand the TV change accompanying respiratory gas composition change during PCV.
Furthermore, studies have reported that the respiratory gas composition affects the accuracy of respiratory flow measurements (Bachiller et al. 2008; Miyaji et al. 2015). Therefore, a pneumotachometer combined with a gas analyzer, which corrects the respiratory flow measurement using the gas compositions in the respiratory circuit, is needed to measure the actual TV delivered to a patient during PCV.
In this study, we conducted two laboratory experiments and a clinical study to investigate the impact of respiratory gas density on true TV during PCV. In the first stage of the laboratory study, we verified the accuracy of the above-referenced external pneumotachometer using a calibration syringe with various gas mixtures. In the second stage, we ventilated a test lung with various gas mixtures delivered by an anesthesia machine under a predetermined PCV setting. In addition, we recorded the TV of the test lung and the respiratory gas compositions measured by the external pneumotachometer while simultaneously recording the TV displayed by the anesthesia machine. In the clinical study, we ventilated the pediatric patients with three respiratory gas compositions under the same PCV setting and measured the TV of the patients for each respiratory gas composition using the pneumotachometer.
Materials and Methods
Laboratory study
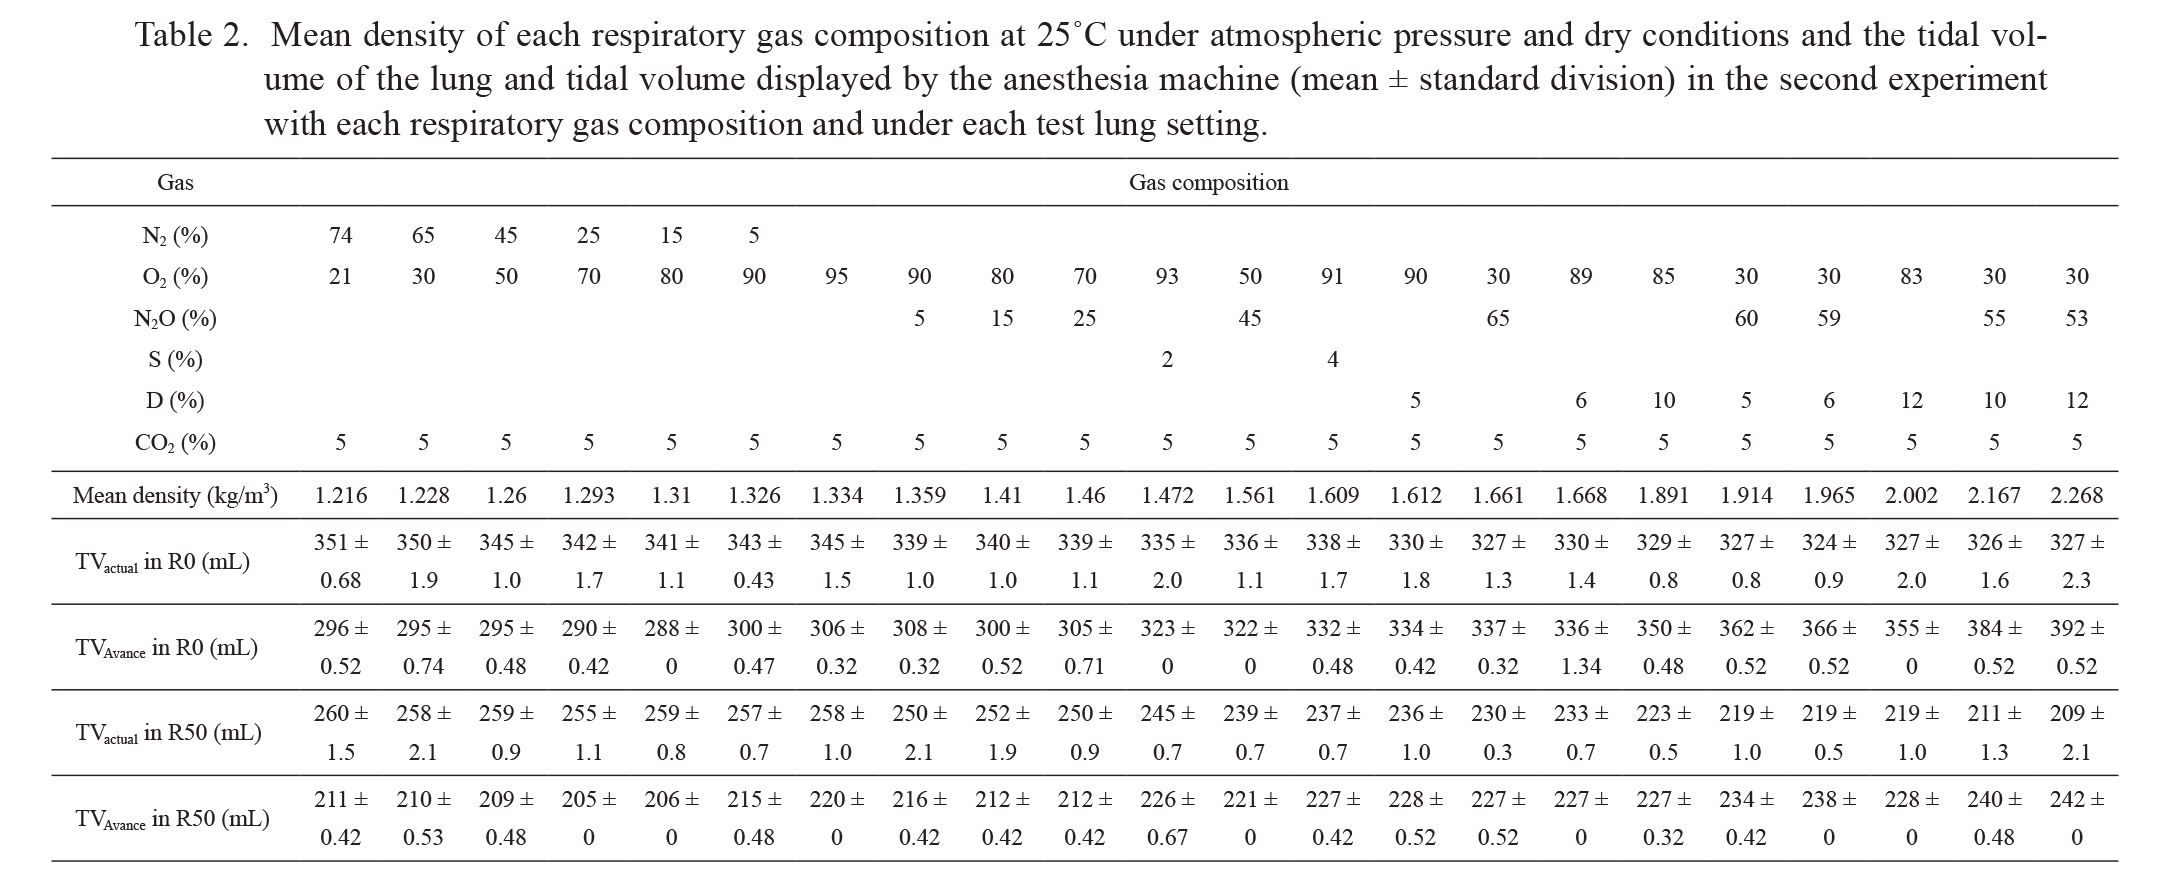
Anesthesia machine and anesthetic gases: This study was performed at 25℃, and various gas mixtures, composed of oxygen, nitrogen, nitrous oxide (N2O), sevoflurane, and/or desflurane, were delivered via an Avance® anesthesia machine (GE Healthcare, Chicago, IL, USA) without a gas sampling module. Avance® and a respiratory circuit were calibrated to detect the compression volume of the circuit prior to the experiment. Densities of the gases used in this study at 0 and 25℃ under atmospheric pressure and dry (ATPD) conditions are shown in Table 1. The mean densities of the gas mixtures used in this study at 25℃ under ATPD conditions are presented in Table 2. During the experiment, the gas flow and a vaporizer were regulated to achieve the target gas compositions.
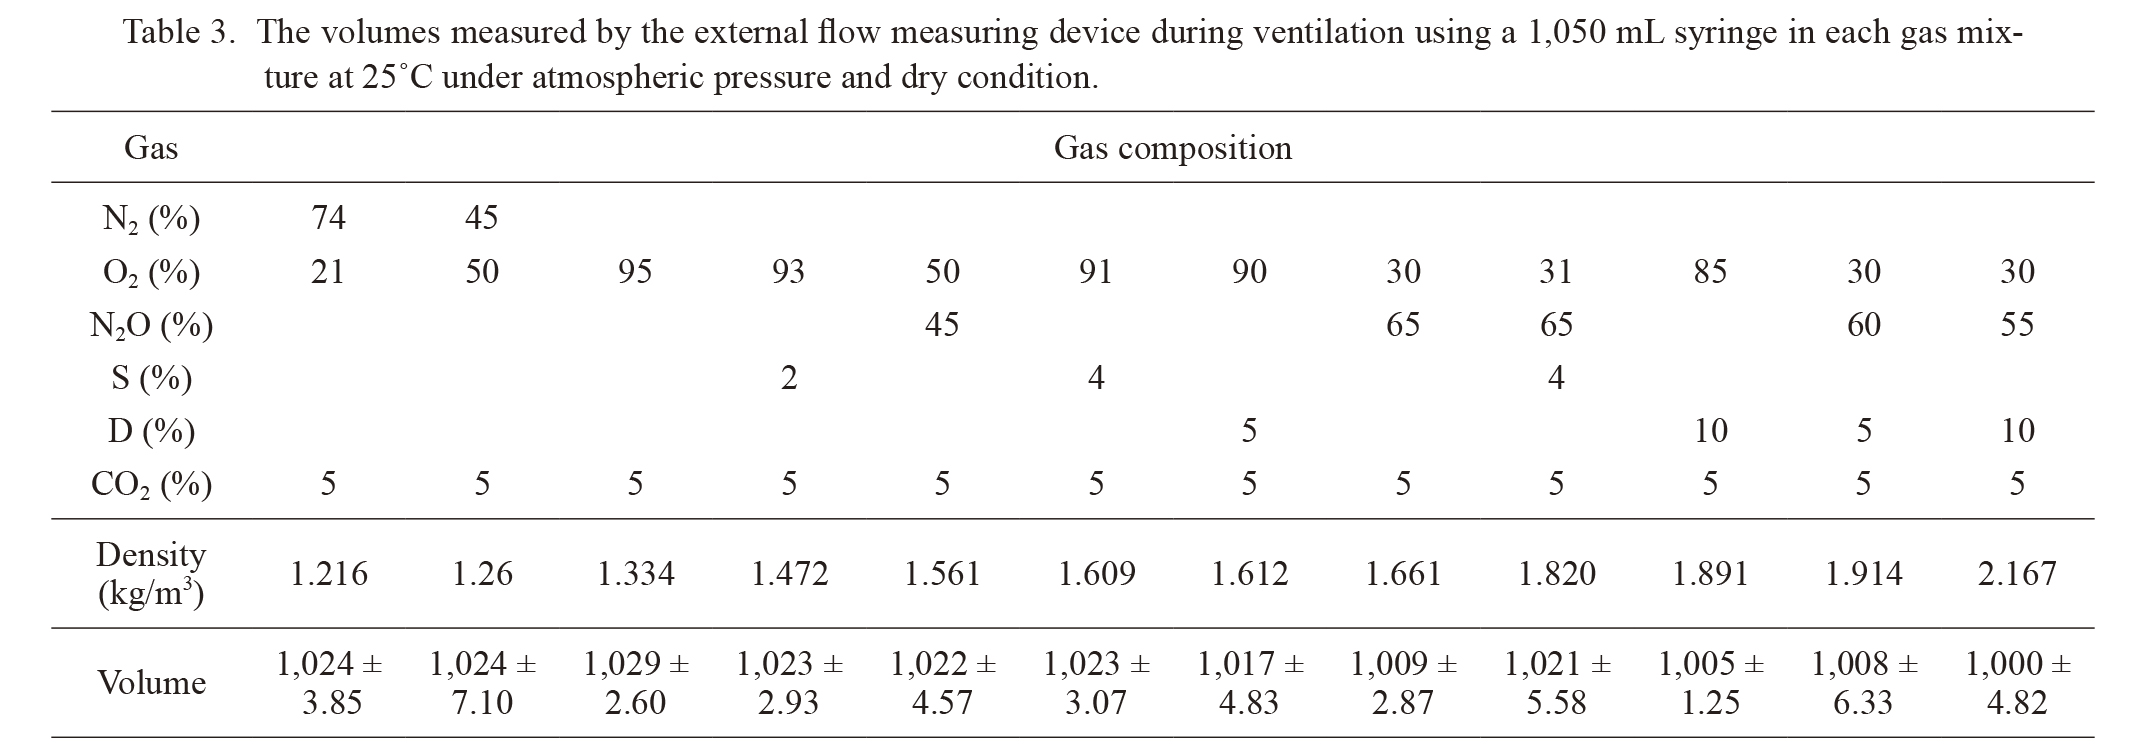
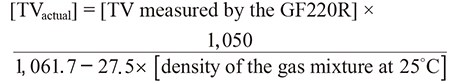
First experiment: An external flow measuring device GF220R® (Nihon Kohden, Tokyo, Japan) is a differential pressure flowmeter with a side-stream gas analyzer that can measure the flow volume, airway pressure, TV, and respiratory gas compositions at a sampling rate of 125 Hz. Additionally, the GF220R® can show TV adjusted for the gas density, viscosity, temperature, and pressure under a specified temperature. The accuracy of the GF220R® was evaluated in the first experiment. The censor of the GF220R® was connected to a 1,050 mL calibration syringe (Minato Medical Science, Osaka, Japan) and manually ventilated with various gas mixtures at 25℃ under dry conditions. The potential measurement error of the GF220R® was assessed using the difference between the volume measured by the GF220R® and 1,050 mL. During this experiment, intra-syringe pressure was controlled within the range of 5-20 cmH2O to accurately simulate the main experiment conditions. Subsequently, the TV measured by the GF220R® in the following experiments was calculated offline using the correction formula derived from the result of this experiment.
Second experiment: Fig. 1 shows the experimental system used in the second experiment. A test lung with adjustable resistance and compliance (Lung simulator, model 0015001, SMS, Harlow, UK) was ventilated by the aforementioned Avance® anesthesia machine at a fixed PCV setting. The GF220R® was placed between the Y piece of a breathing circuit and the test lung. Respiratory gas was sampled from the side-stream port between the differential pressure flowmeter and the test lung, and returned to the test lung side of the side-stream port to avoid affecting the TV measurement. A small amount of carbon dioxide (CO2) gas was injected into the test lung, and approximately 38 torr (5%) of end-tidal CO2 tension was maintained to recreate the clinical gas compositions.
We set the following conditions for the test lung: compliance of 50 mL/cmH2O with a resistance of 0 cmH2O/L/s (R0) or compliance of 50 mL/cmH2O with a resistance of 50 cmH2O/L/s (R50). The test lung was ventilated by the anesthesia machine with a predetermined PCV setting of positive end-expiratory pressure (PEEP) 5 cmH2O, driving pressure 15 cmH2O, respiratory rate 15 breaths/min, inspiratory time (TI) 1 s, and total fresh gas flow 3 L/min. The test lung was ventilated with 22 different gas mixtures composed of oxygen, nitrogen, N2O, sevoflurane, and/or desflurane (Table 2). After attaining a stable respiratory gas composition and the ventilatory status, we simultaneously recorded the respiratory gas composition and the TV of the lung (TVactual), which was measured by the GF220R® and subsequently corrected using the correction formula from the first experiment, and the TV displayed by the Avance® anesthesia machine (TVAvance). Ten consecutive TVs were recorded for each respiratory gas composition at each test lung setting.

After receiving approval from the Ethics Committee of Tohoku University Graduate School of Medicine, this protocol was registered [UMIN-CTR (UMIN000042544)] and implemented from November 2020 to January 2021. Written documentation of informed consent was obtained from the parents of all study participants. This prospective observational study was conducted at Tohoku University Hospital, and patients aged 1-12 years undergoing elective surgery under general anesthesia, with PCV via cuffed endotracheal tube, at the hospital were considered for participation in this study. Exclusion criteria of this study were the presence of respiratory disease, difficult airway, and a risk of malignant hyperthermia.
Ventilatory measurement was performed during the stable period between tracheal intubation and skin incision. During the measurement, anesthesia was maintained with propofol, fentanyl, and remifentanil. Rocuronium was used to eliminate spontaneous breathing and obtain sufficient muscle relaxation. Participants were ventilated by the aforementioned Avance® anesthesia machine. The ventilator settings were PEEP 5 cmH2O; driving pressure 10 or 15 cmH2O; respiratory rate 15 breaths/min; inspiratory-to-expiratory time ratio 1:2; and total fresh gas flow 3 L/min. To eliminate the bronchodilation effect of volatile anesthetic on airway resistance, we maintained the end-tidal concentration of sevoflurane at 2% during the measurement periods. The target respiratory gas compositions were as follows: 2% sevoflurane + oxygen, 2% sevoflurane + 30% N2O + oxygen, and 2% sevoflurane + 60% N2O + oxygen. After attaining a stable target respiratory gas composition and ventilatory status, we simultaneously recorded the respiratory gas composition and 10 consecutive TVactual and TVAvance values.
Data analysis
Data analyses were performed using Excel ver. 16 (Microsoft Corporation, Redmond, WA, USA) and JMP Pro 15 (SAS Institute Inc., Cary, NC, USA). In the laboratory study, the measured TVs are presented as mean ± standard deviation (SD). The relationships between the respiratory gas density and the two different TVs (TVactual and TVAvance) were analyzed by correlation analysis. In the clinical study, TVactual per bodyweight (TVactual/BW) data obtained from each participant are presented as mean ± SD. Wilcoxon signed-rank test was used to evaluate a difference in TVactual/BW among the three respiratory gas compositions. Values of P < 0.05 were considered statistically significant.
It was calculated that 24 pairs of data set were needed to demonstrate 6% difference between TVactual/BW in ventilation with 2% sevoflurane + oxygen and with 2% sevoflurane + 60% N2O + O2, when mean TVactual/BW, 1 SD, statistical power, and alpha error were set to 10 mL/kg, 10% of TVactual/BW, 80% (0.8), and 5% (0.05), respectively.
Results
Laboratory study
First experiment: The volumes measured by the GF220R® tended to decrease with an increase in the density of gas mixtures (Table 3). The difference between the maximum and minimum measured volumes was 29.7 mL, which was equal to 2.8% of the 1,050 mL syringe. The following correcting formula was used for the second experiment and clinical study to compensate for this trend:
Second experiment: Table 2 shows TVactual and TVAvance with each respiratory gas composition and in each test lung setting. Fig. 2 shows a scatter plot of the respiratory gas density versus TVactual and TVAvance. TVactual decreased with an increase in the respiratory gas density. There was a significant correlation between the respiratory gas density and TVactual (P < 0.0001) in R0 and R50 test lung settings. The Pearson correlation coefficients (r) for this correlation in the R0 and R50 settings were −0.883 and −0.983, respectively.
Contrary to the relationship between TVactual and respiratory gas density, TVAvance increased with an increase in respiratory gas density (Table 2). Similarly, there was a significant correlation between the respiratory gas density and TVAvance (P < 0.0001). Coefficients of this correlation under the R0 and R50 settings were 0.982 and 0.915, respectively.
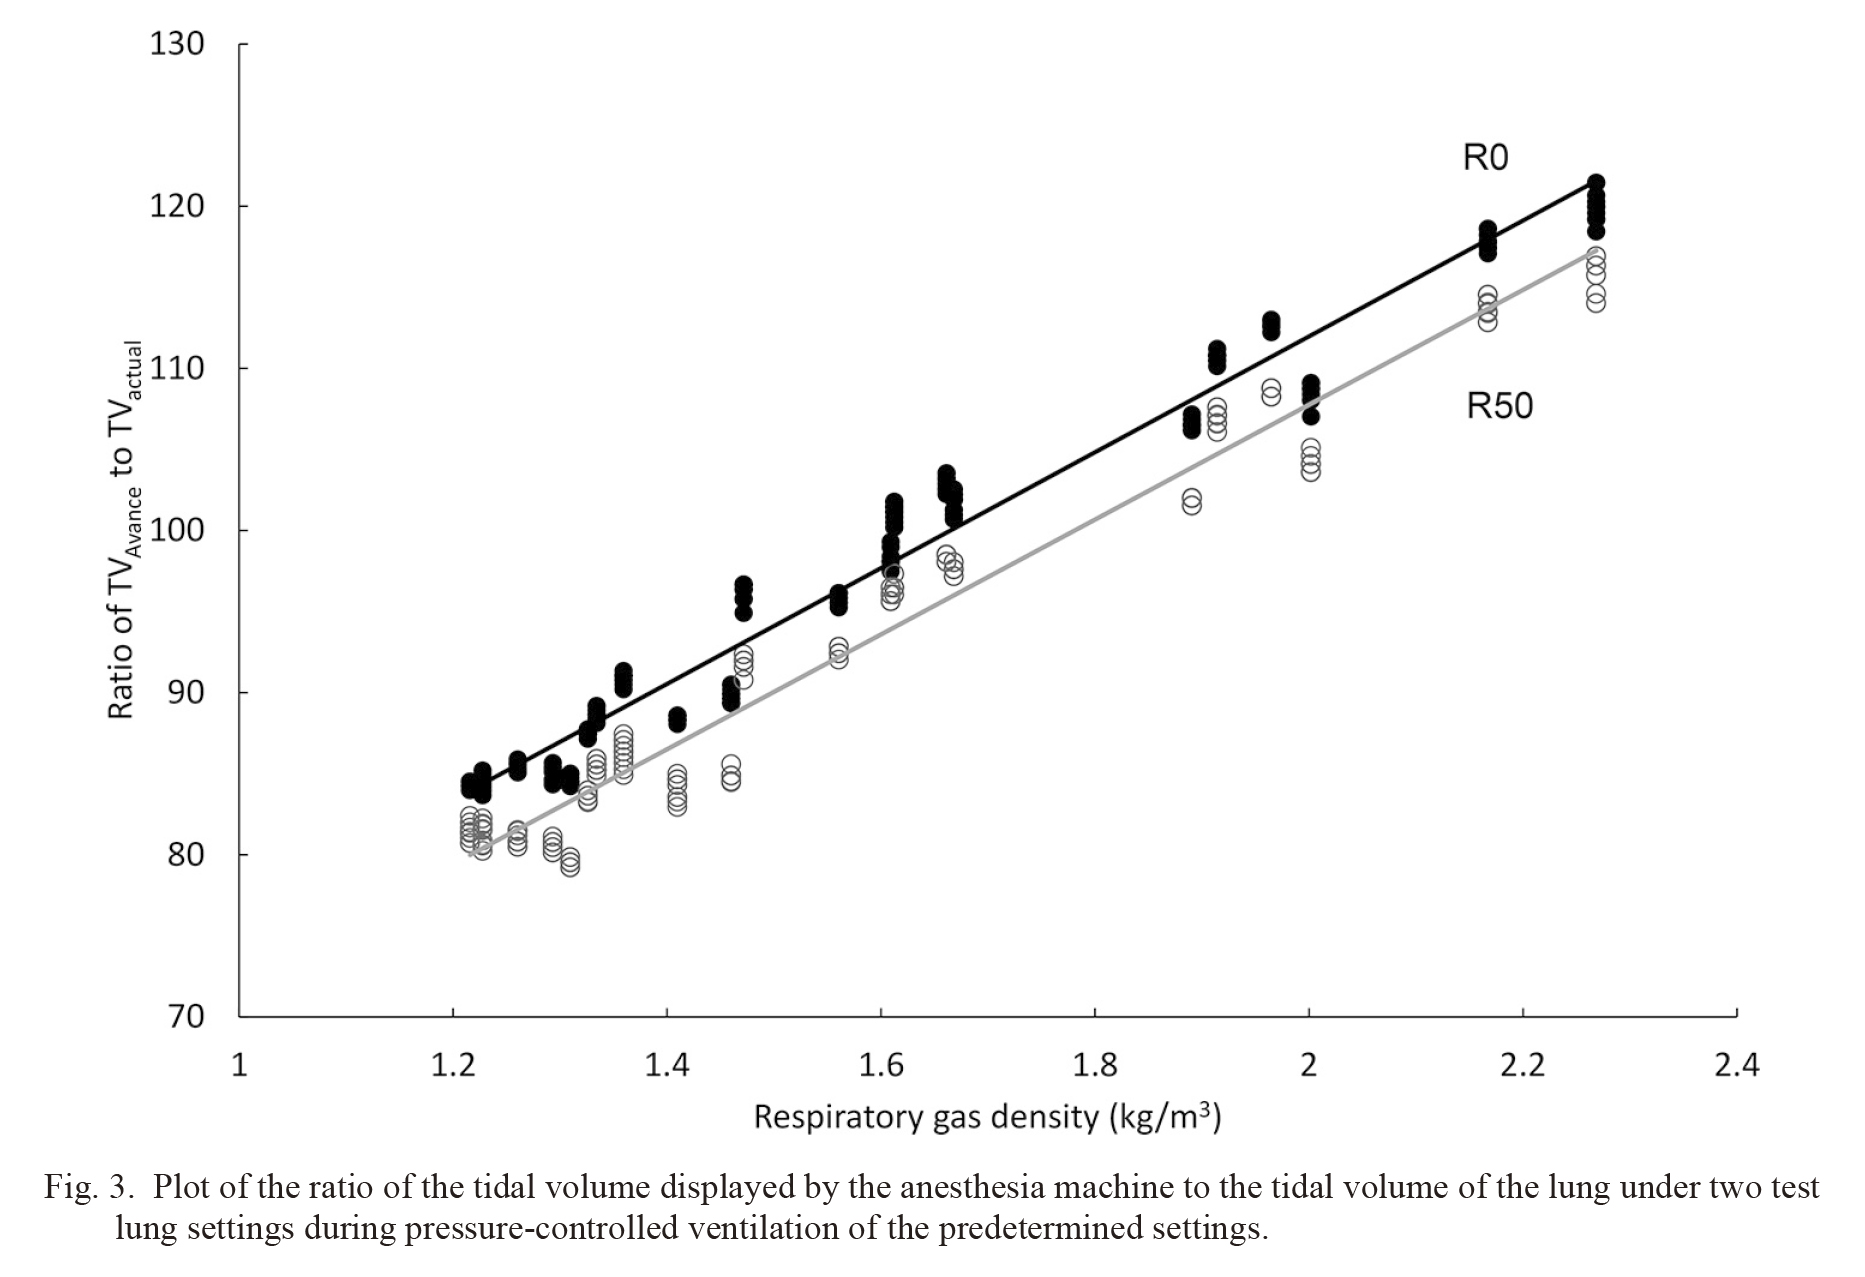
TVAvance agreed with TVactual only at a respiratory gas density of approximately 1.7 kg/m3 (Fig. 3). We found that the ratio of TVAvance to TVactual increased with an increase in respiratory gas density regardless of the resistance setting of the test lung. There was a significant correlation between the respiratory gas density and the ratio of TVAvance to the TVactual (P < 0.0001). Coefficients of this correlation under the R0 and R50 settings were 0.968 and 0.960, respectively.
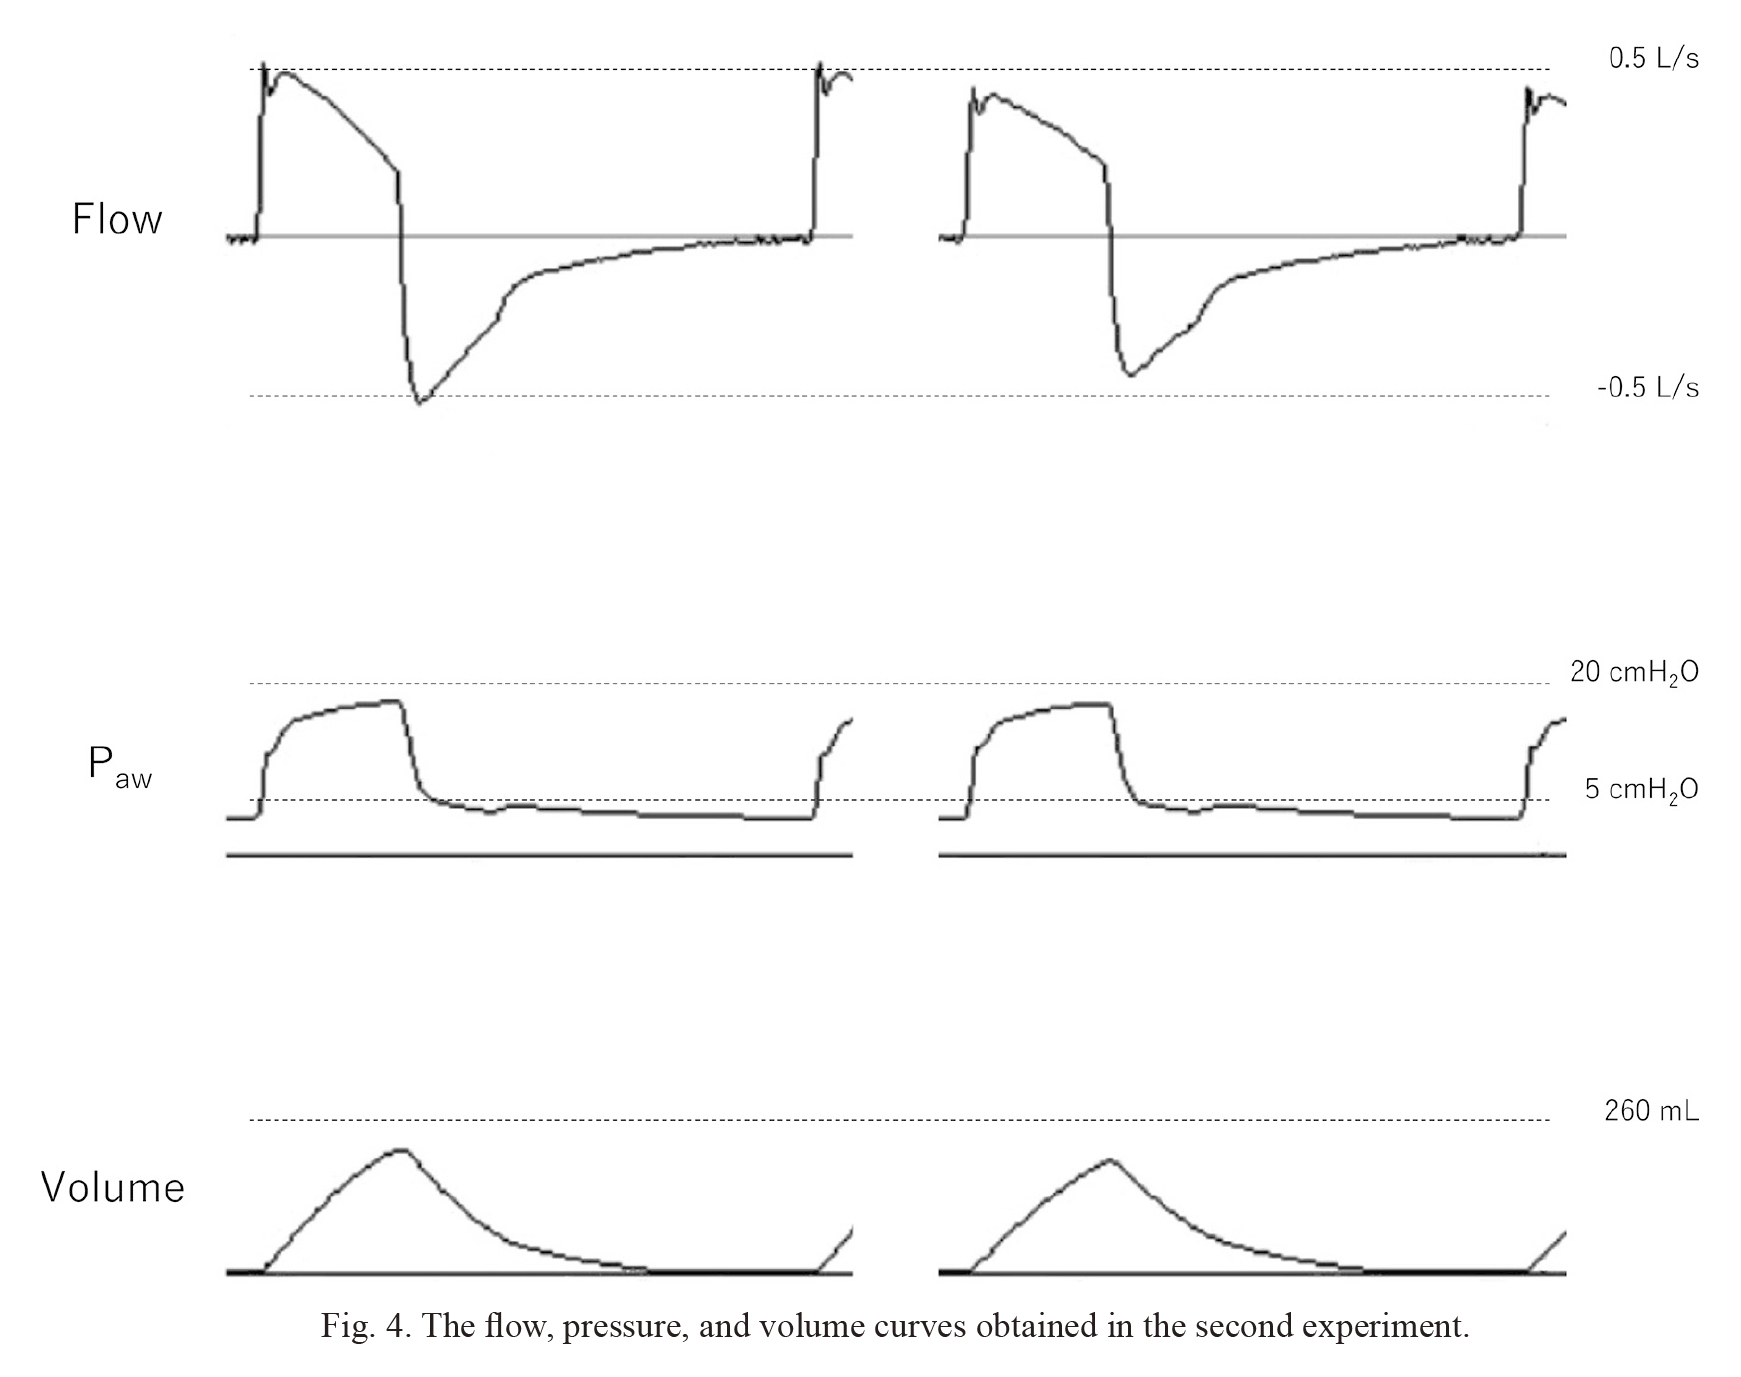
Fig. 4 shows the flow rate, pressure, and volume curves of 95% oxygen and 85% oxygen + 10% desflurane under the R50 setting. Moreover, the peak flow rate of 95% oxygen was higher than that of 85% oxygen + 10% desflurane, whereas the pressure curves were almost the same.
Clinical study
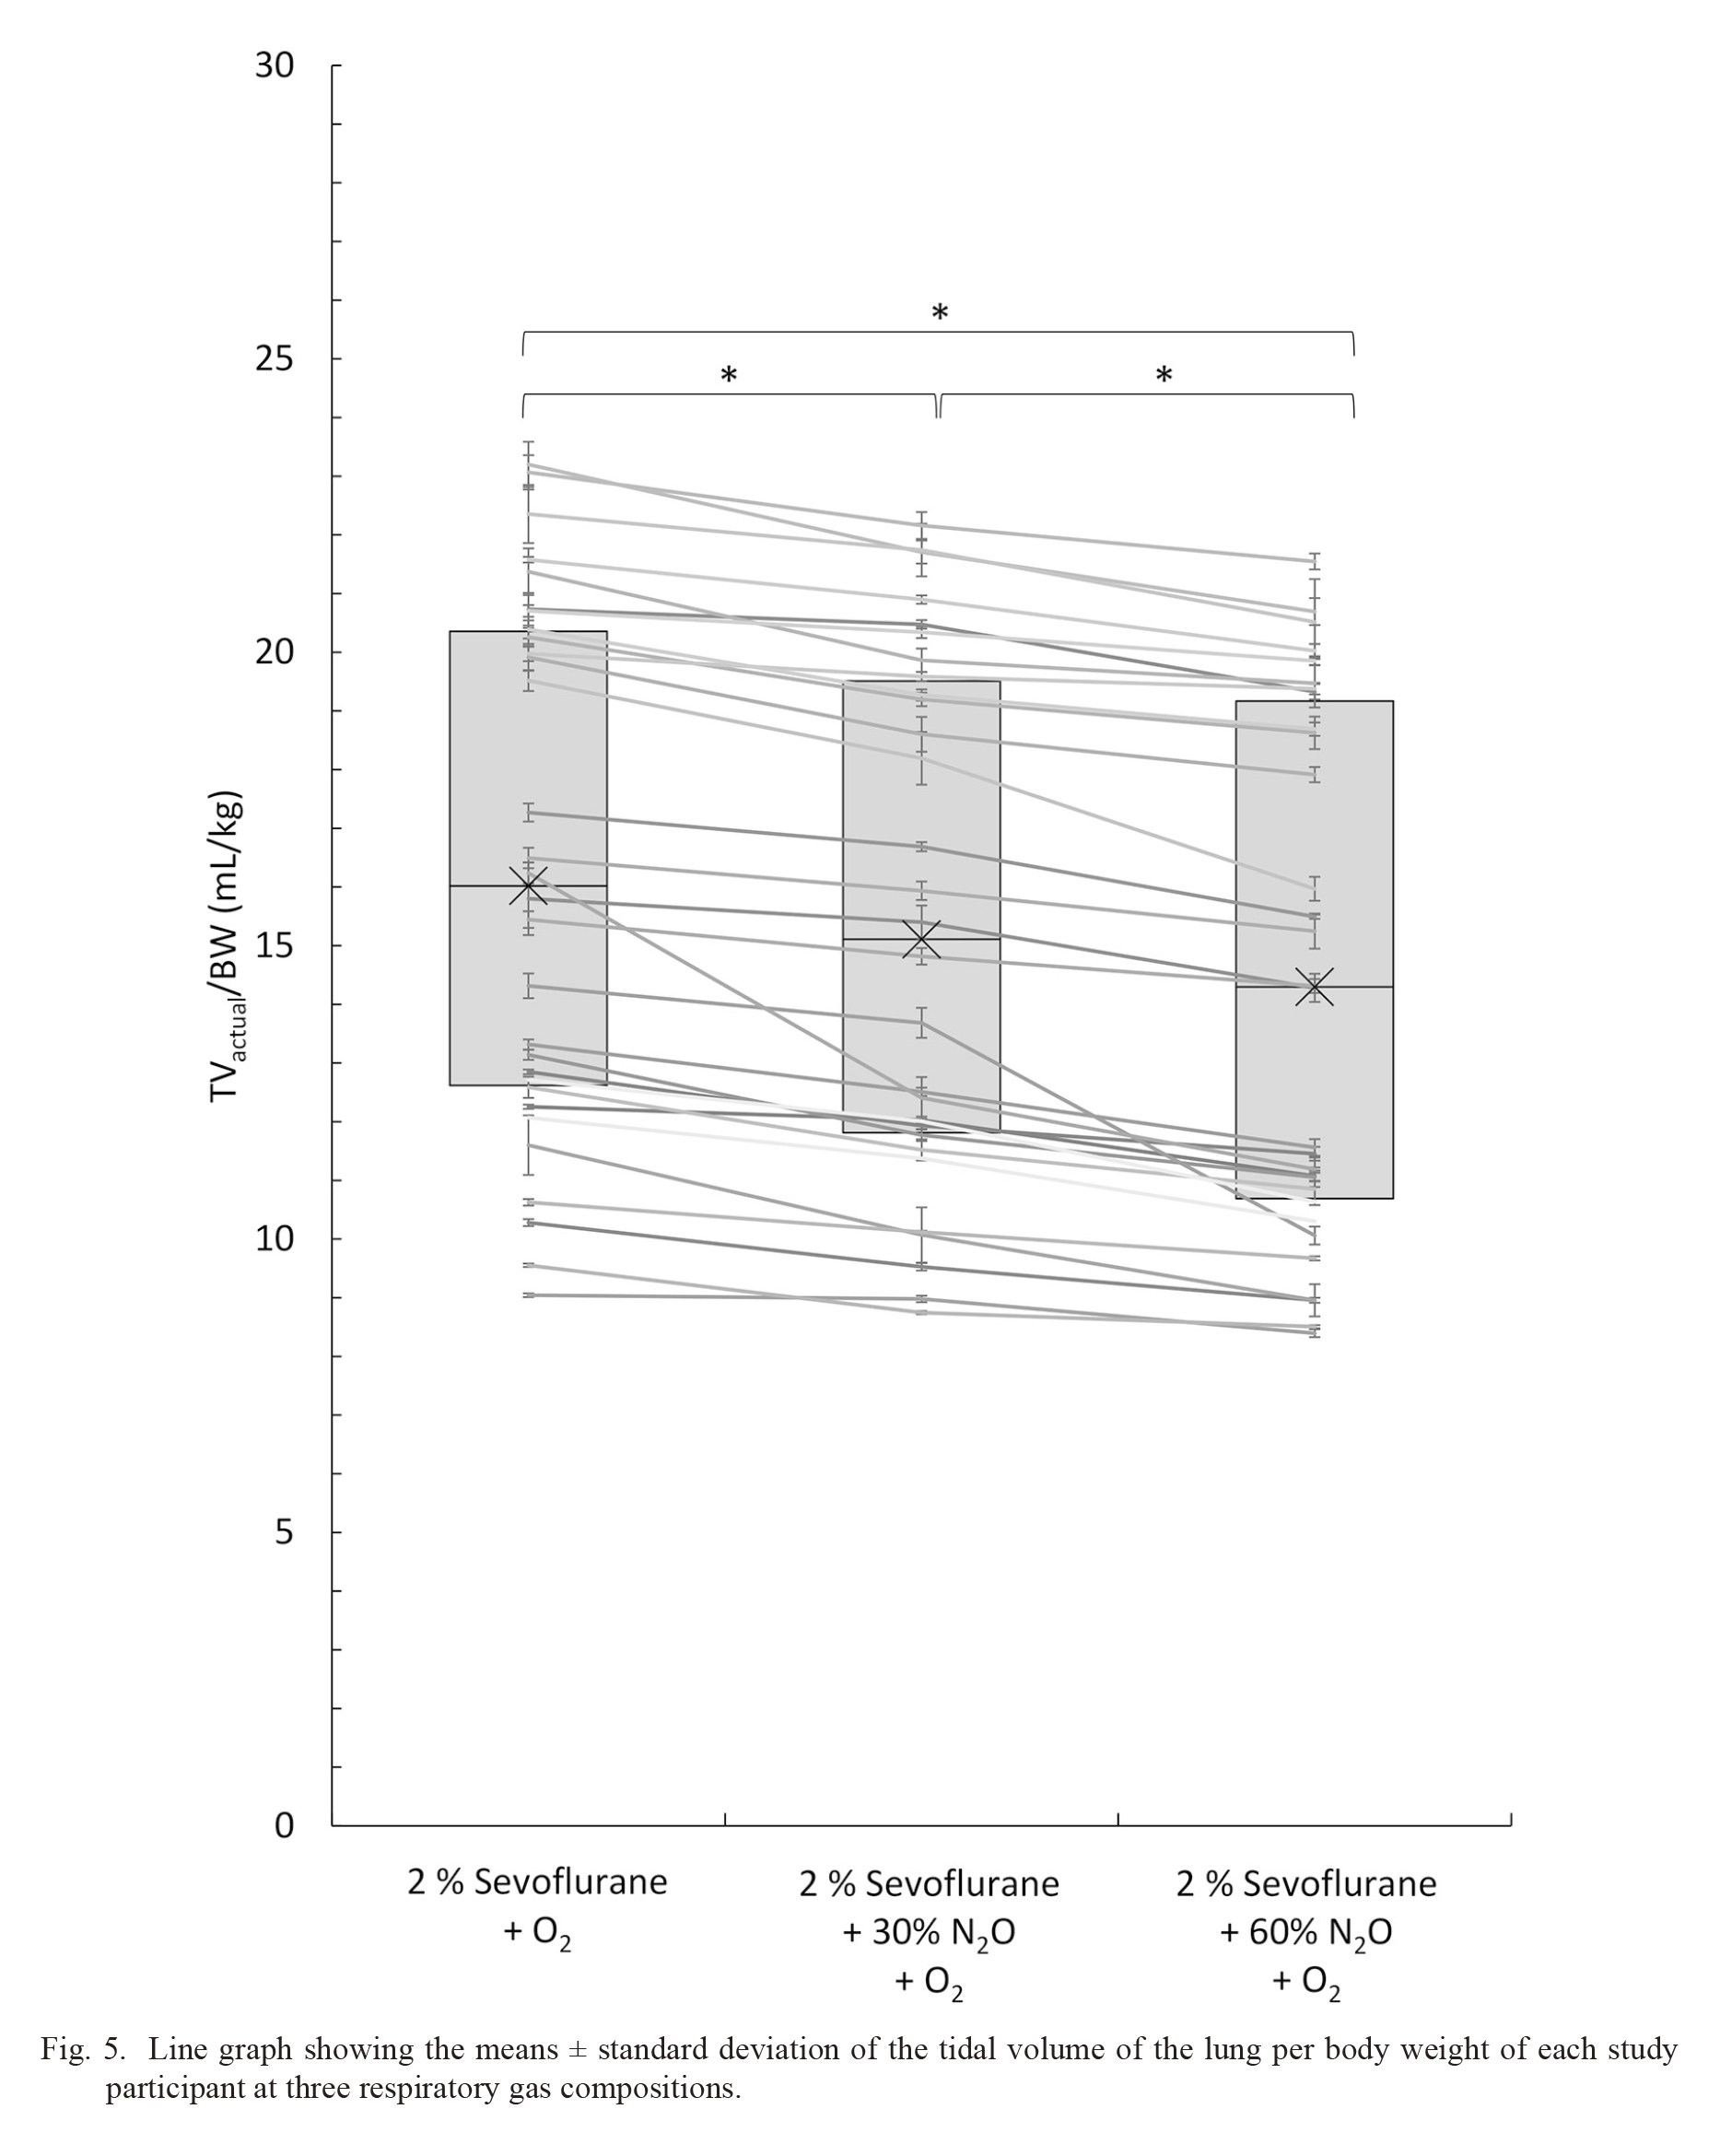
During the study period, 30 pediatric patients were included, and respiratory data in three respiratory gas compositions were obtained from all patients. Patient characteristics are summarized in Table 4. Fig. 5 shows the mean TVactual/BW of each case. Table 4 shows the median value and interquartile range of the 30 cases in three different respiratory gas compositions. Wilcoxon signed-rank test showed that there were significant differences in TVactual/BW between each pair of the three respiratory gas compositions (P < 0.0001).
Discussion
This study aimed to verify the physical mechanism by which the TV of the lung changes in response to the respiratory gas composition change under the same PCV setting and clarify the degree of the impact of this phenomenon in clinical settings. Our results indicate two important findings. The true TV of the lung decreased with an increase in respiratory gas density under the same PCV setting in clinical and laboratory settings. In addition, the TV measured by the pneumotachometer of the anesthesia machine without a compensating system (TVAvance) differed from the true TV of the lung (TVactual) in most cases.
Respiratory gas requires a pressure gradient (PG) to flow in a breathing circuit due to friction and turbulence. In the inspiratory phase, a ventilator set in the PCV mode provides flow to the respiratory circuit and increases the airway pressure at the set inspiratory pressure level. When the ventilator observes greater PG during the inspiratory phase, it regulates flow to prevent exceeding the airway pressure beyond the set limit. Based on Bernoulli’s principle, the pressure generated by the ventilator (Pvent) is divided into the pressure inflating the test lung (Plung) and the pressure used for flowing (ΔE), expressed as follows:
Pvent = ΔE + Plung ··· (1)
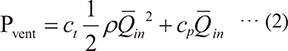
In the inspiratory phase, this formula can be transcribed as follows:

Where ct denotes the mean dimensionless loss coefficient during the inspiratory phase, cp indicates the elastance coefficient of the test lung during the inspiratory phase, ρ denotes the respiratory gas density, and  in indicates the mean inspiratory volume flow rate. Imputing our laboratory experiment results to formula (2), ct and cp in the R0 setting were derived as 1929224441 and 3782709, respectively, and ct and cp in the R50 setting were derived as 17240020431 and 2945448, respectively (see appendix 1 for a more detailed explanation). Subsequently, we calculated the proportions of ΔE and Plung in Pvent in each condition (Fig. 6). The graphs indicate that a higher-density respiratory gas can generate more PG in the breathing circuit (ΔE) and have less energy for inflating the test lung (Plung). In other words, flow decreased with an increase in respiratory gas density, even if the circuit pressure was maintained at the set inspiratory pressure.
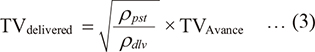
In this study, TV measured by the Avance® and the external flowmeter GF220R® were compared. The anesthesia machine Avance® had no gas sampling module; hence, the gas density compensation function did not work, whereas the compensation function of GF220R® was working during laboratory and clinical studies (Nyktari et al. 2006; Bachiller et al. 2008; Toyama et al. 2011). Thus, the flow measured by the anesthesia machine (QA) is different from the delivered flow (Qdlv) measured by GF220R® because Avance® cannot use the respiratory gas density (ρdlv) to correct the measured values, and instead, use the preset density (ρpst). Consequently, TVAvance (=QA × inspiratory time) deviated from delivered TV (TVdelivered) (=Qdlv × inspiratory time), and the relationship between them is expressed as follows:

This equation explains the difference between TVactual and TVAvance (see appendix 2 for more detailed explanation).
The test lung resistance setting of 50 cmH2O/L/s was used in our laboratory study based on the assumption that the study participants were pediatric patients. Spaeth et al. (2015) demonstrated that a 3.5 mm internal diameter (ID) endotracheal tube shows a non-linear relationship between the flow rate and PG at a gas flow of 0.3 L/s, and PG at this flow rate is approximately 17 cmH2O. This implies that a 3.5 mm ID endotracheal tube has the resistance of 57 cmH2O/L/s at a gas flow of 0.3 L/s, which nearly matches our test lung resistance setting of 50 cmH2O/L/s. The initial flow of approximately 0.5 L/s observed in our laboratory experiment (Fig. 4) indicates that turbulence flow is considered dominant at the initial flow. Therefore, most of the flow in this experiment is considered turbulent, hence, strongly influenced by gas density. In our clinical study, the median TVactual decreased by 10% when the respiratory gas composition was changed from 2% sevoflurane + 93% oxygen to 2% sevoflurane + 60% N2O + 33% oxygen. Meanwhile, the decrease in the flow rate (Q) was estimated at 6.2% from our laboratory study results in the same respiratory gas composition change at 25℃ under the same PCV with the test lung resistance setting of 50 cmH2O/L/s. Comparing these results, true TV change accompanying the respiratory gas composition change can be attributed to the respiratory gas density change. The discrepancy between the clinical and laboratory results might be caused by the change in lung compliance and differences in airway resistance, temperature, and water vapor.
Anesthesia machines with uncompensated flow sensors can cause discrepancies between the measured and delivered TV during volume-controlled ventilation (Bachiller et al. 2008). This could be due to the anesthesia machines supplying reduced inspiratory flow since the inspiratory flow sensor can falsely recognize the reduced inspiratory flow as sufficient due to larger PG caused by higher-density respiratory gas. Subsequently, the expiratory flow sensor can falsely recognize the reduced expiratory TV as sufficient or as having reached the target TV.
This study had several limitations. First, to eliminate the bronchodilation effect caused by anesthetic gases, TV data with other than 2% of sevoflurane were excluded. Therefore, further studies are required to distinguish the density effect from the bronchodilation effect while maintaining constant sedation levels. Second, this study ignored some characteristics of the gas mixture, such as viscosity and interactions of gases, water vapor, body temperature, and the respiratory gas density change caused by the compression of the gas associated with airway pressure increase in the inspiratory phase. Third, we studied only an anesthetic machine with uncompensated flow sensors. In recent years, many machines have implemented different types of flow sensors and compensation systems. Further investigations based on the physical principles, which consider these factors, may demonstrate a more accurate study.
In conclusion, the study results indicated two important findings. First, the true TV of the lung decreases with an increase in the respiratory gas density during fixed PCV. In other words, the addition of relatively higher-density anesthetic gases (e.g., N2O, sevoflurane, and desflurane) can cause a greater PG, and because of that, the gases have less pressure for lung inflation, which is recognized as decreased TV. Second, if the respiratory gas density increases, the TV displayed on a flow analyzer without a calibrating system (often built-in in anesthesia machines) will increase even though the true TV decreases. Although the respiratory gas density clearly impacts the true TV of the lung, this impact has not been popularized. This may be due to many anesthesiologists underestimating the impact of gas density, or the external flow analyzer with a gas density calibrating system is not commonly used in clinical settings due to the cumbersome procedure associated with its use.
Authors Contributions
Conceptualization: Hiroaki Toyama, Yutaro Funahashi, Shin Kawana; Methodology: Kazuhiro Takahashi, Hiroaki Toyama, Yutaka Ejima; Formal analysis and investigation: Kazuhiro Takahashi, Hiroaki Toyama, Kenji Kikuchi, Takuji Ishikawa; Writing - original draft preparation: Kazuhiro Takahashi, Hiroaki Toyama; Supervision: Hiroaki Toyama, Yutaka Ejima, Masanori Yamauchi.
Conflict of Interest
The authors declare no conflict of interest.
Appendix 1
As described in the discussion section, total pressure integrated and controlled by the ventilator (Pvent) is divided into two parts as follows: the pressure inflating the test lung (Plung) and the pressure used for flowing (ΔE). Based on the Bernoulli’s principle, this state is expressed as follows:
Pvent = ΔE + Plung ··· (1)
Here, the Darcy–Weisbach equation expresses the pressure (∆E) using the flow volume, length, and diameter of the circuit, density of the fluid, and flow coefficient. This equation can also be expressed using the mean flow velocity of each section of the breathing circuit, such as the inspiratory limb, Y piece and tracheal tube (Ui), the density of the gas mixture (ρ), and dimensionless loss coefficient of each section ( i) as follows:

The loss coefficient (i) is composed of several factors, including loss of friction and length and diameter of each section. According to formula (a), the density of the gas mixture affects energy loss and circuit characteristics.
Because the volume flow rate (Q) is the product of the mean flow velocity (U) and the cross-sectional area (A) of the breathing circuit (Q = UA), the ΔE during the inspiratory phase of t seconds can be expressed using the formula (a) as follows:

The mean inspiratory volume flow rate is indicated by in and the mean dimensionless loss coefficient during the inspiratory phase of t seconds is indicated by ct. Moreover, the pressure inflating the test lung (Plung) during the inspiratory phase of t seconds is also expressed using the elastance coefficient of a test lung (p) and inspiratory volume flow rate (Qin) as follows:

The above equation can be integrated over the inspiratory phase of 1 s and expressed using the elastance coefficient of the test lung during the inspiratory phase (cp) and mean inspiratory volume flow rate (in) as follows:

Therefore, the formula (1) in the inspiratory phase can be transcribed as follows:
Since the ventilator of an anesthesia machine with PCV mode regulates inspiratory flow to maintain the airway pressure at the set limit using the built-in flow sensor (= Pvent), when the flow sensor detects greater PG caused by a higher-density gas, the ventilator would provide lower flow, which could result in lower delivered TV. For this reason, the following formula relating to different gas densities (ρ1, ρ2) can be established.

At densities of 1.21 kg/m3 (95% air + 5% CO2) and 2.27 kg/m3 (30% oxygen + 53% N2O + 12% desflurane + 5% CO2), the TVactual in the R0 setting and inspiratory pressure of 15 cmH2O (= 1471 Pa) are substituted for ρ1, ρ2, Q1, Q2, and Pvent, respectively, then ct and cp are derived as 1929224441 and 3782709, respectively. Following the same procedure, ct and cp are derived as 17240020431 and 2945448, respectively in the R50 setting. Subsequently, assigning ρ and TV (Q) of each respiratory gas composition to formula (2), the result revealed that the integrated pressure is almost the same regardless of the respiratory gas composition (Fig. 6). In other words, a higher-density respiratory gas can generate more PG in the breathing circuit and have less energy for inflating the test lung.
Appendix 2
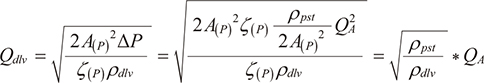
This section explains how pressure gradient, density and flow rate relate in differential pressure flowmeters, and the cause of the observed difference between TVactual and TVAvance. There are roughly two types of differential pressure flowmeters used in clinical practice, namely fixed or variable orifice differential pressure flowmeter. Fixed type is used in GF220R®, and variable type is in Avance®. In both differential pressure flowmeter measures, following formula is used to measure the flow rate:

where ∆P is the pressure gradient measured at the orifice, ρ is the density of the flowing gas, A(P) is the cross-sectional area of the orifice. The compensation coefficient is indicated by ζ(P). Both A(P) and ζ(P) are function of P. This formula means ρ is essential to estimate Q. Here, anesthesia machines without gas module, including Avance®, cannot use the respiratory gas density (ρdlv) to correct the measured values, and instead, use the preset density (ρpat). Thus, during ventilation with the gas density of ρdlv, the relationship between delivered flow (Qdlv) and the flow measured by the anesthesia machine (QA) can be expressed by the following equation:
Also, TVdelivered (=Qdlv×inspiratory time) and the TVAvance (=QA×inspiratory time) can be expressed by the following equation:
This equations explains that regardless of the orifice type, difference between the TVactual and TVAvance depends on whether respiratory gas density is available or not.
References
-
Bachiller,
P.R.,
McDonough,
J.M. &
Feldman,
J.M.
(2008) Do new anesthesia ventilators deliver small tidal volumes accurately during volume-controlled ventilation? Anesth. Analg., 106, 1392-1400.
-
Goff,
M.J.,
Arain,
S.R.,
Ficke,
D.J.,
Uhrich,
T.D. &
Ebert,
T.J.
(2000) Absence of bronchodilation during desflurane anesthesia: a comparison to sevoflurane and thiopental. Anesthesiology, 93, 404-408.
-
Habre,
W.,
Asztalos,
T.,
Sly,
P.D. &
Petak,
F.
(2001) Viscosity and density of common anaesthetic gases: implications for flow measurements. Br. J. Anaesth., 87, 602-607.
-
Miyaji,
T.,
Fukakura,
Y.,
Usuda,
Y.,
Maruyama,
K.,
Hirabayashi,
G.,
Yamada,
R.,
Akihisa,
Y.,
Nishioka,
H. &
Andoh,
T.
(2015) Effects of gas composition on the delivered tidal volume of the Avance Carestation. J. Anesth., 29, 690-695.
-
Mondoñedo,
J.R.,
Herrmann,
J.,
McNeil,
J.S. &
Kaczka,
D.W.
(2017) Comparison of pneumotachography and anemometery for flow measurement during mechanical ventilation with volatile anesthetics. J. Clin. Monit. Comput., 31, 1263-1271.
-
Nyktari,
V.,
Papaioannou,
A.,
Volakakis,
N.,
Lappa,
A.,
Margaritsanaki,
P. &
Askitopoulou,
H.
(2011) Respiratory resistance during anaesthesia with isoflurane, sevoflurane, and desflurane: a randomized clinical trial. Br. J. Anaesth., 107, 454-461.
-
Nyktari,
V.G.,
Papaioannou,
A.A.,
Prinianakis,
G.,
Mamidakis,
E.G.,
Georgopoulos,
D. &
Askitopoulou,
H.
(2006) Effect of the physical properties of isoflurane, sevoflurane, and desflurane on pulmonary resistance in a laboratory lung model. Anesthesiology, 104, 1202-1207.
-
Spaeth,
J.,
Steinmann,
D.,
Kaltofen,
H.,
Guttmann,
J. &
Schumann,
S.
(2015) The pressure drop across the endotracheal tube in mechanically ventilated pediatric patients. Paediatr. Anaesth., 25, 413-420.
-
Toyama,
H.,
Endo,
Y.,
Ejima,
Y.,
Matsubara,
M. &
Kurosawa,
S.
(2011) Comparison of actual tidal volume in neonatal lung model volume control ventilation using three ventilators. Anaesth. Intensive Care, 39, 599-606.