Abstract
Russia’s invasion of Ukraine (February 24, 2022) has begun and there are concerns about the impact on health care supply and mental health. This study analyzed tweets in the Ukrainian language to capture the medical needs and mental health conditions in wartime Ukraine by focusing on ostensibly relevant words. The number of tweets containing the keywords and their overall proportion was compared before and after the Russian invasion of Ukraine. The survey period was divided into four phases—the pre-2022 Russian invasion, acute phase (4 weeks), subacute phase (12 weeks), and the chronic phase (8 weeks) up to August 10, 2022. The analysis targeted tweets sent in Ukrainian. The tweets were screened using a set of six classes with 75 key groups and 303 Ukrainian (204 original Japanese) keywords. Overall, 98,526,440 tweets were analyzed, with a pre-invasion and post-onset average of 1,096,976 and 3,328,243 tweets/week (a 3.0-fold increase), respectively. Of these, 3,197,443 tweets contained the keywords, with a pre-invasion and invasion average of 26,241 and 114,640 tweets/week (a 4.4-fold increase), respectively. The post-onset phase witnessed a considerable increase in all classes—medical services, treatment, medical resources, medical situations, and special situations—but not in the symptom class. Keywords related to psychological distress and anxiety immediately increased during the acute phase; those related to depression and post-traumatic stress reactions continued increasing as the invasion persisted, which may have reflected the mental state of those impacted. Analyzing tweets is useful for predicting people’s real-time physical and mental health needs during wartime.
Introduction
On February 24, 2022, the Russian government launched a “special military operation.” On the same day, military operations began throughout Ukraine, including in the vicinity of the Ukrainian capital, Kiev (Russian Ministry of Foreign Affairs 2022). The two countries have been engaged in a series of confrontations and conflicts, beginning in the Donbass region of southeastern Ukraine, including the annexation of the Crimean Peninsula in 2014; as of the end of October 2022, military operations are still ongoing. This military conflict has predominantly been fought inside Ukraine. Ukrainian citizens are exposed to daily threats to their lives, including shelling (Adams et al. 2022). A human-induced hazard is similar to sudden-onset natural hazards; the 2022 Russian invasion clearly created a different environment—a disaster. Concerns exist regarding the impact on the medical supply and mental health, and the sustainability of daily life (Patel and Erickson 2022; Awuah et al. 2022).
Life-threatening events—natural hazards, wars, accidents, crimes, and abuse—trigger acute stress reactions that precipitate the development of post-traumatic stress disorder (PTSD). Numerous mental health surveys and research projects have examined past disasters caused by natural hazards and chemical, biological, radiological, nuclear, and high-yield explosive hazards, including nuclear accidents, terrorism, and the coronavirus disease 2019 (COVID-19) pandemic. Mental health status during disasters has been reported both in cross-sectional assessments at varying stages of disaster using various rating scales, and in terms of changes over time and long-term prognosis (Hoppen and Morina 2019; Blackmore et al. 2020; Kunii et al. 2022a, b; Mesa-Vieira et al. 2022).
PTSD was originally identified from research on Vietnamese veterans; war experience was the most representative event in the onset of PTSD. Numerous studies have examined mental health in wars and conflicts (Murthy and Lakshminarayana 2006; Jain et al. 2022), including studies with military personnel and soldiers, and with refugees from combat zones and internally displaced persons (IDPs), respectively. Multiple meta-analyses have studied refugees and IDPs (Hoppen and Morina 2019; Blackmore et al. 2020; Mesa-Vieira et al. 2022), revealing a high prevalence of psychiatric disorders, including PTSD (23.8-31.5%), major depressive disorder (23.4-31.5%), and anxiety disorders (11-14%), suggesting that war significantly impacts mental health. However, these studies have been limited to post-event surveys; no studies have investigated real-time mental health status during wartime.
In the current situation in Ukraine, limited information is available regarding the remaining residents’ mental health. However, considering neighboring countries’ psychological responses, with surveys of adults in non-Ukrainian countries (Moshagen and Hilbig 2022)—such as Germany, the United Kingdom, Poland, and the United States—reporting high anxiety, anger, and threat levels; and surveys of university students in the Czech Republic (Riad et al. 2022) reporting high anxiety and depression levels, the impact on Ukrainian citizens’ mental health is most likely serious.
The challenge is applying the advances in information communication technology (ICT) in disaster response. During the COVID-19 pandemic, ICT was used in Japan and also worldwide, with smartphones being used for digitalization of vaccination certificates, contact tracing, and managing the physical conditions of those in close contact with COVID-19 patients (Fujii et al. 2021).
In this situation in Ukraine, the measurement of physical and mental health damage would certainly be useful for relief and future reconstruction assistance. Simultaneously, wartime is a special and extreme situation. Therefore, conducting a research survey in such circumstances is an ethical issue and also poses technical difficulties in administering the survey while ensuring the investigators’ safety. Research using social network services (SNS) may help address this particular problem (Arthur et al. 2018; Bennett 2018; Anderson 2021; Babvey et al. 2021). Numerous studies have used tweet analysis to evaluate the Great East Japan Earthquake (Jung and Moro 2014; Takayasu et al. 2015; Aoki et al. 2018). Studies have suggested that negative tweets increase immediately after a disaster and decrease over time (Miura et al. 2015), and tweets during a disaster may help reduce psychological stress (Umihara and Nishikitani 2013).
Per studies on COVID-19, people use SNS to obtain information on vaccination and other topics, and the accuracy of such information resources is important to promote vaccination. One study evaluated the accuracy of tweet information (Skafle et al. 2022). Another study examined the natural language processing of tweet content and analyzed emotions such as “anger” to predict people’s aggression under lockdown with the objective of preventing the spread of infection (Hsu and Tsai 2022).
Per a study on the 2022 Russian invasion of Ukraine, the frequency of following the news and social media use was associated with higher levels of anxiety and depressive symptoms (Riad et al. 2022), suggesting that the use of social media, including SNS, is useful for sharing valuable information during disasters and also for realizing mental status.
Therefore, the tweet analysis of Ukrainians’ life, medical environment, and physical and mental health conditions from outside Ukraine would be useful to assist those who suffered from the disaster and support reconstruction following Russia’s invasion. Along with solving the difficulties of using surveys during wartime, it could also be useful during sudden-onset disasters.
This study used keywords in the Ukrainian language, presumably relevant to the medical and public health environment, medical needs, and mental health conditions. We surveyed the tweets in Ukrainian that were presumably sent from within Ukraine to check if they contained these keywords.
Before and after the Russian invasion of Ukraine, the number of tweets containing the keyword and its percentage in the total number of tweets was analyzed to assess the medical environment, medical needs, and mental health conditions in Ukraine under wartime conditions.
Materials and Methods
Phases and targets
The Russian invasion began on February 24, 2022—the starting point. The survey period, centered on February 24, 2022, was divided into two parts: the pre-2022 Russian invasion phase (17 weeks) starting from November 1, 2021; and the study period, which runs from the start of the invasion until August 10, 2022, though the war is still ongoing. Furthermore, the invasion phase was divided into the acute phase for four weeks from the date of invasion, the subacute phase for the following 12 weeks, and the chronic phase for eight weeks.
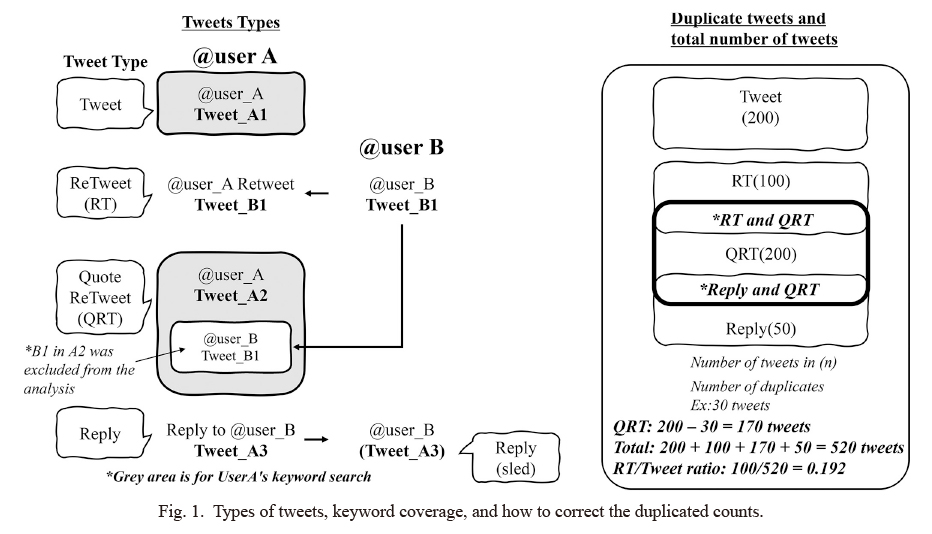
The analysis targeted tweets sent from Twitter services in Ukrainian during the study period. Tweets containing the target keywords were counted for each week and each phase, and tweets were categorized as tweets, retweets (RTs), replies, and quote-retweets (QRTs) to exclude the truly duplicated ones (Fig. 1).
As the tweets’ location (account registration’s location) could be obtained, all tweets in the Ukrainian language were included as tweets among people in wartime situations.
Keyword setting in the Japanese language and conversion to the Ukrainian language
As the keywords to be searched have multiple expressions and notations for the same meaning, multiple similar expressions were prepared in Japanese for each keyword to create a keyword group (hereinafter referred to as KeyGrp) in the Ukrainian language; similar keywords were not duplicated between the KeyGrps (Keyword List: Supplementary Tables S1 and S2).
Even if there were multiple similar expressions belonging to the same KeyGrp in a tweet, the number of KeyGrps to be counted was one. However, if there were keywords with different KeyGrps in a tweet, each KeyGrp was counted. For quotations and replies, the original tweet was not counted for keyword analysis (Fig. 1).
The KeyGrps were divided into six classes—“medical service,” “symptom,” “treatment,” “medical situation,” “special situation,” and “mental health”—in the Japanese language for better design among Japanese researchers and for future application to possible disasters in Japan.
The “medical service” class included nine KeyGrps: medicine, antidiabetic agent, anti-hypertensive, medical treatment, surgery, injection, drawing blood, clinical examination, and image inspection. The “symptom” class included ten KeyGrps: fever, headache, stomachache, vomit, toothache, diarrhea, cough, runny nose, chilblains, and burn. The “treatment” class included ten KeyGrps: sick, injury, bleeding, stop bleeding, fracture, cast, medical procedures, cardiopulmonary resuscitation, hypothermia, and childbirth. The “medical resource/medical situation” class included ten KeyGrps: hospital, doctor, nurse, pharmacist, patient, pregnant woman, newborn baby, older people, disabled person, and child. The “special situation” class included ten KeyGrps: explosion, fire, accident, rape, violence, burial, death, incident, theft, and disaster.
The KeyGrps in the “mental health” class were extracted from five categories that included mental symptoms and mental status and were considered susceptible after a disaster: psychological distress, depression, anxiety, post-traumatic stress response (PTSR), and resilience, which have also been frequently examined in previous disasters (Kunii et al. 2022a, b). The number of KeyGrps belonging to each of the above categories was five for psychological distress, ten for depression, five for anxiety, 18 for PTSR, and one for resilience; however, excluding those that overlapped among the categories, 26 KeyGrps were set in the “mental health” class. Along with the international diagnostic criteria for mental disorders, several questionnaires were referenced to select the keywords and set the KeyGrps related to psychological distress, depression, anxiety, PTSR, and resilience.
Overall, six classes, 75 KeyGrps, and 204 keywords were set in Japanese. The keywords were converted from Japanese to 308 Ukrainian keywords by native Ukrainians who could interpret Japanese (Supplementary Table S1).
Aggregation method
The tweet counts were obtained from Google Apps Script (GAS) installed on a Google Spreadsheet using the Twitter application programming interface (API). Full-archive tweet counts were accessed with academic research privilege. As some quoted retweets (QRTs) were also retweets or replies, duplicated QRTs were excluded to obtain the logical total number of QRTs (Fig. 1).
Statistical analysis methods
The analysis was based on the total number of tweets in Ukrainian (population) and the χ-square test in a 2 × 4 table, with the number of detections per KeyGrps in each of the four phases. We created categories based on the number of tweets that included and did not include keywords in each phase. As we did not investigate whether tweets from the same account increased or decreased in each phase and because tweets from accounts that were not in use before the pre-2022 Russian invasion were included, we created categories based on the number of tweets that included and did not include keywords in each phase. The weekly average number of transmissions in each phase, as well as the fold-increase compared to the pre-2022 Russian invasion average, were calculated to verify the increase or decrease for each KeyGrp. In the mental health KeyGrp, we examined each of the five categories of mental health status listed above. Statistical analysis was conducted using StatFlex Ver. 6.0 (Windows version) from the Institute of Medical Statistics (Ube, Japan).
Limitation
As Twitter cannot obtain the location of the tweets, we assumed that tweets in the Ukrainian language were the target tweets, but it does not ensure that the tweet was sent out in Ukraine during the war. The count of each KeyGrp was based on the number of matched words, and determining how the keywords were used and the context of affirmation/negation was impossible. This was handled by employing native Ukrainian translators and reflecting Ukrainians’ unique phrases in keywords. The total number of converted Ukrainian keywords was 303, compared with the original Japanese 204 keywords. This approach enabled us to consider the context to some extent, but it remains presumable.
As the sender’s property was not accessible, determining whether the tweet was sent by a news organization or a person was impossible. This was partly estimated by analyzing the relationship between the types of tweets (e.g., the relationship between the number of tweets and number of retweets for the purpose of diffusion). The tweet content’s accuracy has not yet been evaluated. Although some of the tweets were, undeniably, fake or intended for the purpose of manipulation or intervention, all the tweets were included and analyzed.
Results
Trends in overall tweets
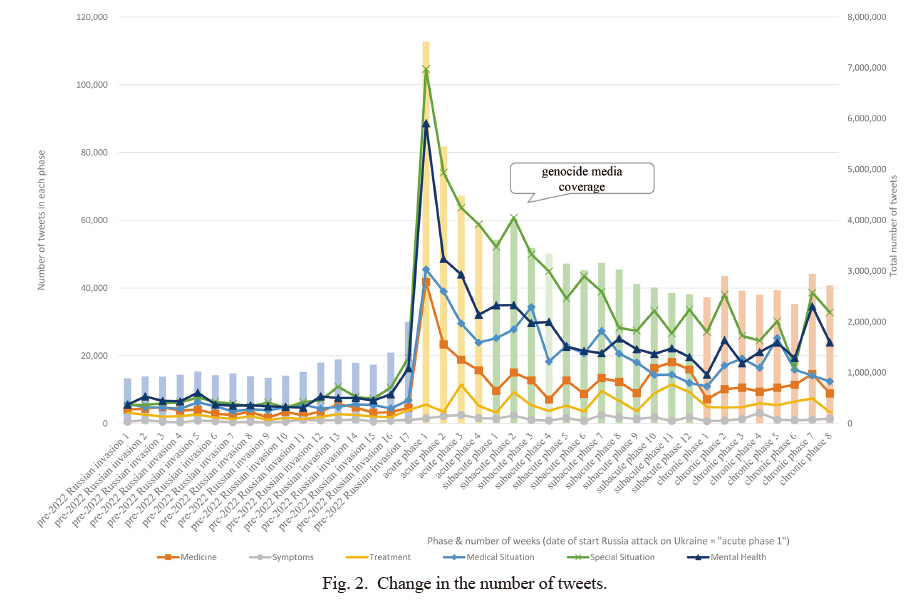
The total number of tweets in Ukrainian during the study period was 98,526,440, with a pre-invasion average of 1,096,976/week and an invasion phase average of 3,328,243/week with a 3.034-fold-increase (Table 1). Of these, the total number of tweets containing some keywords was 3,197,443, with a pre-invasion average of 26,241 and an invasion phase average of 114,640/week with a 4.368-fold increase. The number of tweets increased significantly within the first week of the invasion and decreased gradually over time, but remained significantly higher than in the pre-invasion phase throughout the study period (Fig. 2).
Changes by class
The results for each keyword class revealed that the weekly average number of tweets increased in each class after the invasion compared with the pre-2022 Russian invasion phase. (Table 1, Fig. 2). The most remarkable “special situation” class indicated a high sending rate, which was 2.05-fold higher in the acute phase, 1.85-fold higher in the subacute phase, and 1.60-fold higher in the chronic phase than in the pre-2022 Russian invasion phase, suggesting that the respondents sought information about the damage caused by the invasion. The “medical situation” class was 1.42-fold higher in the acute phase, increased in the sub-acute phase (1.51-fold), and remained high in the chronic phase (1.36-fold). The “medical service” class was high during the acute phase (1.38-fold) but gradually declined to a relatively flat level of 1.20-fold in the subacute phase and 1.16-fold in the chronic phase. In the “treatment” class, the ratio in the acute phase fell below the pre-2022 Russian invasion phase (0.6-fold) and remained at the same level as pre-2022 Russian invasion phase thereafter (1.07-1.02-fold). The weekly average number of tweets in the “symptom” class increased after the invasion, but because of the increase in the total number of tweets, the percentage decreased in all phases after the invasion: acute phase (0.553), subacute phase (0.743), and chronic phase (0.767) compared to the pre-invasion (1.000).
Ratio of tweets to retweets, quotes, and replies (tweets/RT ratio)
In Twitter use, retweeting (hereinafter RT) is used to spread information news. In this study, we did not identify whether the tweeter was an official account of a news organization or an individual. Instead, we compared the ratio of the number of tweets to the quotes, replies, and RTs (RT/tweets ratio) in acute, subacute, and chronic phases compared to the pre-invasion phase. Because we assumed that a low RT/tweets ratio suggests more personal communication, and a high RT/tweets ratio suggests that the tweets from news organizations were more retweeted for diffusion purposes.
The tweets/RT ratios related to medical demand were high: 44.491-fold higher in the acute phase of “antidiabetic agent,” 37.333-fold higher in the acute phase of “drawing blood,” and 17.250 to 5.369-fold higher in each “childbirth” phase. RTs related to the living environment and weather were also high, such as “hypothermia,” (57.102-fold in the subacute phase) and “chilblains” (46.382-fold in the subacute phase).
RTs in the “medical resource/medical situation” class were high for “hospital” (16.747-4.449-fold in the acute phase), “child” (8.332-3.017-fold), and “newborn baby” (8.793-5.612-fold). However, the “mental health” class indicated “suicidal ideation,” a 19.5-fold increase in the chronic phase, but no other ratios were particularly noteworthy suggesting that most mental health class tweets other than the “suicidal ideation” KeyGrp were tweeted more personally rather than by news organizations (data not presented).
KeyGrps in each class other than “mental health”
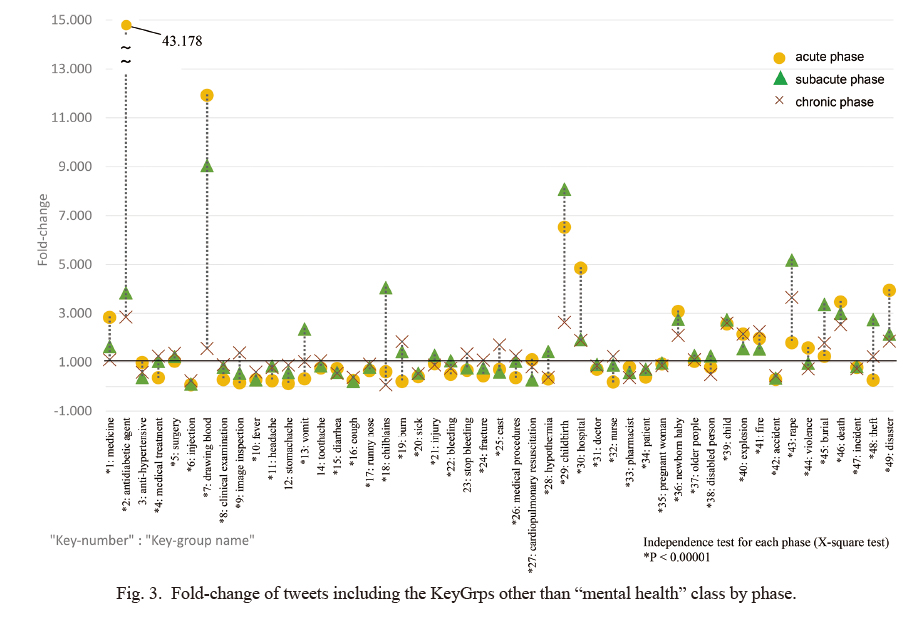
Fig. 3 depicts the longitudinal trend of the weekly average tweet percentage of each KeyGrps compared to the pre-invasion phase (fold-increase). The percentage of tweets containing the keyword “antidiabetic agent” in the “medical service” class during the acute phase was 43.178-fold (subacute: 3.840-fold, chronic: 2.844-fold). The acute phase “drawing blood” was 11.921-fold (subacute: 9.047-fold, chronic: 1.566-fold). The acute stage “hospital” in the “medical resource/medical situation” class was 4.848-fold. The acute stage “newborn baby” was 3.075-fold higher. The rate for the subacute stage “child” was 2.731-fold.
In the subacute phase, “childbirth” in the “treatment” class was 8.081-fold higher (6.524-fold higher in the acute stage and 2.628-fold higher in the chronic stage). However, “injection” in the “medical service” class was 0.239-fold in the chronic phase, and “cough” in the “symptoms” class was 0.380-fold in the chronic phase. Some of these values significantly decreased.
In the “special situation” class, “rape” in the sub-acute phase was 5.179-fold (chronic phase: 3.649-fold). Subacute “burial” was 3.362-fold, and “death” was 3.462-fold higher in the acute phase (3.006-fold higher in the subacute phase and 2.533-fold higher in the chronic phase). The acute phase “disaster” was also high at 3.941-fold.
The variation in the percentage of tweets containing the keyword in the average weekly number of tweets in each phase was examined. The number of KeyGrps with a variation greater than 1 was seven, with 21 KeyGrps between 0.3 and 1, and 21 KeyGrps being less than 0.3. The KeyGrps were divided into those with a large phase variation and those with no phase variation. The number of KeyGrps with the highest variation in the pre-2022 Russian-invasion phase was 16, 9 in the acute phase, 12 in the subacute phase, and 12 in the chronic phase, indicating that the ratio did not necessarily increase in the acute phase.
Those with large phase variations included “antidiabetic agent,” “drawing blood,” “childbirth,” “chilblains,” “rape,” and “theft.” No significant differences were detected for “stomachache” and “stop bleeding.” This does not imply that no demand existed for these keywords, but these keywords were, possibly, inappropriate in the actual situation.
KeyGrps in the “mental health” class
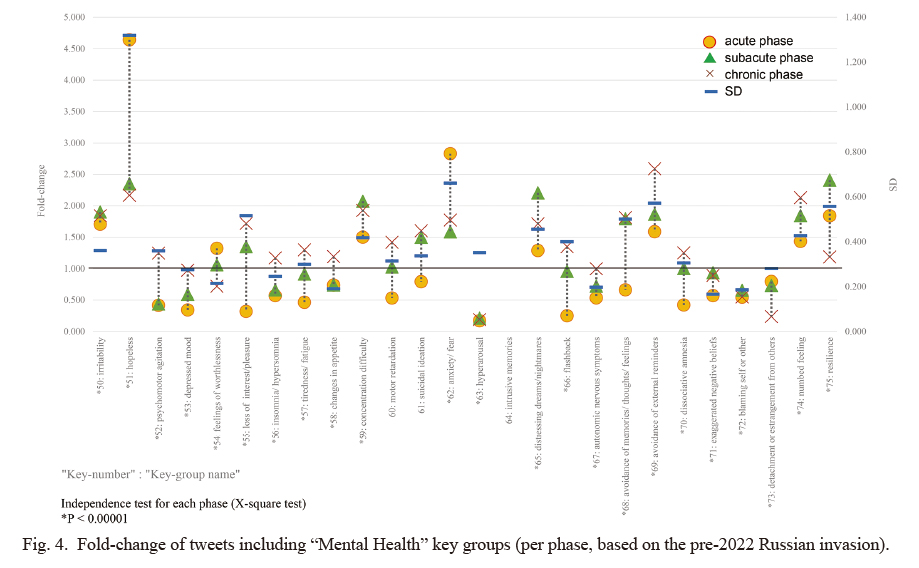
Fig. 4 presents the trends of 26 KeyGrps in the “mental health” class fold-increase in each phase compared to the pre-invasion ratio. The KeyGrps that revealed particularly high ratios were 4.64-fold higher in the acute phase for “hopeless,” 2.83-fold higher in the acute phase for “anxiety/fear,” and 2.58-fold higher in the chronic phase for “avoidance of external reminders.” The highest ratio of “hopeless” was observed in the acute period immediately after the invasion, but it remained high in both the subacute and chronic periods, at 2.35 and 2.16-fold, respectively.
The 26 KeyGrps for mental health also differed during the period when the ratio of outgoing messages was high. When the ratio of the pre-2022 Russian invasion was 1, the three KeyGrps with the highest ratio in the acute phase were “hopeless,” “feelings of worthlessness,” and “anxiety/fear”. Similarly, the four KeyGrp items with the highest ratio in the subacute phase were “irritability,” “concentration difficulty,” “distressing dreams/nightmares,” and “resilience.” The eleven KeyGrp items with the highest ratio in the chronic phase were “psychomotor agitation,” “loss of interest/pleasure,” “insomnia/hypersomnia,” “tiredness/fatigue,” “changes in appetite,” “motor retardation” (p = 0.001), “flashback,” “avoidance of memories/thoughts/feelings,” “avoidance of external reminders,” “dissociative amnesia” and “numbed feeling.” The highest rates were observed during peacetime for the following six items, namely, the KeyGrps “depressed mood,” “hyperarousal,” “autonomic nervous symptoms,” “exacerbated negative beliefs,” “blaming self or others,” “detachment or estrangement from others,” and decreased in all phases of the post-onset. No significant differences were found in “intrusive memories” and “suicidal ideation” in each phase.
The average weekly number of tweets for each phase in each of the five mental state categories and the ratio with pre-2022 Russian invasion as 1 were tabulated (Fig. 5).
The ratios of “psychological distress,” and “anxiety” categories indicated a similar trend, with scores increasing during the acute phase and remaining the same during the subacute and chronic phases. The ratio of the category “depression” temporarily decreased to 0.55-fold in the acute phase and 0.85-fold in the subacute phase after the invasion, but increased to 1.23-fold in the chronic phase over time to a higher ratio than in the pre-2022 Russian invasion phase.
The ratio of “PTSR” was 1.41-fold higher in the acute phase, 1.20-fold higher in the subacute phase, and 1.26-fold higher in the chronic phase, revealing no significant variation among the phases, but the ratio was higher than during the pre-2022 Russian invasion in all phases. The ratio of “resilience,” the only positive indicator among the KeyGrps selected, increased 1.84-fold in the acute period and 2.40-fold in the subacute period, but decreased significantly to 1.18-fold in the chronic phase after the 13th week.
Discussion
Overall: Can Twitter analysis be a research tool when on-site surveys are difficult
Our current study is the first to utilize Twitter to examine real-time medical demands and mental health status during wartime. Twitter content increased suddenly after the Russian invasion of Ukraine and decreased over time. It may also increase suddenly with some episodes; for example, there was a temporary increase in tweets in the sixth week after the invasion (subacute phase) due to reports of a genocide. It can be inferred that this occurred in response to a major military progress or victim reports. These results indicate that tweets can promptly increase or decrease in response to a situation.
These findings suggest that Twitter analysis can be a solution to the ethical problems of conducting research during wartime, a unique and extreme situation, and for conducting research while ensuring the safety of the researcher. Considering that Twitter analysis has also been used in the case of natural hazard-induced disasters in previous studies, it may be useful for understanding situations when field surveys are difficult.
However, several issues must be addressed. This study responds to keywords but does not make decisions on whether they are positive or negative. Therefore, determining a hospital’s availability is difficult, and although inferring demand is possible, determining whether there is an excess or deficiency is challenging. We suggest that improving the accuracy of demand estimation is possible by conducting natural language processing (Devlin et al. 2018; Mehta and Pandya 2020; Jabalameli et al. 2022) in the native language of the country directly affected to understand the country’s unique wording and other factors.
Results for each class (medical situation and medical treatment demand estimation)
The ratio of each group to the total number of tweets differs for each class. Compared to peacetime, the “medical resource/medical situation,” “medical service,” and “special situation” classes indicated a higher trend in each post-onset phase. This can be inferred from the fact that people seek information not only about crime and war victims but also on the damage to medical resources, such as doctors and hospitals, as well as information regarding medical resources to which they can respond. Moreover, the ratio of KeyGrps “antidiabetic agents” (43-fold) and “medicines” (3-fold) in the acute phase increased, suggesting that medical demand (treatment information) of patients with chronic diseases can also be inferred.
Ratio of tweets to retweets, quotes, and replies
When RT is intended to spread information, it is reasonable to assume that tweets spreading information about medical demand, such as support for chronic diseases, blood transfusions, and recruitment, will be retweeted (spread) more frequently than in the pre-2022 Russian invasion phase. It is also reasonable to assume that RTs of information on frostbite, hypothermia, medical facilities, childbirth, newborns, etc., indicate medical demand and increased awareness. Although identifying the sender’s profile was impossible, tweets from the news organization might have been more retweeted.
Mental health, however, exhibited a weak ratio of RTs, suggesting that it is more likely to be sent among individuals and people they know, suggesting that inferring medical resources, demand, and mental status from the overall number of tweets (the sum of tweets, replies, citations, and retweets) is reasonable and provides a certain degree of accuracy.
Possibility of medical resource and demand estimation
The magnitude of the variation and the highest value of each phase of KeyGrps were responsive to medical demand and living conditions, indicating the possibility that demand can be inferred from these factors. Some of the demand increased rapidly in response to the invasion, some increased because of the expansion or prolongation of the war, and some increased in response to natural phenomena. By comparing the variation, increase or decrease, and percentage of tweets in each of these phases, the accuracy of estimating medical resources and demand could also be improved.
In Ukraine, diabetics are being rescued during wartime (UDF 2022; Tsagkaris et al. 2022). Per the International Diabetes Federation Atlas, in 2021 there will be approximately 2,325,000 people with type 2 diabetes in Ukraine, corresponding to a prevalence of 7.1% (Alessi and Yankiv 2022); for type 1 diabetes, approximately 6,700 children and adolescents have been diagnosed in the past year. These realities, together with the sudden increase immediately after the invasion of diabetes medications (43-fold), the increasing trend of medications in general (2.83-fold), and the fact that the high rate continues until the chronic phase of the disease, suggest that this represents the actual healthcare demands of patients with chronic diseases. From these, “anti-arrhythmic drugs,” “angina pectoris drugs,” “bronchial asthma drugs,” “steroid drugs,” and “anticonvulsants,” which are needed in times of disaster, may be in short supply as well.
However, the demand for medicine is difficult to project to specific quantitative estimates, and only an inference can be made about the possibility of a shortage trend or challenges in obtaining this medicine. Further, many of the tweets for “blood drawing” stands for “blood donation” in blood transfusions, which may suggest the increased demand for blood transfusions (CEPA 2022; WHO 2022; Naumann et al. 2022). This also suggests that it represents the actual situation of medical demand.
The fold-increase of KeyGrps of “newborns (3.075-fold)” and “childbirth (8.081-fold)” suggests that the respondents are worried about perinatal care and are being pressed to cope with such issues (Behboudi-Gandevani et al. 2022). The KeyGrp of “old people” increased by a factor of 1.27-fold (subacute phase), but these keywords were also often tweeted in the pre-2022 Russian invasion, therefore it is difficult to reflect it in the ratio. When considered in conjunction with the absolute number of the KeyGrps of “old people (3.61-fold: subacute phase)” and “child (2.73-fold: subacute phase),” the increase in tweets targeting socially vulnerable groups during the disaster also revealed a noticeable trend. This is another important indicator for estimating medical resources/medical situations and medical demands.
Mental health
Overall, we found that the number of tweets on “mental health” increased in all acute, subacute, and chronic phases compared to pre-invasion. Additionally, 24 of the 26 KeyGrps for the “mental health” class changed in a statistically significant manner between each phase. Thus, it was suggested that fluctuations in mental status occurred during each phase. These fluctuations were not uniform, and there were differences in the phase when the tweet ratio increased, depending on the KeyGrp. Some KeyGrps had fewer tweets during the war than before. There were three KeyGrps with the most tweets in the acute phase, and four KeyGrps with the most tweets in the subacute phase. The number of KeyGrps with the most tweets in the chronic phase was 11. Given this result, it can be assumed that the mental status likely to be expressed differs depending on the phase from the outbreak of the war.
For each category of mental status, the values for “psychological distress” and “anxiety” jumped to about 2.5 folds higher than that of the pre-2022 Russian invasion in the acute phase and then decreased to about 1.5 folds than the pre-2022 Russian invasion in the subacute and chronic phases, while the value for “depression” decreased to half the pre-2022 Russian invasion in the acute phase and subsequently, gradually increased over time in the subacute and chronic phases. From these transitions, it is possible that psychological distress and anxiety tend to manifest immediately after the outbreak of war, whereas depression emerges gradually after a few months. The category “PTSR” did not demonstrate considerable variation between phases, but this category contains several KeyGrps that overlap with the “psychological distress,” “anxiety” and “depression” categories. However, a closer examination of the mental state KeyGrps representing the more PTSR-specific symptoms such as intrusion, avoidance, numbing, and dissociation indicated that “disturbing dreams/nightmares” has a high ratio in the subacute phase, while “flashback,” “avoidance of memories/thoughts/feelings,” “avoidance of external reminders,” “dissociative amnesia” and “numbed feeling” have the highest ratios in the chronic phase. These results suggest that PTSR-specific symptoms may be exhibited several months after the outbreak of war and as the war is prolonged. Thus, extremely high mental health needs are expected in this region, but the situation of the local mental health care system and mental health needs are rarely communicated outside Ukraine by the media, and there is insufficient information available. Therefore, we are conducting a survey of the actual situation of mental health needs in Ukraine under the Russian invasion, including how the psychiatric system in the country has been affected and what functions it maintains through local medical researchers, in parallel with this study (in submission).
At present, more than 14 million people have crossed the border from inside Ukraine after the Russian military invasion (UNHCR 2022). Many of them have been living as refugees outside Ukraine, therefore, it is estimated that many of the tweets collected in this study were sent by them. However, several previous studies have suggested that the severity of mental health status is comparable between IDPs and refugees outside the country, and also suggest that the prevalence of PTSD, depression, and anxiety disorders remain high among refugees more than five years after displacement (Bogic et al. 2015). It is, therefore, considered that they can be positioned as a group with similar psychological burdens, albeit with differences in safety and living conditions.
The use of tweet analysis is considered highly useful in ascertaining mental status and estimating the transition of mental status over time and the risk of developing mental disorders. In the future, it is expected that this technology will be applied to disasters other than war, and the estimated values from tweet analysis will be matched with actual measured values, such as the number of people newly suffering from mental disease and the number of suicides, to improve the validity of predictions, and that a close evaluation of keywords that can more appropriately identify mental status will be promoted.
Conclusion
Twitter was used even during wartime and the usage displayed a tendency to increase. The results revealed that the use of Twitter was consistent with the actual situation of medical resources and needs using diabetes and blood transfusions as examples. The data from the present study indicate that: 1) there may be an urgent need to help people who need to take their daily medication, such as diabetes patients, 2) we may be able to provide support to those who send help signs on social media, for example, through Twitter. In terms of mental status, it was suggested that the ratio of psychological distress and anxiety increased during the acute phase, and the ratio of depression and PTSR increased over time, making it possible to realize a certain degree of variation in mental status.
However, the study was limited in its ability to estimate specific numbers because no natural language processing or syntactic analysis was conducted. Along with natural language processing, we plan to improve our study results by verifying them against actual numbers, such as actual shortages of medicines, assessment data on patients with chronic diseases such as diabetes, the number of people newly suffering from mental disease, and the number of suicides, etc.
Acknowledgments
We would like to thank Kanata Corporation for their help in creating the tool for the tweet analysis as well as Fuyuo Takiuchi and the Ukrainian translators for their careful conversion of Japanese keywords. We also thank the researchers at the Department of Medicine, International Research Institute of Disaster Science, Tohoku University, for their advice on our research results. Part of this research was conducted as part of a joint research project with Mitsubishi HC Capital Corporation entitled “Research on the Ideal Medical BCP Infrastructure for Individuals and the Optimal Services and Infrastructure for Individuals Using Medical Information,” and a part of this research was conducted as part of a joint research project with NTT Space Environment and Energy Laboratories entitled “Study of an intervention model for the construction of a next-generation evacuation system, the improvement of life after evacuation and the promotion of actions towards disaster readiness by local residents.” This research project is an activity of the Core Research Cluster of Disaster Science and the Disaster Resilience Co-creation Center at IRIDeS, Tohoku University.
Conflict of Interest
This study was funded by NTT Space Environment and Energy Laboratories, and Mitsubishi HC Capital Corporation.
References
-
Adams,
K.,
Arivalagan,
K.,
Bonardi,
M.,
Juel,
P. &
Martz,
C.
(2022) Russian War Crimes Against Ukraine: The Breach of International Humanitarian Law by The Russian Federation. The Global Accountability Network.
-
Alessi,
J. &
Yankiv,
M.
(2022) War in Ukraine and barriers to diabetes care. Lancet, 399, 1465-1466.
-
Anderson,
A.A.
(2021) Expressions of resilience: social media responses to a flooding event. Risk Anal., 41, 1600-1613.
-
Aoki,
T.,
Suzuki,
T.,
Yagahara,
A.,
Hasegawa,
S.,
Tsuji,
S. &
Ogasawara,
K.
(2018) Analysis of the regionality of the number of tweets related to the 2011 Fukushima Nuclear Power Station Disaster: content analysis. JMIR Public Health Surveill., 4, e70.
-
Arthur,
R.,
Boulton,
C.A.,
Shotton,
H. &
Williams,
H.T.P.
(2018) Social sensing of floods in the UK. PLoS One, 13, e0189327.
-
Awuah,
W.A.,
Mehta,
A.,
Kalmanovich,
J.,
Yarlagadda,
R.,
Nasato,
M.,
Kundu,
M.,
Abdul-Rahman,
T.,
Deborah Fosuah,
A. &
Sikora,
V.
(2022) Inside the Ukraine war: health and humanity. Postgrad. Med. J., 98, 408-410.
-
Babvey,
P.,
Gongora-Svartzman,
G.,
Lipizzi,
C. &
Ramirez-Marquez,
J.E.
(2021) Content-based user classifier to uncover information exchange in disaster-motivated networks. PLoS One, 16, e0259342.
-
Behboudi-Gandevani,
S.,
Bidhendi-Yarandi,
R.,
Panahi,
M.H.,
Mardani,
A.,
Prinds,
C. &
Vaismoradi,
M.
(2022) Perinatal and neonatal outcomes in immigrants from conflict-zone countries: a systematic review and meta-analysis of observational studies. Front. Public Health, 10, 766943.
-
Bennett,
D.
(2018) Emergency preparedness collaboration on Twitter. J. Emerg. Manag., 16, 191-202.
-
Blackmore,
R.,
Boyle,
J.A.,
Fazel,
M.,
Ranasinha,
S.,
Gray,
K.M.,
Fitzgerald,
G.,
Misso,
M. &
Gibson-Helm,
M.
(2020) The prevalence of mental illness in refugees and asylum seekers: a systematic review and meta-analysis. PLoS Med., 17, e1003337.
-
Bogic,
M.,
Njoku,
A. &
Priebe,
S.
(2015) Long-term mental health of war-refugees: a systematic literature review. BMC Int. Health Hum. Rights, 15, 29.
-
CEPA (Center for European Policy Analysis)
(2022) Ukraine: Blood for Freedom. https://cepa.org/article/ukraine-blood-for-freedom/ [Accessed: October 24, 2022].
-
Devlin,
J.,
Chang,
M.W.,
Lee,
K. &
Toutanova,
K.
(2018) BERT: pre-training of deep bidirectional transformers for language understanding. NAACL-HLT, 2019, 4171-4186.
-
Fujii,
S.,
Nonaka,
S. &
Nakayama,
M.
(2021) Use of medical information and digital services for self-empowerment before, during, and after a major disaster. Tohoku J. Exp. Med., 255, 183-194.
-
Hoppen,
T.H. &
Morina,
N.
(2019) The prevalence of PTSD and major depression in the global population of adult war survivors: a meta-analytically informed estimate in absolute numbers. Eur. J. Psychotraumatol., 10, 1578637.
-
Hsu,
J.T. &
Tsai,
R.T.
(2022) Increased online aggression during COVID-19 lockdowns: two-stage study of deep text mining and difference-in-differences analysis. J. Med. Internet Res., 24, e38776.
-
Jabalameli,
S.,
Xu,
Y. &
Shetty,
S.
(2022) Spatial and sentiment analysis of public opinion toward COVID-19 pandemic using twitter data: at the early stage of vaccination. Int. J. Disaster Risk Reduct., 80, 103204.
-
Jain,
N.,
Prasad,
S.,
Czarth,
Z.C.,
Chodnekar,
S.Y.,
Mohan,
S.,
Savchenko,
E.,
Panag,
D.S.,
Tanasov,
A.,
Betka,
M.M.,
Platos,
E.,
Swiatek,
D.,
Krygowska,
A.M.,
Rozani,
S.,
Srivastava,
M.,
Evangelou,
K.,
et al. (2022) War psychiatry: identifying and managing the neuropsychiatric consequences of armed conflicts. J. Prim. Care Community Health, 13, 21501319221106625.
-
Jung,
J.Y. &
Moro,
M.
(2014) Multi-level functionality of social media in the aftermath of the Great East Japan Earthquake. Disasters, 38 Suppl 2, S123-143.
-
Kunii,
Y.,
Usukura,
H.,
Otsuka,
K.,
Maeda,
M.,
Yabe,
H.,
Takahashi,
S.,
Tachikawa,
H. &
Tomita,
H.
(2022a) Lessons learned from psychosocial support and mental health surveys during the 10 years since the Great East Japan Earthquake: establishing evidence-based disaster psychiatry. Psychiatry Clin. Neurosci., 76, 212-221.
-
Kunii,
Y.,
Usukura,
H.,
Utsumi,
Y.,
Seto,
M.,
Hamaie,
Y.,
Sugawara,
Y.,
Nakaya,
N.,
Kuriyama,
S.,
Hozawa,
A.,
Tsuji,
I. &
Tomita,
H.
(2022b) Review of mental health consequences of the Great East Japan Earthquake through long-term epidemiological studies: The Shichigahama Health Promotion Project. Tohoku J. Exp. Med., 257, 85-95.
-
Mehta,
P. &
Pandya,
S.
(2020) A review on sentiment analysis methodologies, practices and applications. Int. J. Sci. Technol. Res. (New Delhi), 9, 601-609.
-
Mesa-Vieira,
C.,
Haas,
A.D.,
Buitrago-Garcia,
D.,
Roa-Diaz,
Z.M.,
Minder,
B.,
Gamba,
M.,
Salvador,
D. Jr.,
Gomez,
D.,
Lewis,
M.,
Gonzalez-Jaramillo,
W.C.,
Pahud de Mortanges,
A.,
Buttia,
C.,
Muka,
T.,
Trujillo,
N. &
Franco,
O.H.
(2022) Mental health of migrants with pre-migration exposure to armed conflict: a systematic review and meta-analysis. Lancet Public Health, 7, e469-e481.
-
Miura,
A.,
Komori,
M.,
Matsumura,
N. &
Maeda,
K.
(2015) Expression of negative emotional responses to the 2011 Great East Japan Earthquake: analysis of big data from social media. Shinrigaku Kenkyu, 86, 102-111 (in Japanese).
-
Moshagen,
M. &
Hilbig,
B.
(2022) Citizens’ psychological reactions following the Russian invasion of the Ukraine: a cross-national study. Psy ArXiv, doi: 10.31234/osf.io/teh8y.
-
Murthy,
R.S. &
Lakshminarayana,
R.
(2006) Mental health consequences of war: a brief review of research findings. World Psychiatry, 5, 25-30.
-
Naumann,
D.N.,
Robinson,
M.W.,
Bowley,
D.M. &
Nott,
D.
(2022) War surgery and transfusion in makeshift hospitals in beleaguered cities. Lancet, 399, 1299-1301.
-
Patel,
S.S. &
Erickson,
T.B.
(2022) The new humanitarian crisis in Ukraine: coping with the public health impact of hybrid warfare, mass migration, and mental health trauma. Disaster Med. Public Health Prep., 16, 2231-2232.
-
Riad,
A.,
Drobov,
A.,
Krobot,
M.,
Antalova,
N.,
Alkasaby,
M.A.,
Perina,
A. &
Koscik,
M.
(2022) Mental health burden of the Russian-Ukrainian War 2022 (RUW-22): anxiety and depression levels among young adults in Central Europe. Int. J. Environ. Res. Public Health, 19, 8418.
-
Russian Ministry of Foreign Affairs
(2022) Speech by A.K. Lukashevich, Permanent Representative of the Russian Federation to the OSCE, at the expanded meeting of the OSCE Permanent Council on a special military operation to protect people from genocide by the Kiev regime. https://embassylife.ru/en/post/4645 [Accessed: November 30, 2022].
-
Skafle,
I.,
Nordahl-Hansen,
A.,
Quintana,
D.S.,
Wynn,
R. &
Gabarron,
E.
(2022) Misinformation about COVID-19 vaccines on social media: rapid review. J. Med. Internet Res., 24, e37367.
-
Takayasu,
M.,
Sato,
K.,
Sano,
Y.,
Yamada,
K.,
Miura,
W. &
Takayasu,
H.
(2015) Rumor diffusion and convergence during the 3.11 earthquake: a twitter case study. PLoS One, 10, e0121443.
-
Tsagkaris,
C.,
Shkodina,
A. &
Matiashova,
L.
(2022) The war in Ukraine and diabetic foot care: challenges, recommendations. Diabetes Metab. Syndr., 16, 102618.
-
UDF (Ukrainian Diabetic Federation)
(2022) UDF helps people with diabetes with the support of PeopleInNeed. https://diabetesatlas.com.ua/tpost/a6o4p3vjt1-udf-dopomaga-lyudyam-z-dabetom-za-pdtrim [Accessed: November 7, 2022].
-
Umihara,
J. &
Nishikitani,
M.
(2013) Emergent use of Twitter in the 2011 Tohoku Earthquake. Prehosp. Disaster Med., 28, 434-440.
-
UNHCR (the United Nations High Commissioner for Refugees)
(2022) Ukraine Refugee Situation. https://data.unhcr.org/en/situations/ukraine#_ga=2.27030589.1692436044.1666944957-217851197.1666944957 [Accessed: November 4, 2022].
-
WHO (World Health Organization. Regional Office for Europe.)
(2022) Response to the Ukraine Crisis: interim report, February to June 2022. https://apps.who.int/iris/handle/10665/360985 [Accessed: October 24, 2022].