Abstract
We investigated the role of cancer stem cells (CSCs) in a population of triple-negative breast cancer (TNBC) cells that are resistant to apoptosis. A human breast cancer cell population capable of inducing p53 expression with doxycycline (Dox) was created and used as an untreated control (UT). After the addition of Dox to UT for 5 days, the cell population reconstituted with cells showing resistance to apoptosis was named RE. Fluorescence-activated cell sorting (FACS) and immunostaining revealed that after the addition of Dox, the ratio of cells in the S and G2/M phases decreased in UT as apoptosis proceeded, but did not markedly change in apoptosis-resistant RE. CSC-like cells in RE exhibited a cell morphology with a larger ratio of the major/minor axis than UT. FACS showed that RE had a higher proportion of CSC-like cells and contained more CD44+CD24− mesenchymal CSCs than ALDH1A3+ epithelial-like CSCs. In a Matrigel invasion assay, UT was more likely to form a three-dimensional cell population, whereas RE exhibited a planar population, higher migration ability, and the up-regulated expression of epithelial-mesenchymal transition-related genes. These results provide insights into the mechanisms by which TNBC cells acquire treatment resistance at the time of recurrence.
I. Introduction
Breast cancer is the most frequently diagnosed malignancy with a significant number of disease-related deaths in women worldwide. Approximately 15–20% cases of breast cancer are diagnosed as “triple-negative breast cancer” based on the characteristic lack of expression and/or amplification of three biomarkers, estrogen receptor (ER), progesterone receptor (PR), and human epidermal growth factor receptor 2 (HER2) protein [12, 26]. TNBC is more commonly diagnosed in women younger than 40 years than hormone-positive breast cancer. The histological feature of TNBC is its infiltrating growth patterns with necrosis and desmoplastic reactions in surrounding stromal tissue. Among various types of breast cancers, TNBC exhibits more aggressive growth expansion and a high risk of relapse, resulting in short progression-free survival (PFS) and overall survival (OS). Furthermore, patients with metastatic TNBC have short PFS after the failure of first-line chemotherapy, suggesting the need for the development of a novel drug targeting TNBC [26]. Therefore, TNBC involves more aggressive phenotypes that are similar to stem cell-like cancer cells (CSCs) [26].
A hierarchical model of malignancy was proposed to characterize tumor heterogeneity and profile the organization of malignant tumors. Specifically, malignant tumors are organized similarly to normal tissues, with cancer stem cells reproducing similar daughter stem cells capable of self-renewal [5]. CSCs are defined as having both the ability to self-renew and differentiate and are composed of a small population of cancer cells [33]. CSCs also exhibit tumor-initiating activity and are considered to be resistant to chemotherapy and radiotherapy [10, 13, 24, 38].
Dormant/quiescent/slow cycling CSCs are a key component of tumor heterogeneity and are responsible for chemoresistance, tumor migration, and metastatic dormancy, defined as the ability of CSCs to survive in target organs and generate metastasis up to two decades after diagnosis [11]. Recent findings suggest that quiescence is not just a passive state, but rather a finely regulated program that may be triggered in response to new microenvironmental signals or the absence of cues on which cancer cells previously depended. Quiescent/slow cycling CSCs are characterized by an increased tumor-repopulating ability and the capacity to survive chemotherapy.
Evidence for the roles of aldehyde dehydrogenase (ALDH) in breast cancer is accumulating whereby the metastatic and aggressive behaviors of inflammatory breast cancer are mediated by a CSC component that expresses ALDH1 [8]. ALDH1A3, one of the subtypes of the ALDH family, has been proposed as a novel clinical CSC marker showing a clear correlation between the prevalence of CSCs and the development of metastatic breast cancer [34]. We previously reported that ALDH1A3 was expressed not only in CSCs, but also in highly proliferating progenitor cells in TNBC [25]. On the other hand, breast CSCs (BCSCs) have also been isolated and identified as cells expressing CD44+CD24− by a surface marker analysis [1, 52]. In a recent study on 13 different types of breast cancer cell lines, the presence of CD44+CD24− cells was associated with higher levels of invasion and an increase in distant metastases in human breast cancers [10]. In a study on 136 breast cancer tissue samples, the presence of a high number of CD44+CD24− cells (> 10%) correlated with a high incidence of distant metastases [10].
Epithelial-mesenchymal transition (EMT) has been shown to impart malignant properties to cancer [51]. During the process of breast cancer metastasis by EMT, epithelial cells lose their epithelial properties and acquire mesenchymal properties. As a result, epithelial cells separate from the basement membrane and have an increased ability to migrate to other sites, proliferate, infiltrate, and invade the blood and lymphatic system to cause distant metastasis [31, 32]. The inactivation of cell-cell adhesion molecules in EMT promotes cell motility and migration. EMT-induced cells exhibit highly similar gene expression patterns to those of CSCs and are susceptible to transformation [24]. The acquisition of the mesenchymal phenotype is associated with the characteristics of CSCs.
Although the expression of CD44+CD24− and the increased activity of ALDH1 [1, 43, 53] have been identified as markers for BCSCs, distinct mesenchymal-like BCSCs are characterized by the CD44+CD24− phenotype. Previous studies on fractionated stem-like CD44+CD24− cells by FACS from human mammary epithelial cells (HMLE) showed that mesenchymal-like BCSCs had similar phenotypes to cells that had undergone EMT [53]. In clinical settings, the CD44+CD24− phenotype is more common in TNBC, which has a higher risk of metastases to distant organs than other subtypes of breast cancer [18, 21, 29, 39, 53].
CSCs exist in distinct states of mesenchymal-like (EMT) and epithelial-like (mesenchymal-epithelial transition [MET]) states [30]. Mesenchymal-like BCSCs with the expression of CD44+CD24− are primarily quiescent and localize at the invasive front of tumors, while epithelial-like BCSCs with increased levels of ALDH activity are proliferative and located more centrally in tumors [30]. The plasticity of BCSCs allows a transition between the EMT- and MET-like states, resulting in the acquisition of a capability for tissue invasion and metastasis [30].
Furthermore, cells with the CD44+CD24− phenotype have been shown to express increased levels of Snail, Slug, Twist, and N-cadherin and decreased levels of E-cadherin [30]. There are three types of CSCs: epithelial-like (E) ALDH+ CSCs, mesenchymal-like (M) CD44+CD24− CSCs, and hybrid (E/M) ALDH+/CD44+CD24− CSCs. These subtypes of CSCs exhibit differential signal pathway regulation, possess plasticity, and respond differently to treatment [48].
The expression of some EMT-associated biomarkers has been detected in a number of clinical human cancer tissues, including breast cancer, and has been used to infer EMT-like changes in breast cancer tissues [53]. Snail is a transcription factor that triggers EMT during tumor progression, maintains stem cells, and may induce resistance to radiation and chemotherapy [57]. Immunohistochemical staining showed that Snail was expressed in different subtypes of breast cancer tissues, exclusively in the basal-like subtype of breast cancer and was associated with the aggressiveness of tumors [53].
We previously reported that ALDH1A3 was expressed not only in CSCs, but also in proliferating progenitor cells in TNBC [25]. CSCs are important for inducing vasculogenic mimicry (VM), which is consistent with clinical findings showing that VM was associated with a worsening metastatic potential and prognosis in high-grade breast cancer [23]. Therefore, evidence is accumulating to show that CSCs are involved in treatment resistance, infiltration, and metastasis; however, the underlying mechanisms have not yet been elucidated in detail. In the present study, we created a reconstituted breast cancer cell population that is resistant to apoptosis induced by the overexpression of p53. In comparisons with the parental population, this apoptosis-resistant cell population is characterized by an EMT-like phenotype in gene expression patterns and invasive migration in Matrigel. We investigated the roles of BCSCs in apoptosis-resistant transformation and their plasticity to induce EMT. Although previous studies demonstrated that EMT-induced cells acquired CSC-like features [24], the present study is the first to show that cancer cell populations enriched in mesenchymal-like CSCs acquired the EMT phenotype. These results provide a more detailed understanding of the mechanisms by which TNBC develops resistance to treatment.
II. Materials and Methods
Construction of a p53-inducible cell line and cell culture
The human breast cancer cell line HCC1937 was purchased from the American Type Culture Collection (ATCC) [17]. HCC1937 cells were negative for the expression of ER, PR, and HER2, referred to as a triple-negative tumor, and had nonsense mutations at codon 306 of TP53 and insertion C at nucleotide 5382 (5382C) of the BRCA1 gene. HCC1937 cells had already been stably transfected with a WT-p53-inducible plasmid (Tet-on Advanced System, Clontech, USA), and one of the isolated clones from a single cell was designated as HCC1937/p53 [23, 25]. HCC1937/p53 cells were cultured in RPMI1640 (Nacalai Tesque, Kyoto, Japan) containing 10% fetal bovine serum (FBS) [22] (SIGMA, USA) and ZeocinTM (1 μg/mL, InvivoGen, USA).
Establishment of the apoptosis-resistant cell population, RE
The HCC1937/p53 cell population not treated with Dox in the present study was redesignated as the untreated cell population (UT). On the 5th day of culture when the number of viable cells was minimized in Dox-containing medium, approximately 10% of surviving cells resistant to p53-induced apoptosis were further cultured in Dox-free medium. The cell population obtained was referred to as the apoptosis-resistant cell population (RE). In the present experiments, the UT and RE cultured with Dox for 1 day to 10 days were designated as UT Dox1d to UT Dox10d, and RE Dox1d to RE Dox10d, respectively. The UT and RE cultured without Dox were named as UT Dox0d and RE Dox0d and used as controls, respectively. Our previous findings confirmed the induction of p53 expression in UT treated with Dox [25]. In the present study, when p53 expression was analyzed by fluorescence-activated cell sorting (FACS), it was maintained in RE at the same level as that in Dox-treated UT cells or at higher levels (Fig. 1).

After staining cells with Trypan Blue (Life Technologies), the number of viable cells was measured with the Countess II FL automated cell counter (Life Technologies).
Immunohistochemical staining
Binding of the ALDH1A3 antibody was visualized using an alkaline phosphatase-conjugated anti-rabbit IgG antibody (Histofine Simple Stain AP, Nichirei, Tokyo, Japan) and the BCIP®/NBT Liquid Substrate System (SIGMA-ALDRICH, USA). Antigen retrieval for Ki-67 staining was performed in a microwave with 10 mM citrate buffer (pH 6.0) for 20 min. Cells were then incubated with a Ki-67 antibody (Mouse monoclonal, DAKO, 1:500) at 37°C for 1 hr [50]. Binding of the Ki-67 antibody was visualized using peroxidase-conjugated anti-mouse IgG (Histofine Simple Stain Max-PO, Nichirei, Tokyo, Japan) and DAB solution. Unimmunized rabbit serum or isotype mouse IgG was used as the negative control and no background signals were observed. The specificities of these antibodies have been widely accepted based on the manufacturer’s data sheets and studies in which specific signal bands were detected by Western blotting, and cell type-specific immunohistochemical staining patterns have also been documented [42, 47, 55]. Cell images were captured with a digital camera (FX380 OLYMPUS, Tokyo, Japan) and analyzed using FLVFS-LS software (Ver. 1.11) (OLYMPUS, Tokyo, Japan). We evaluated staining of the cytoplasm for ALDH1A3 and staining of the nucleus for Ki-67.
FACS analysis
A FACS analysis of p53, CD44, CD24, and ALDH1A3 was performed. A PE-labeled anti-human p53 antibody (Mouse monoclonal, BD Biosciences), APC-labeled anti-human CD44 antibody (APC Mouse Anti-Human CD44, BD PharmingenTM), FITC-labeled anti-human CD24 antibody (FITC Mouse Anti-Human CD24, BD PharmingenTM), anti-rabbit ALDH1A3 antibody (Purified Rabbit Polyclonal Antibody, ABGENT, 1:500), and Alexa Fluor 680 goat anti-rabbit antibody (ABGENT, 1:500) were used. Fluorescence intensity was analyzed using Cell Sorter SH800 (SONY, Tokyo, Japan) and SH800 Software (Ver. 2.1.6) (SONY, Tokyo, Japan).
Cell cycle analysis
A cell cycle analysis was performed as previously reported [7, 19]. Regarding pulse labeling, cells were treated with BrdU at a concentration of 10 mM at 37°C for 30 min. Cells were fixed and permealized with BD Cytofix/Cytoperm Buffer and treated with DNase (BD PharmingenTM) at a concentration of 300 μg/mL to expose incorporated BrdU. Cells were then stained with a FITC-conjugated anti-BrdU antibody (BD PharmingenTM) at a dilution of 1:50 and with 7-AAD and analyzed with Cell Sorter SH800 (SONY, Tokyo) to assess cell cycle kinetics. Cells not labeled with BrdU were used as the negative control.
Matrigel invasion assay
An invasion assay was performed using the thin gel method according to previous studies [41] and the manufacturer’s protocol. TransWell hanging inserts (24 wells) were purchased from TC inserts (SARSTEDT) and coated with 35 μL Matrigel matrix. A total of 3.5 × 10⁴ cells per well were starved for 24 hr in advance and then seeded into the upper chamber in growth medium containing 1% FBS, while the lower chambers of the TC Plate (SARSTEDT) were loaded with 1,000 μL of complete growth medium containing 10% FBS. To count the number of invaded cells, Matrigel and non-invaded cells were removed from the upper surface of polycarbonate filters embedded at the bottom of the inserts using cotton swaps. Cells adhering to the underside of filters were fixed using 4% paraformaldehyde. After staining with Giemsa, invaded cells were counted in three random microscopic fields for each insert. The invasion assay was repeated in three independent experiments. To analyze cells invading Matrigel, Matrigel and the filters were cut en bloc and subjected to immunofluorescence staining.
Immunofluorescence staining
Cells that migrated in Matrigel were fixed with 4% paraformaldehyde for 10 min, washed with PBS, and permeabilized with 0.25% TritonX-100 for 10 min [49]. Cells were treated with 10% normal goat serum (SeraCare Life Sciences, MA, USA) for 45 min and incubated with primary antibodies for anti-ALDH1A3 (Purified Rabbit Polyclonal, ABGENT, 1:50), anti-Snail (Purified Rabbit Polyclonal, abcam, 1:200), and anti-CD44 (Mouse Monoclonal, Cell Signaling, 1:400) at 4°C overnight. Unimmunized rabbit serum or isotype mouse IgG was used as the negative control and no background signals were observed. The specificities of these antibodies have been widely accepted based on the manufacturer’s data sheets and studies in which specific signal bands were detected by Western blotting, and cell type-specific immunohistochemical staining patterns have also been documented [42, 47, 55]. Primary antibody binding was detected using Alexa Fluor 488-conjugated goat anti-rabbit IgG (Life Technologies, USA, 1:1,000) for ALDH1A3 and Snail, and Alexa Fluor 633-conjugated goat anti-mouse IgG2a (Thermo Fisher Scientific, USA, 1:1000) for CD44 incubated at room temperature for 1 hr [35]. Cells were mounted and counterstained with 4,6-diamidino-2-phenylindole, dihydrochloride (DAPI, 300 μg/mL) (Molecular Probes, USA) for nuclear staining [36]. Fluorescence images were captured with a confocal laser scanning microscope (A1, NIKON INSTECH, Tokyo, Japan). The fluorescence intensities of randomly selected images (9 fields of view in total) were quantitatively analyzed for each fluorescence channel using Fiji/ImageJ software (Ver. 1.52g, Java 1.80_172, NIH) [46]. Furthermore, since the thickness of Matrigel is approximately 200 μm, a stack was created in the Z-axis direction from a continuous slice image (thickness of 1 μm), and the depth of cell invasion was measured.
Assessment of the structure of the cell population
The terms polygon and complex mesh were originally proposed by Aranda [2]. Cells begin to show projections referred to as sprouting. Cells with sprouts connect to each other to form a cell-cell contact designated as connected cells. Furthermore, multiple projections form a series of polygon structures. The following stage involves the approximation of cells to form polygon structures that have a wall, which is two to three cells thick. The presence of these structures is referred to as a complex mesh.
RT-PCR
Matrigel and invading cells were transferred en bloc to a microcentrifuge tube. Total RNA was extracted with TRIzol® (Life Technologies, USA) and cDNA was synthesized using SuperScript® III reverse transcriptase (Life Technologies) [14]. A cDNA template and TaqMan® probes (Thermo Fisher Scientific, USA) for GAPDH (Hs03929097_g1), VE-cadherin (PCDH12) (Hs00170986_m1), MMP-9 (Hs00957562_m1), and SNAI1 (Hs00195591_m1) were mixed with appropriate concentrations and transferred to a 48-well PCR plate (Applied BiosystemsTM) [23]. The plate was sealed with a 48-well Optical Adhesive Film (Applied BiosystemsTM). A PCR reaction was performed using the StepOneTM Real-Time PCR System (Applied BiosystemsTM). The conditions of thermal cycles were as follows: at 95°C for 1 min and 40 cycles at 60°C for 20 min. In each sample, data were normalized to GAPDH.
Statistical analysis
All experiments were repeated at least 3 times and were investigated using 100 or more cells in each plot in the analysis of immunocytochemical staining. Results are expressed as the mean ± standard deviation. In the Student’s t-test, a P value less than 0.05 between the two groups was considered to be significant.
III. Results
Proliferation rate of reconstituted apoptosis-resistant cell populations
To reconstruct the apoptosis-resistant cell population, UT were initially cultured in Dox-containing medium to the 5th day, when the number of viable cells reached the minimum at approximately 10% and were then cultured in Dox-free medium. Eight apoptosis-resistant cell populations out of 10 cultures were obtained and used as RE. When UT and RE were each grown without Dox and the number of viable cells was measured, both increased over time for 10 days and growth rates did not significantly differ (Fig. 2A).

In contrast, under the administration of Dox, the number of cells in UT gradually decreased, whereas that in RE consistently increased. This gradual decrease in UT was probably caused by the delayed timing of apoptosis in asynchronously cultured cells, especially adherent cells, due to differences in the cell cycle stages of each cell. Typical cell proliferation patterns observed under the phase-contrast microscope are shown in Fig. 2B. In UT, the number of viable cells decreased due to Dox-induced apoptosis, showing a minimum value on Dox5d, and then slightly increased (Fig. 2C). However, the number of cells in RE continued to increase (Fig. 2D). On Dox10d, the average number of cells in UT of up to 1.3 × 10⁵ was markedly smaller than that in RE of up to 39.0 × 10⁵.
A FACS analysis of the cell cycle was performed by the administration of BrdU. In UT on Dox3d, proliferating S-phase and G2/M-phase cells were markedly reduced, whereas resting cells in the G0/G1 phase increased by approximately two-fold (Fig. 3A and B). On the other hand, in RE, there was no significant change in the proportion of resting G0/G1 phase cells or proliferating S-phase or G2/M-phase cells on Dox3d (Fig. 3C and D). Regarding changes in UT over time, the ratio of cells in the G0/G1 phase increased, whereas those in the S phase and G2/M phase decreased on Dox1d and Dox3d, that in the S phase on Dox5d markedly increased, and that in the G2/M phase on Dox7d increased (Fig. 3E). In contrast, the ratio of RE cells in the G0/G1, S, and G2/M phases did not markedly change and maintained the same state as that on Dox0d (Fig. 3F).
Expression of CSC markers
The ratio of cells expressing ALDH1A3 and CD44+CD24− was analyzed by Cell Sorter SH800. The analysis of ALDH1A3 revealed that the ratio of ALDH1A3-expressing cells was higher in RE on Dox0d (38.4%) than in UT on Dox0d (10.0%) (Fig. 4A and C). The ratio of cells with CD44+CD24− was also lower in UT on Dox0d (23.8%) and higher in RE on Dox0d (75.3%) (Fig. 4B and D). Therefore, RE contained more CSC-like cells with the expression of ALDH1A3 or CD44+CD24−. Furthermore, similar expression patterns were observed from Dox1d to Dox9d. The proportion of cells expressing ALDH1A3 (Fig. 4E, p < 0.01: all time points, except for Dox7d) and CD44+CD24− (Fig. 4F, p < 0.01) was mostly higher in RE than in UT.
Immunocytochemical analysis of hierarchical constituent cells
We previously detected the expression of ALDH1A3 not only in CSCs, but also in Ki-67-positive precursor cells by immunocytochemical staining [25]. Proliferating precursor cells may be recognized as Ki-67+, but may be further categorized into two types, ALDH1A3+Ki-67+ and ALDH1A3−Ki-67+ precursor cells. Therefore, four types of cells in the population hierarchy, CSCs, ALDH1A3+ precursor cells, ALDH1A3− precursor cells, and mature cancer cells, may be distinguished by immunocytochemical staining for ALDH1A3 and Ki-67, as shown in Fig. 5A.

The ratio of cells expressing ALDH1A3+Ki-67− as a CSC marker in UT on Dox0d was 14.8% and showed a transient increase to 38.1% on Dox1d (Fig. 5B). The ratio of RE cells with ALDH1A3+Ki-67− was significantly high (40.3%) on Dox0d and was maintained even after the administration of Dox (Fig. 5B). This was consistent with the results obtained by FACS (Fig. 4E). In addition, the proportions of ALDH1A3+Ki-67+ cells were almost the same in UT (35.8%) and RE (36.5%) on Dox0d (Fig. 5C). However, on Dox1d, the ratio of ALDH1A3+Ki-67+ cells decreased to 14.2% in UT, whereas that in RE showed a slight increase to 43.3% (Fig. 5C).
Size and shape of CSC-like cells
Although the size of CSCs is controversial [27], we previously reported that ALDH1A3+ cells were mainly small [25]. CSCs are generally smaller than committed cells and differentiated cells [9, 27]. In the present study, the size of CSCs expressing ALDH1A3+Ki-67− was analyzed. The proportion of S (< 50 μm) cells was significantly higher in RE (38.2 ± 7.9%) than in UT (13.3 ± 3.1%) (Fig. 5D). In L cells (≥ 50 μm), no significant differences were observed in the ratio of CSCs in UT and RE (Fig. 5D). To investigate the morphological change of CSCs to mesenchymal-like cells, the major/minor axis ratio of ALDH1A3+Ki-67− cells in L cells was analyzed (Fig. 5E). The major/minor axis ratio was significantly larger in RE cells than in UT cells on Dox0d and Dox1d, but not on Dox5d or Dox7d. The morphology of RE cells appeared to be spindle-shaped under certain conditions.
Epithelial-like and mesenchymal-like CSCs
Three subtypes of CSCs have been identified: E-CSCs expressing ALDH1A3+ with epithelial-like features, M-CSCs expressing CD44+CD24− with mesenchymal-like characteristics, and E/M-CSCs expressing hybrid ALDH1A3+/CD44+CD24− (Fig. 6A) [4, 30, 48]. The expression patterns of ALDH1A3 and CD44+CD24− were examined by FACS. The ratio of cells expressing ALDH1A3+, E-CSCs, was slightly higher in UT (4.9 ± 1.2%) than in RE (3.4 ± 0.6%) (Fig. 6B). The ratio of cells expressing CD44+CD24−, M-CSCs, was significantly higher in RE (37.6 ± 1.6%) than in UT (21.6 ± 2.9%) (Fig. 6D). In addition, the ratio of cells expressing both ALDH1A3+ and CD44+CD24−, E/M-CSCs, was significantly higher in RE (32.6 ± 1.3%) than in UT (5.1 ± 0.4%) (Fig. 6C).
Acquisition of invasion potential in breast cancer cells
The Matrigel invasion assay was performed under four experimental conditions: UT Dox0d, UT Dox2d, RE Dox0d, and RE Dox2d. The number of cells that reached the pores of the filter at the bottom of Matrigel was confirmed by Giemsa staining (Fig. 7A). The number of invading cells gradually increased from 1 to 6 hr under all experimental conditions (Fig. 7B). RE Dox2d cells invaded faster than the others and showed the largest number of cells that reached the filter hole at 24 hr (Fig. 7B).
Vertical invasion manner of breast cancer cells in Matrigel
Since there is currently no information on the infiltration process in Matrigel, the infiltration depth and morphological characteristics of cells in Matrigel were examined using confocal laser microscope. After 1 hr of the Matrigel culture, the majority of cells were detected in the shallow layer as solitary single cells (Fig. 8A). After 6 hr, cells that reached the deeper layers formed a multicellular population. The majority of cells at the invasion front located in the deepest area near the filter were solitary and did not form any cell population (Fig. 8A). Differences in cell infiltration depths were expressed by a color code scale in the Z-stack image of cells that had been nuclear-stained with DAPI. The morphology of the RE cell population was planar, whereas that of UT was more three-dimensional, particularly after 6 hr of culture (Fig. 8A). The depth of the infiltration tip, which is the most advanced region of the cell population, was measured by a Z-stack image obtained using the confocal laser scanning microscope (Fig. 8B). The infiltration depth increased with time. RE reached a deeper layer than UT under all four conditions. In the case of the 6-hr culture, RE Dox2d infiltrated the deepest while UT Dox2d showed less infiltration than the others (Fig. 8B). These results were consistent with those of the Matrigel invasion assay by Giemsa staining, suggesting that RE Dox2d has the highest abilities for cell invasion and motility. To evaluate the rate of formation of a multicellular population during the infiltration process, the number of polygon and complex meshes that formed, defined as the VM score, was measured (Fig. 8C). After 6 hr, the rate of polygon and complex mesh formation was the highest in UT Dox2d and the lowest in RE Dox2d. We previously reported a relationship between the expression of VE-cadherin and MMP-9 and VM in UT cells [23]. As expected, the expression levels of the VM markers MMP-9 and VE-cadherin were significantly elevated in UT Dox2d after 6 hr but remained unchanged in RE Dox2d (Fig. 8D and E).

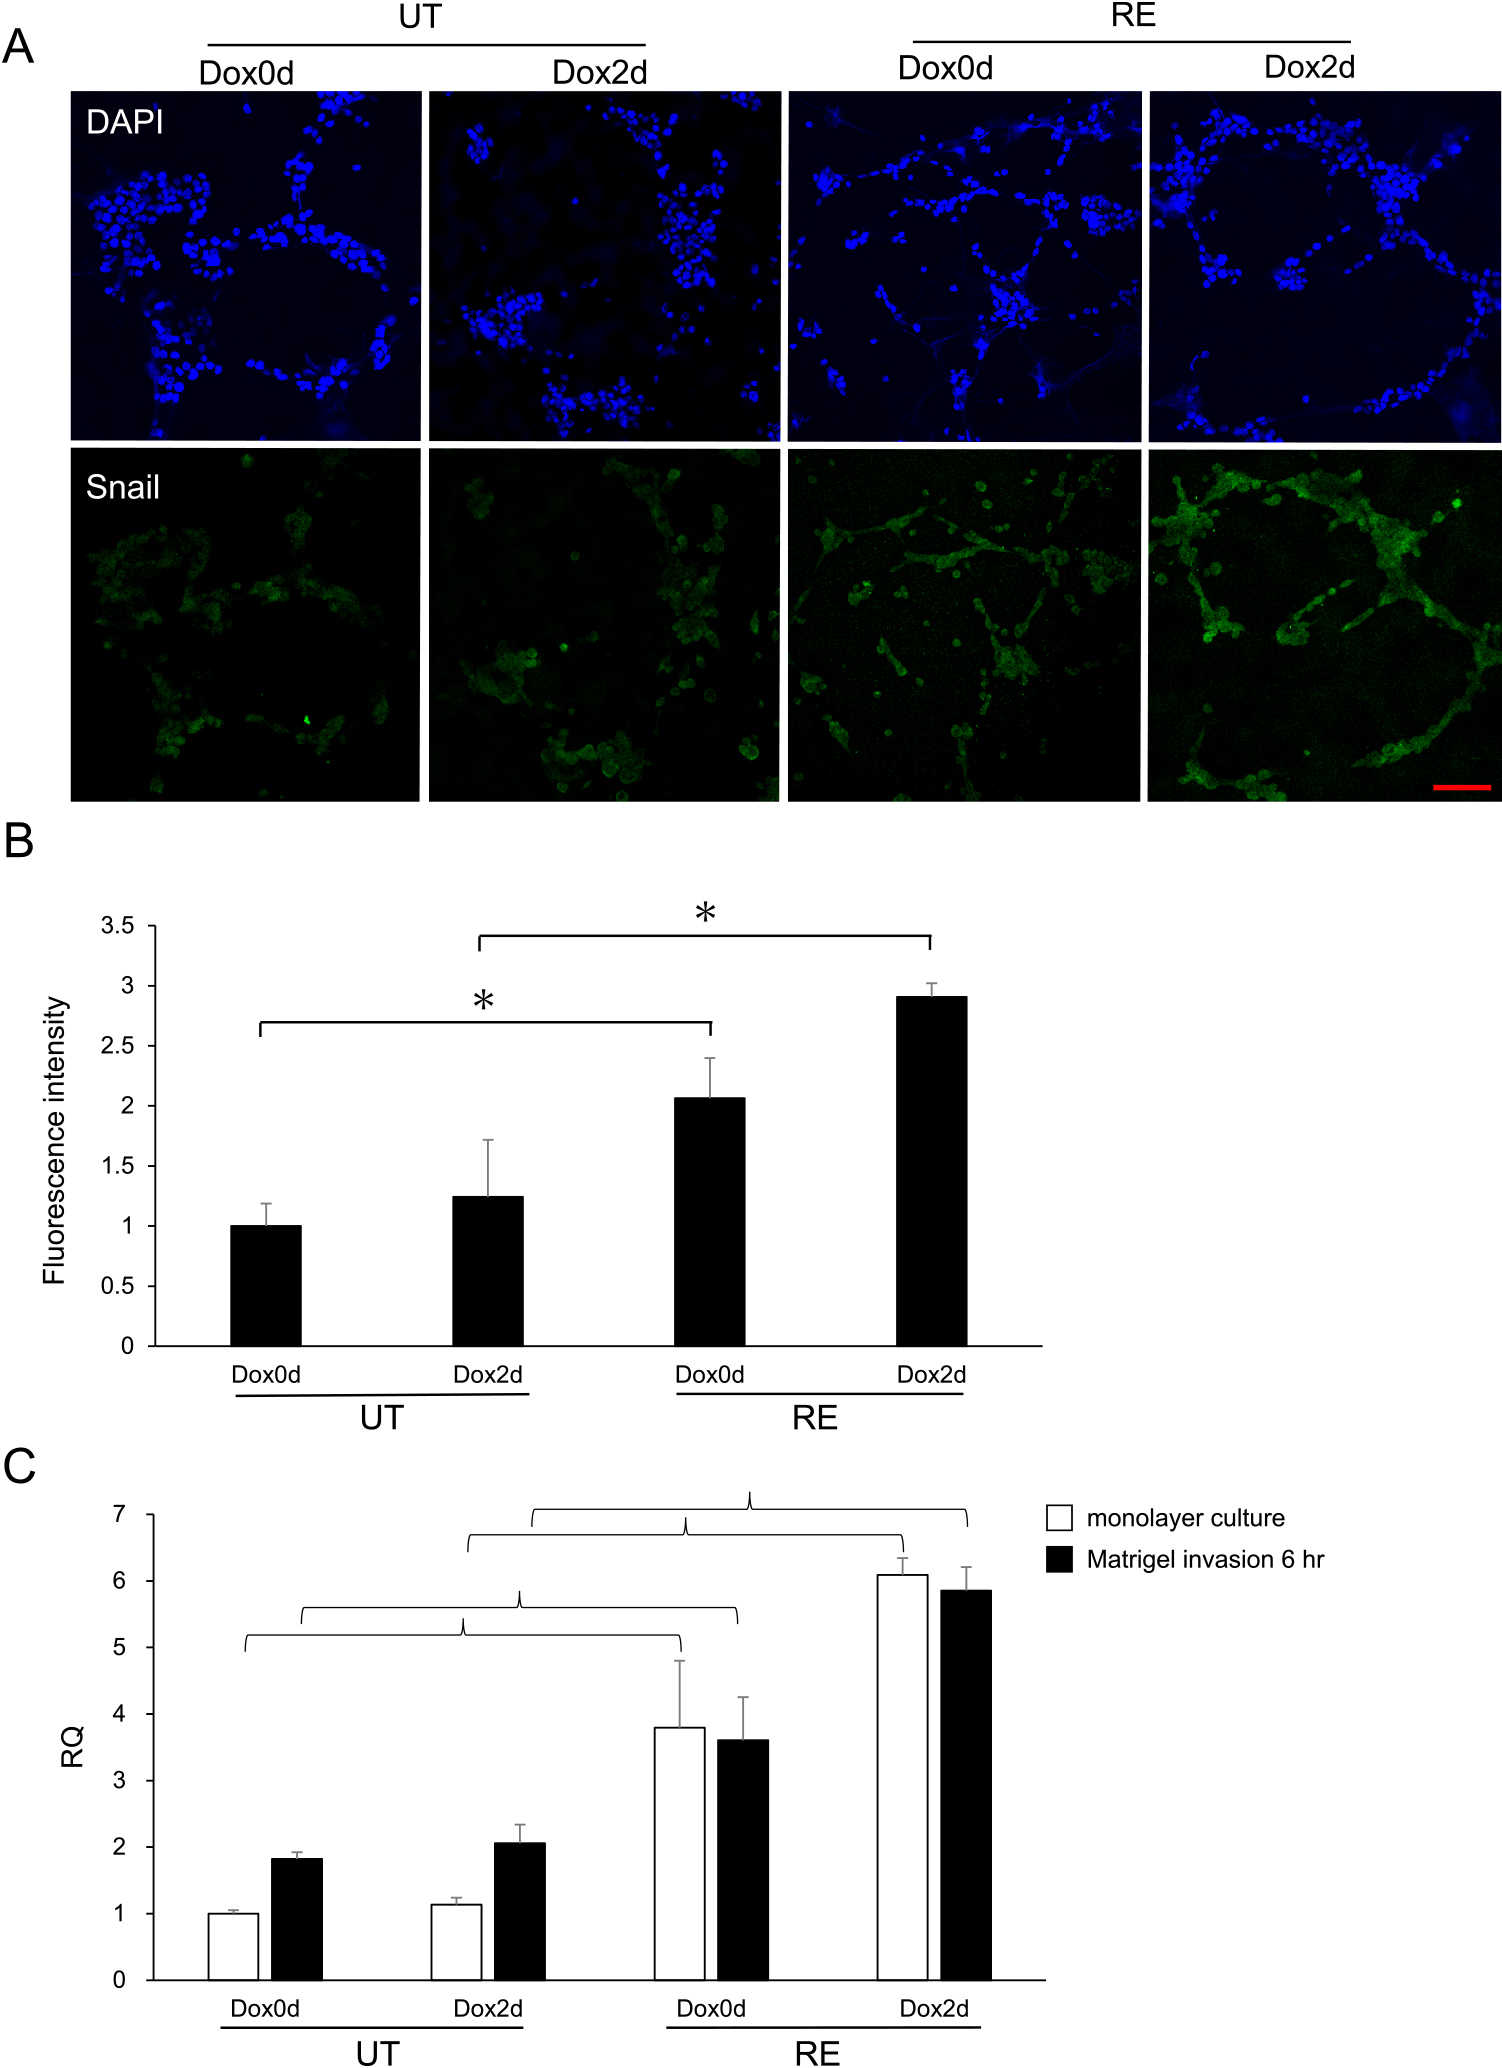
The expression of Snail, one of the EMT markers, was detected by the immunofluorescent staining of cell populations infiltrating Matrigel (Fig. 9A). Fluorescence intensity in the nucleus and cytoplasm of the cell was measured because Snail expression localized not only in the nucleus but also in the cytosol based on its phosphorylation status [28, 37, 44, 56]. A quantitative analysis using Fiji/ImageJ software showed significantly higher expression levels of Snail in RE Dox0d and RE Dox2d than in UT Dox0d and UT Dox2d, respectively (Fig. 9B). RNA was extracted from cells on a conventional monolayer and Matrigel culture and was analyzed by real-time PCR. The expression levels of Snail on both the monolayer and Matrigel culture were significantly higher in RE Dox0d than in UT Dox0d (p < 0.01) and were even higher in RE Dox2d (Fig. 9C).
IV. Discussion
In clinical practice, optimal chemotherapy kills the majority of cells; however, a small fraction of cells, CSCs, are resistant to drugs and remain quiescent. These quiescent stem cells are induced to divide and produce progenitor cells, some of which differentiate into new mature tumor cells with a chemoresistant phenotype [10]. The application of this clinical observation to our experiments indicates that this also occurs in UT cells after the addition of Dox, which corresponds to the differentiation of CSCs into prodromal cells and differentiated cells to reconstruct the hierarchy. The mechanism underlying the acquisition of drug resistance in vivo was reproduced in our in vitro experimental system by resistance to apoptosis. When Dox was not added, the proportion of ALDH1A3+ CSC-like cells was significantly higher in RE than in UT. Our results confirmed that RE, which is a reconstituted cell population that showed resistance to apoptosis due to the addition of Dox and survived, contained a large number of CSCs.
After the addition of Dox, immunocytochemical staining revealed that the number of ALDH1A3+ cells gradually decreased in UT, but slightly increased in RE. The increase observed in the ratio of ALDH1A3+Ki-67− cells on Dox1d, in contrast to the decrease in UT, was attributed to the survival of CSC-like cells exhibiting resistance to apoptosis. On the other hand, in RE, the proportion of CSC-like cells showing ALDH1A3+Ki-67− was high before the addition of Dox and was maintained after Dox addition, indicating the apoptosis-resistant proliferation of RE. The results of immunostaining were also confirmed by the FACS analysis. In RE, resistance to apoptosis was found not only in CSCs, but also in other constituent cells.
By focusing on CSC marker-positive progenitor cells expressing ALDH1A3+Ki-67+, we showed that the proportion of cells in UT on Dox1d slightly decreased, whereas that in RE slightly increased. Progenitor cells in UT are sensitive to apoptosis, whereas RE cells are resistant to apoptosis. ALDH1A3+Ki-67+ cells in RE showed a marked increase even when the cell ratio was converted to an absolute number. Furthermore, the cell cycle analysis using BrdU revealed that the ratio of RE did not significantly change even after the addition of Dox, indicating that RE progenitor cells acquired resistance to apoptosis.
Epithelial cells are characterized by a round paving stone-like morphology with apical-basal polarity that is ordered on the basement membrane and has high intercellular adhesion. In contrast, mesenchymal cells do not have polarity or intercellular adhesion proteins, but have a spindle shape [3, 54] and the characteristics of cell migration [32]. CSCs are primarily dormant and are generally reported to be smaller than progenitor or mature cells [9, 25, 27]. In the present study, the high proportion of CSCs among S cells of 50 μm or less in UT was consistent with “cancer stem cells showing resistance to apoptosis being small cells”. Furthermore, resistance to apoptosis by RE cells may be attributed to them containing a proportion of smaller CSC-like cells. On the other hand, in the FACS analysis, cell sizes by FSC fractions confirmed that RE had more CSC-like small cells (Supplementary Fig. S1). Immunostaining showed that the major/minor axis ratio of CSC-like cells in RE was large and these cells were more likely to be spindle-shaped; therefore, CSC-like cells may have transiently caused EMT on Dox2d. The possibility of EMT due to this morphological change is also supported by the high expression of Snail, an EMT marker, in RE based on the results of the gene expression analysis by fluorescent staining and RT-PCR.
Snail is a transcription factor that induces EMT and maintains stem cells; however, it may induce resistance to radiation therapy and chemotherapy. Cells displaying the CD44+CD24− phenotype had elevated expression levels of Snail, Slug, Twist, and N-cadherin and decreased levels of E-cadherin [30]. RE is a population with more mesenchymal characteristics than UT. This was confirmed by RT-PCR (Fig. 9C), with Snail expression levels being significantly high in RE even on Dox0d and Dox2d. This result suggests that resistance to apoptosis in RE was due to the ability for EMT being acquired before the addition of Dox.
A previous study examined fractionated stem-like CD44+CD24− cells from HMLE by FACS and demonstrated that mesenchymal-like BCSCs exhibited similar phenotypes to cells that had undergone EMT [32]. Furthermore, CD44+CD24− was expressed by mesenchymal CSCs and ALDH1A3 by epithelial CSCs [30]. The results of the FACS analysis suggest that RE contained more mesenchymal CSCs while UT contained a significant number of epithelial CSCs. Although invasion is caused by the migration of a single cell, the majority of solid tumors display features of collective invasion, in which cells cohesively invade as a multicellular unit [16]. The mechanisms by which a group of adherent epithelial cancer cells acquire motile invasive behavior have not yet been elucidated [15, 20, 40].
We previously reported that VM was caused by the plasticity of CSCs [23]. In the present study, we found that epithelial-like UT showed more collective invasion and a three-dimensional cell population (polygon and complex mesh) as well as gene expression patterns suggestive of VM in the Matrigel culture. On the other hand, mesenchymal-like RE had a planar cell population and an excellent single cell-migrating ability in Matrigel but lacked VM-related gene expression. UT Dox2d cells had the highest rates of polygon and mesh formation, and significantly higher mRNA expression levels of the VM markers VE-cadherin and MMP-9. In addition, VM was induced in UT Dox2d cells because the analysis of the cell population structure by color coding showed that they had a high ability to form more complicated three-dimensional higher-order structures. According to our preliminary data, the cells in these complex structures preferentially expressed ALDH1A3, while a single or few migrating cells expressed CD44 (Supplementary Fig. S2). On the other hand, in RE Dox2d, the expression level of Snail, which is an EMT marker, was significantly high. Regarding the average depth of the infiltration tip, RE Dox2d migrated to the deepest part of Matrigel. This result suggests that in contrast to UT, which may exhibit VM, RE is a cell population that has the potential for invasion and migration, which are the characteristics of mesenchymal cells.
A relationship has been implicated between EMT and drug resistance. The inhibition of EMT has been reported to decrease drug resistance in chemotherapy [54]. In oral cancer cells, a SNAIL-mediated EMT phenotype exhibited quiescence and further induced resistance to chemotherapeutics [57]. The overexpression of the TWIST, SNAIL, and FOXC2-mediated EMT phenotypes in TNBC cells induced multidrug resistance by up-regulating ABC transporters [45]. Therefore, the acquisition of the EMT phenotype also induces stemness and quiescence, which have been implicated in drug resistance by cancers [26]. The plasticity of CSCs that allows their reciprocal transition between the EMT- and MET-like states enables cells to acquire the capacity for tissue invasion and metastasis [30]. In studies in which EMT was experimentally induced, CD44+CD24− cells with improved mammosphere formation efficiency and self-renewal ability were generated and had stem cell-like characteristics [6, 13, 31, 32]. In contrast, we demonstrated that EMT occurred when apoptosis-resistant RE were created.
Our experimental system reproducibly enables in vitro analyses of changes induced in cancer cells by p53-induced apoptosis. We also observed the process of the reconstitution of treatment-resistant cancer cell populations. RE that acquired resistance to p53-dependent apoptosis exhibited an EMT-like phenotype, which includes EMT-like morphological characteristics, infiltration and migration abilities in Matrigel, and up-regulated Snail expression. Although Snail was already expressed in a monolayer culture (Fig. 9C), the EMT phenotype of RE was mostly induced in Matrigel. In other words, the plasticity of mesenchymal-like CSCs that are already present in a cancer cell population appear to differentiate themselves in order to initiate infiltration and migration depending on the surrounding environment.
V. Conflicts of Interest
The authors declare that there are no conflicts of interest.
VI. Acknowledgments
This work was supported by MEXT/JSPS KAKENHI Grant Number 15K08411.
VII. References
- 1 Al-Hajj, M., Wicha, M. S., Benito-Hernandez, A., Morrison, S. J. and Clarke, M. F. (2003) Prospective identification of tumorigenic breast cancer cells. Proc. Natl. Acad. Sci. U S A 100; 3983–3988.
- 2 Aranda, E. and Owen, G. I. (2009) A semi-quantitative assay to screen for angiogenic compounds and compounds with angiogenic potential using the EA.hy926 endothelial cell line. Biol. Res. 42; 377–389.
- 3 Biddle, A., Liang, X., Gammon, L., Fazil, B., Harper, L. J., Emich, H., et al. (2011) Cancer stem cells in squamous cell carcinoma switch between two distinct phenotypes that are preferentially migratory or proliferative. Cancer Res. 71; 5317–5326.
- 4 Bocci, F., Gearhart-Serna, L., Boareto, M., Ribeiro, M., Ben-Jacob, E., Devi, G. R., et al. (2019) Toward understanding cancer stem cell heterogeneity in the tumor microenvironment. Proc. Natl. Acad. Sci. U S A 116; 148–157.
- 5 Bomken, S., Fiser, K., Heidenreich, O. and Vormoor, J. (2010) Understanding the cancer stem cell. Br. J. Cancer 103; 439–445.
- 6 Britton, K. M., Kirby, J. A., Lennard, T. W. and Meeson, A. P. (2011) Cancer stem cells and side population cells in breast cancer and metastasis. Cancers (Basel) 3; 2106–2130.
- 7 Carayon, P. and Bord, A. (1992) Identification of DNA-replicating lymphocyte subsets using a new method to label the bromo-deoxyuridine incorporated into the DNA. J. Immunol. Methods 147; 225–230.
- 8 Charafe-Jauffret, E., Ginestier, C., Iovino, F., Tarpin, C., Diebel, M., Esterni, B., et al. (2010) Aldehyde dehydrogenase 1-positive cancer stem cells mediate metastasis and poor clinical outcome in inflammatory breast cancer. Clin. Cancer Res. 16; 45–55.
- 9 Chen, W., Dong, J., Haiech, J., Kilhoffer, M. C. and Zeniou, M. (2016) Cancer Stem Cell Quiescence and Plasticity as Major Challenges in Cancer Therapy. Stem Cells Int. 2016; 1740936.
- 10 Chuthapisith, S., Eremin, J., El-Sheemey, M. and Eremin, O. (2010) Breast cancer chemoresistance: emerging importance of cancer stem cells. Surg. Oncol. 19; 27–32.
- 11 De Angelis, M. L., Francescangeli, F. and Zeuner, A. (2019) Breast Cancer Stem Cells as Drivers of Tumor Chemoresistance, Dormancy and Relapse: New Challenges and Therapeutic Opportunities. Cancers (Basel) 11; 1569.
- 12 Dent, R., Trudeau, M., Pritchard, K. I., Hanna, W. M., Kahn, H. K., Sawka, C. A., et al. (2007) Triple-negative breast cancer: clinical features and patterns of recurrence. Clin. Cancer Res. 13; 4429–4434.
- 13 Doherty, M. R., Cheon, H., Junk, D. J., Vinayak, S., Varadan, V., Telli, M. L., et al. (2017) Interferon-beta represses cancer stem cell properties in triple-negative breast cancer. Proc. Natl. Acad. Sci. U S A 114; 13792–13797.
- 14 Egashira, N., Minematsu, T., Miyai, S., Takekoshi, S., Camper, S. A. and Osamura, R. Y. (2008) Pituitary changes in Prop1 transgenic mice: hormone producing tumors and signet-ring type gonadotropes. Acta Histochem. Cytochem. 41; 47–57.
- 15 Friedl, P. and Gilmour, D. (2009) Collective cell migration in morphogenesis, regeneration and cancer. Nat. Rev. Mol. Cell Biol. 10; 445–457.
- 16 Friedl, P., Locker, J., Sahai, E. and Segall, J. E. (2012) Classifying collective cancer cell invasion. Nat. Cell Biol. 14; 777–783.
- 17 Gazdar, A. F., Kurvari, V., Virmani, A., Gollahon, L., Sakaguchi, M., Westerfield, M., et al. (1998) Characterization of paired tumor and non-tumor cell lines established from patients with breast cancer. Int. J. Cancer 78; 766–774.
- 18 Giatromanolaki, A., Sivridis, E., Fiska, A. and Koukourakis, M. I. (2011) The CD44+/CD24− phenotype relates to ‘triple-negative’ state and unfavorable prognosis in breast cancer patients. Med. Oncol. 28; 745–752.
- 19 Gonchoroff, N. J., Katzmann, J. A., Currie, R. M., Evans, E. L., Houck, D. W., Kline, B. C., et al. (1986) S-phase detection with an antibody to bromodeoxyuridine. Role of DNase pretreatment. J. Immunol. Methods 93; 97–101.
- 20 Gray, R. S., Cheung, K. J. and Ewald, A. J. (2010) Cellular mechanisms regulating epithelial morphogenesis and cancer invasion. Curr. Opin. Cell Biol. 22; 640–650.
- 21 Honeth, G., Bendahl, P. O., Ringner, M., Saal, L. H., Gruvberger-Saal, S. K., Lovgren, K., et al. (2008) The CD44+/CD24− phenotype is enriched in basal-like breast tumors. Breast Cancer Res. 10; R53.
- 22 Iwabuchi, E., Miki, Y., Ono, K., Onodera, Y. and Sasano, H. (2017) In Situ Evaluation of Estrogen Receptor Dimers in Breast Carcinoma Cells: Visualization of Protein-Protein Interactions. Acta Histochem. Cytochem. 50; 85–93.
- 23 Izawa, Y., Kashii-Magaribuchi, K., Yoshida, K., Nosaka, M., Tsuji, N., Yamamoto, A., et al. (2018) Stem-like Human Breast Cancer Cells Initiate Vasculogenic Mimicry on Matrigel. Acta Histochem. Cytochem. 51; 173–183.
- 24 Kai, K., Arima, Y., Kamiya, T. and Saya, H. (2010) Breast cancer stem cells. Breast Cancer 17; 80–85.
- 25 Kashii-Magaribuchi, K., Takeuchi, R., Haisa, Y., Sakamoto, A., Itoh, A., Izawa, Y., et al. (2016) Induced Expression of Cancer Stem Cell Markers ALDH1A3 and Sox-2 in Hierarchical Reconstitution of Apoptosis-resistant Human Breast Cancer Cells. Acta Histochem. Cytochem. 49; 149–158.
- 26 Lee, K. L., Kuo, Y. C., Ho, Y. S. and Huang, Y. H. (2019) Triple-Negative Breast Cancer: Current Understanding and Future Therapeutic Breakthrough Targeting Cancer Stemness. Cancers (Basel) 11; 1334.
- 27 Li, Q., Rycaj, K., Chen, X. and Tang, D. G. (2015) Cancer stem cells and cell size: A causal link? Semin. Cancer Biol. 35; 191–199.
- 28 Li, S. S., Chen, D. M., Chen, L. B., Wei, H., Wang, J. L., Xiao, J., et al. (2021) GTSE1 promotes SNAIL1 degradation by facilitating its nuclear export in hepatocellular carcin oma cells. Mol. Med. Rep. 23; 454.
- 29 Lin, Y., Zhong, Y., Guan, H., Zhang, X. and Sun, Q. (2012) CD44+/CD24− phenotype contributes to malignant relapse following surgical resection and chemotherapy in patients with invasive ductal carcinoma. J. Exp. Clin. Cancer Res. 31; 59.
- 30 Liu, S., Cong, Y., Wang, D., Sun, Y., Deng, L., Liu, Y., et al. (2014) Breast cancer stem cells transition between epithelial and mesenchymal states reflective of their normal counterparts. Stem Cell Reports 2; 78–91.
- 31 Mallini, P., Lennard, T., Kirby, J. and Meeson, A. (2014) Epithelial-to-mesenchymal transition: what is the impact on breast cancer stem cells and drug resistance. Cancer Treat. Rev. 40; 341–348.
- 32 Mani, S. A., Guo, W., Liao, M. J., Eaton, E. N., Ayyanan, A., Zhou, A. Y., et al. (2008) The epithelial-mesenchymal transition generates cells with properties of stem cells. Cell 133; 704–715.
- 33 Marcato, P., Dean, C. A., Giacomantonio, C. A. and Lee, P. W. (2011) Aldehyde dehydrogenase: its role as a cancer stem cell marker comes down to the specific isoform. Cell Cycle 10; 1378–1384.
- 34 Marcato, P., Dean, C. A., Pan, D., Araslanova, R., Gillis, M., Joshi, M., et al. (2011) Aldehyde dehydrogenase activity of breast cancer stem cells is primarily due to isoform ALDH1A3 and its expression is predictive of metastasis. Stem Cells 29; 32–45.
- 35 Masuda, C., Takeuchi, S., Bisem, N. J., Vincent, S. R. and Tooyama, I. (2014) Immunohistochemical Localization of an Isoform of TRK-Fused Gene-Like Protein in the Rat Retina. Acta Histochem. Cytochem. 47; 75–83.
- 36 Matsumoto, H., Tsuchiya, T., Yoshiura, K., Hayashi, T., Hidaka, S., Nanashima, A., et al. (2014) ABCC11/MRP8 Expression in the Gastrointestinal Tract and a Novel Role for Pepsinogen Secretion. Acta Histochem. Cytochem. 47; 85–94.
- 37 Muqbil, I., Wu, J., Aboukameel, A., Mohammad, R. M. and Azmi, A. S. (2014) Snail nuclear transport: the gateways regulating epithelial-to-mesenchymal transition? Semin. Cancer Biol. 27; 39–45.
- 38 Nedeljkovic, M. and Damjanovic, A. (2019) Mechanisms of Chemotherapy Resistance in Triple-Negative Breast Cancer-How We Can Rise to the Challenge. Cells 8; 957.
- 39 Perrone, G., Gaeta, L. M., Zagami, M., Nasorri, F., Coppola, R., Borzomati, D., et al. (2012) In situ identification of CD44+/CD24− cancer cells in primary human breast carcinomas. PLoS One 7; e43110.
- 40 Polyak, K. and Weinberg, R. A. (2009) Transitions between epithelial and mesenchymal states: acquisition of malignant and stem cell traits. Nat. Rev. Cancer 9; 265–273.
- 41 Rahimian, A., Barati, G., Mehrandish, R. and Mellati, A. A. (2018) Inhibition of Histone Deacetylases Reverses Epithelial-Mesenchymal Transition in Triple-Negative Breast Cancer Cells through a Slug Mediated Mechanism. Mol. Biol. (Mosk) 52; 406–413.
- 42 Rexer, B. N., Zheng, W. L. and Ong, D. E. (2001) Retinoic acid biosynthesis by normal human breast epithelium is via aldehyde dehydrogenase 6, absent in MCF-7 cells. Cancer Res. 61; 7065–7070.
- 43 Ricardo, S., Vieira, A. F., Gerhard, R., Leitao, D., Pinto, R., Cameselle-Teijeiro, J. F., et al. (2011) Breast cancer stem cell markers CD44, CD24 and ALDH1: expression distribution within intrinsic molecular subtype. J. Clin. Pathol. 64; 937–946.
- 44 Rosivatz, E., Becker, K. F., Kremmer, E., Schott, C., Blechschmidt, K., Hofler, H., et al. (2006) Expression and nuclear localization of Snail, an E-cadherin repressor, in adenocarcinomas of the upper gastrointestinal tract. Virchows Arch. 448; 277–287.
- 45 Saxena, M., Stephens, M. A., Pathak, H. and Rangarajan, A. (2011) Transcription factors that mediate epithelial-mesenchymal transition lead to multidrug resistance by upregulating ABC transporters. Cell Death Dis. 2; e179.
- 46 Schindelin, J., Arganda-Carreras, I., Frise, E., Kaynig, V., Longair, M., Pietzsch, T., et al. (2012) Fiji: an open-source platform for biological-image analysis. Nat. Methods 9; 676–682.
- 47 Shi, S. R., Key, M. E. and Kalra, K. L. (1991) Antigen retrieval in formalin-fixed, paraffin-embedded tissues: an enhancement method for immunohistochemical staining based on microwave oven heating of tissue sections. J. Histochem. Cytochem. 39; 741–748.
- 48 Sulaiman, A., McGarry, S., Han, X., Liu, S. and Wang, L. (2019) CSCs in Breast Cancer-One Size Does Not Fit All: Therapeutic Advances in Targeting Heterogeneous Epithelial and Mesenchymal CSCs. Cancers (Basel) 11; 1128.
- 49 Syaidah, R., Tsukada, T., Azuma, M., Horiguchi, K., Fujiwara, K., Kikuchi, M., et al. (2016) Fibromodulin Expression in Folliculostellate Cells and Pericytes Is Promoted by TGFbeta Signaling in Rat Anterior Pituitary Gland. Acta Histochem. Cytochem. 49; 171–179.
- 50 Takekoshi, S., Yasui, Y., Inomoto, C., Kitatani, K., Nakamura, N. and Osamura, R. Y. (2014) A Histopathological Study of Multi-hormone Producing Proliferative Lesions in Estrogen-induced Rat Pituitary Prolactinoma. Acta Histochem. Cytochem. 47; 155–164.
- 51 Thiery, J. P., Acloque, H., Huang, R. Y. and Nieto, M. A. (2009) Epithelial-mesenchymal transitions in development and disease. Cell 139; 871–890.
- 52 Wang, H., Wang, L., Song, Y., Wang, S., Huang, X., Xuan, Q., et al. (2017) CD44(+)/CD24(−) phenotype predicts a poor prognosis in triple-negative breast cancer. Oncol. Lett. 14; 5890–5898.
- 53 Wu, Y., Sarkissyan, M. and Vadgama, J. V. (2016) Epithelial-Mesenchymal Transition and Breast Cancer. J. Clin. Med. 5; 13.
- 54 Xu, X., Zhang, L., He, X., Zhang, P., Sun, C., Xu, X., et al. (2018) TGF-beta plays a vital role in triple-negative breast cancer (TNBC) drug-resistance through regulating stemness, EMT and apoptosis. Biochem. Biophys. Res. Commun. 502; 160–165.
- 55 Yoshida, A., Rzhetsky, A., Hsu, L. C. and Chang, C. (1998) Human aldehyde dehydrogenase gene family. Eur. J. Biochem. 251; 549–557.
- 56 Zhou, B. P., Deng, J., Xia, W., Xu, J., Li, Y. M., Gunduz, M., et al. (2004) Dual regulation of Snail by GSK-3beta-mediated phosphorylation in control of epithelial-mesenchymal transition. Nat. Cell Biol. 6; 931–940.
- 57 Zhu, L. F., Hu, Y., Yang, C. C., Xu, X. H., Ning, T. Y., Wang, Z. L., et al. (2012) Snail overexpression induces an epithelial to mesenchymal transition and cancer stem cell-like properties in SCC9 cells. Lab. Invest. 92; 744–752.