Abstract
The pharmacokinetics of aprepitant, a neurokinin-1 receptor antagonist, have not been fully evaluated in clinical settings. The aim of this study was to characterize the plasma pharmacokinetics of aprepitant and reveal their influence of laboratory tests and cytochrome P450 (CYP) 3A5 gene polymorphisms in cancer patients. Forty-four Japanese cancer patients receiving cisplatin-based chemotherapy for the first time following oral aprepitant (125 mg on day 1 and 80 mg on days 2 and 3) were enrolled. The patients did not have gastrointestinal disease and the clinical laboratory values were within their normal reference levels. The plasma concentrations of aprepitant 24 (day 2 predose), 72, and 120 h after the first aprepitant administration were determined using LC-MS/MS. The relationships between plasma exposure to aprepitant and body weight, clinical laboratory values, age, gender, or CYP3A5*3 were investigated. The median and interquartile ranges of the 120-h area under the plasma concentration time curve (AUC)0–120 of aprepitant were 73215 and 55518–91121 ng h/mL. The coefficient of variation value for aprepitant AUC0–120 was 53%. The AUC0–120 of aprepitant was correlated with the levels of total bilirubin and serum albumin, respectively (r=0.454, p<0.01 and r=0.287, p=0.06), but not with other non-genetic factors and CYP3A5 genetic variants in a univariate analysis. The AUC0–120 of aprepitant was significantly correlated with the level of total bilirubin (adjusted R2=0.187, p<0.01) in a multivariate analysis. In conclusion, the plasma pharmacokinetics of aprepitant varied markedly in cancer patients receiving cisplatin-based chemotherapy for the first time and were correlated with the level of total bilirubin.
Aprepitant is a highly selective antagonist of neurokinin-1 (NK1) receptors and developed as a treatment for both acute (during the first 24 h postchemotherapy) and delayed (24 through 120 h postchemotherapy) chemotherapy-induced nausea and vomiting (CINV). The combination of aprepitant, dexamethasone, and a 5-hydroxytryptamine3 (5-HT3) receptor antagonist has elevated the percentages of patients with a complete response (no vomiting and no rescue medication) during the 5 d after highly and moderately emetogenic chemotherapy by approximately 20%1,2) and 10%3) compared to non-aprepitant regimens, respectively.
The bioavailability of oral aprepitant capsules is 59% for the 125 mg capsules and 67% for the 80 mg capsules.4) There are no restrictions in the administration of aprepitant with regard to feeding conditions.4,5) Aprepitant penetrates the blood–brain barrier and binds to a high degree with brain NK1 receptors, inhibiting emesis via the central nervous system.6–9) A population pharmacokinetics study of aprepitant in Japan found that body weight, alanine aminotransferase (ALT), blood urea nitrogen (BUN), and age affected the oral clearance of aprepitant.10) The authors reported that the changes in aprepitant pharmacokinetics caused by these factors were not clinically significant and they did not examine the linear correlations between aprepitant pharmacokinetics and these factors. The influence of these factors on plasma aprepitant concentrations has not been fully clarified in clinical settings.
The primary elimination pathway of aprepitant is metabolism by cytochrome P450 (CYP) 3A4, with minor contributions from CYP1A2 and CYP2C19.11,12) CYP1A2 and CYP2C19 yielded only products of O-dealkylation, whereas CYP3A4 catalyzed both N- and O-dealkylation reactions. The products derived from the N-dealkylation and subsequent reactions were eliminated in feces, while the products of O-dealkylation were eliminated in urine.11) CYP3A4 is the major contributor to the metabolism of aprepitant because aprepitant is mainly eliminated via the feces.12) Aprepitant is metabolized to seven metabolites, which have lower binding affinities for the NK1 receptor and lower plasma concentrations. Therefore, aprepitant is more responsible for the antiemetic activity7,13) and adverse effects than that of its metabolites. CYP3A5 appears to account for up to 50% of total hepatic CYP3A protein in individuals carrying at least one CYP3A5*1 allele, and is the most significant contributor to interindividual differences in CYP3A-dependent drug clearance in humans.14) Although CYP3A5 gene polymorphisms may affect aprepitant plasma disposition, the exact effect remains unknown.
The aim of this study was to characterize the plasma exposure of aprepitant and reveal their influence of laboratory tests and CYP3A5 gene polymorphisms in cancer patients receiving cisplatin-based chemotherapy for the first time.
Materials and Methods
EthicsThis study was performed in accordance with the Declaration of Helsinki and its amendments. The protocol was approved by the Ethics Committee of Hamamatsu University School of Medicine. Each patient received information about the scientific aim of this study and provided written informed consent.
Patient Population and Study ScheduleForty-four Japanese cancer patients receiving cisplatin-based chemotherapy at Hamamatsu University Hospital between February 1, 2011 and February 29, 2012 were enrolled. The inclusion criteria were inpatients, older than 20 years, chemotherapy-naive and received orally aprepitant (Emend® Capsules, Ono Pharmaceutical Co., Ltd., Osaka, Japan) 125 mg before chemotherapy on day 1 and 80 mg on days 2 and 3. All patients received a 5-HT3 receptor antagonist and 38 out of 44 patients received dexamethasone for the prevention of CINV. The following patients were excluded from the study: patients with a risk of vomiting for other reasons (symptomatic brain metastasis, meningeal infiltration, epilepsy, active peptic ulcer, gastrointestinal obstruction, etc.); and pregnant, nursing, or possibly pregnant women. If the patients were regular users of any medication known to induce the CYP (e.g., phenytoin, carbamazepine, rifampin) or inhibit the CYP (e.g., itraconazole), they were excluded from this study. Patients with nausea and vomiting in the 24 h before chemotherapy were also excluded. Venous blood samples were drawn into tubes containing ethylenediaminetetraacetic acid (EDTA) for measuring the plasma concentrations of aprepitant at 24 (C24; before day 2 administration of aprepitant), 72 (C72), and 120 (C120) after the first administration of aprepitant.
Determination of Aprepitant in PlasmaChemicals and ReagentsAprepitant was purchased from Toronto Research Chemicals Inc. (North York, Ontario, Canada). Diazepam used as an internal standard, and HPLC-grade acetonitrile and methanol were purchased from Wako Pure Chemical Industries, Ltd. (Osaka, Japan). All other reagents were reagent grade and commercially available.
Sample PreparationPlasma samples (100 µL) were diluted with 500 µL of distilled water followed by 100 µL of 10% methanol containing 0.5% ammonia solution and internal standard (1 µg/mL of diazepam). This was then loaded onto a solid phase extraction cartridge (Sep-Pak® plus C8, 400 mg, 0.8 mL, Waters, Milford, MA, U.S.A.) previously conditioned with 3 mL of methanol and 3 mL of distilled water. The cartridge was washed with 500 µL of distilled water and eluted with 1.5 mL of methanol. The methanol eluent was evaporated to dryness. The residue was reconstituted in 100 µL of mobile phase, filtered with a syringe-driven filter unit (Millex®-LH, 0.45 µm, 4 mm, Millipore, Bedford, MA, U.S.A.), and injected into the analytic column.
Determination Apparatus and ConditionsAprepitant plasma concentrations were determined using a high-performance liquid chromatograph connected to a tandem mass spectrometer (LC-MS/MS)7,15) (Table 1). The system consisted of a Finnigan model TSQ®-7000 triple-quadruple MS (Thermo Fisher Scientific, Waltham, MA, U.S.A.) with an electrospray ionization interface to the LC. Data were collected and analyzed using Xcalibur software (version 1.2, Thermo Fisher Scientific).
Table 1. LC and MS/MS Conditions
| LC-MS/MS conditions | |
|---|
| Flow | 0.2 mL/min |
| Column | TSKgel ODS-100V, 3.0 µm |
| 2.0 mm i.d.×75 mm |
| Column temperature | 40°C |
| Mobile phase | 5 mm ammonium acetate buffer/acetonitrile (50/50, pH 3.0) |
| Capillary temperature | 260°C |
| Ion source | Electrospray ionization |
| Scan mode | Positive |
| Selected reaction monitoring |
| Monitor ion (m/z) |
| Aprepitant | 535.3/277.0 |
| Diazepam | 285.1/154.0 |
| Collision energy |
| Aprepitant | −17 eV |
| Diazepam | −25 eV |
This determination method was validated according to the U.S. Food Drug Administration Industry Guidance.16) The intra- and interassay accuracies for aprepitant were 103–105% and 94–104%, respectively. The intra- and interassay precisions for aprepitant were 2–6% and 2–9%, respectively. The mean extraction recoveries of aprepitant at 10, 100, and 1000 ng/mL were 92.2%, 86.5%, and 93.8%, respectively. The calibration curve was linear over the aprepitant concentration range of 5–3000 ng/mL. The correlation coefficient was greater than 0.999. The lower limit of quantification for aprepitant was 5 ng/mL.
Clinical Laboratory ValuesClinical laboratory values before chemotherapy including total bilirubin (T-Bil), aspartate aminotransferase (AST), ALT, gamma-glutamyl transpeptidase (γ-GTP), serum albumin (Alb), BUN, and serum creatinine (Cre) were obtained from routine laboratory tests.
Genotyping of CYP3A5Genomic DNA from peripheral leukocytes was isolated using a DNA Extractor WB Kit (Wako Pure Chemical Industries, Ltd., Osaka, Japan). CYP3A5*3 allele was determined using modified polymerase chain reaction (PCR) and restriction fragment length polymorphism amplification techniques previously described by Fukuen et al.17) In this analysis, dNTP (Applied Biosystems Japan Inc., Tokyo, Japan) and AmpliTaq Gold (Applied Biosystems Japan Inc.) in the PCR reactions and DdeI (Roche Diagnostics, Mannheim, Germany) as restriction enzyme were used. Allelic frequencies were calculated by direct counting.
Pharmacokinetic Analysis and Statistical MethodsThe area under the plasma concentration–time curve (AUC) of aprepitant during the overall phase (0–120 h) (AUC0–120) was estimated using the linear trapezoidal method. The AUC0–120 was adjusted by the total aprepitant dose administered per kg of body weight. The correlation between body weight and absolute AUC0–120 of aprepitant was investigated using Pearson’s correlation coefficient test. The correlations between hepatic function (T-Bil, AST, ALT, γ-GTP, and Alb), renal function (BUN and Cre), or age and dose-normalized AUC0–120 of aprepitant were investigated using Pearson’s correlation coefficient test. The influences of gender and CYP3A5*3 on dose-normalized AUC0–120 of aprepitant were analyzed using the nonparametric Mann–Whitney U test, because normal distribution and equal variances between each groups could not be assumed. Stepwise multiple linear regression analysis (p<0.05 to enter and p>0.10 to remove) was performed to assess the dependence between dose-normalized AUC0–120 of aprepitant and 10 predictor values (T-Bil, AST, ALT, γ-GTP, Alb, BUN, Cre, age, gender (male: 0 and female: 1), and CYP3A5*3 (CYP3A5*1 carrier: 0 and CYP3A5*3/*3: 1)). Standardized partial regression coefficient (β) and variance inflation factor (VIF) were obtained. β value indicates the magnitude of each predictor value. Normally, VIF values larger than 10 suggest that multicollinearity may be causing estimation problems. All statistical analyses were performed using SPSS 15.0J software (SPSS Japan Inc., Tokyo, Japan). The level of statistical significance was set at p<0.05.
Results
Patient Characteristics and Chemotherapy RegimensThe patient characteristics and chemotherapy regimens are shown in Tables 2 and 3, respectively. Most of the participants (77%) were male, and the median age was 64 years. The most frequent chemotherapy regimens were cisplatin plus radiation (48%) and cisplatin plus docetaxel plus fluorouracil (29%).
Table 2. Patients Characteristics and Clinical Laboratory Data
| Number of patients [male/female] | 44 [34/10] |
| Age (years) | 64 (55–69) |
| Body weight (kg) | 54 (49–60) |
| Total bilirubin (mg/dL) | 0.6 (0.5–0.8) |
| Aspartate aminotransferase (IU/L) | 19 (16–25) |
| Alanine aminotransferase (IU/L) | 16 (13–23) |
| Gamma-glutamyl transpeptidase (IU/L) | 24 (19–40) |
| Serum albumin (g/dL) | 3.9 (3.5–4.2) |
| Blood urea nitrogen (mg/dL) | 13.5 (11.6–15.4) |
| Serum creatinine (mg/dL) | 0.71 (0.67–0.87) |
| Lactate dehydrogenase (IU/L) | 184 (150–207) |
| C-reactive protein (mg/dL) | 0.16 (0.08–1.00) |
Data are expressed as median and interquartile range unless otherwise stated.
Table 3. Chemotherapy Regimens (Number of Patients, %)
| Otorhinolaryngology/Head & Neck Surgery | 37 (84) |
| Cisplatin+Radiation | 21 (48) |
| Cisplatin+Docetaxel+Fluorouracil | 13 (29) |
| Cisplatin arterial infusion+Radiation | 3 (7) |
| Urology | 7 (16) |
| Cisplatin+Gemcitabine | 4 (9) |
| Cisplatin+Bleomycin+Etoposide | 2 (5) |
| Cisplatin+Doxorubicin+Ifosfamide+Etoposide | 1 (2) |
The medians and interquartile ranges of absolute C24, C72, and C120 were 768 and 592–949 ng/mL, 915 and 563–1203 ng/mL, and 64 and 19–173 ng/mL, respectively (Fig. 1). The median and interquartile range of absolute AUC0–120 were 73215 and 55518–91121 ng h/mL.

Fig. 1. Plasma Concentration of Aprepitant at 24, 72, and 120 h after the First Aprepitant Administration in Cancer Patients Receiving Cisplatin-Based Chemotherapy for the First Time (n=44, Each Time Point)
Body weight was not significantly correlated with the absolute AUC0–120 of aprepitant (p=0.16). T-Bil was significantly correlated with the dose-normalized AUC0–120 of aprepitant (r=0.454, p<0.01, Fig. 2A). There was a statistical correlation trend between Alb and the dose-normalized AUC0–120 of aprepitant (r=0.287, p=0.06, Fig. 2B). AST, ALT, γ-GTP, BUN, Cre, and age were not linearly correlated with the dose-normalized AUC0–120 of aprepitant (p=0.53, 0.99, 0.16, 0.70, 0.38, and 0.55, respectively). The dose-normalized AUC0–120 of aprepitant was not significantly different between males and females (medians and interquartile ranges, 15518 and 10836–18561 ngh/mL per mg/kg and 13164 and 8091–18463 ngh/mL per mg/kg, p=0.45).
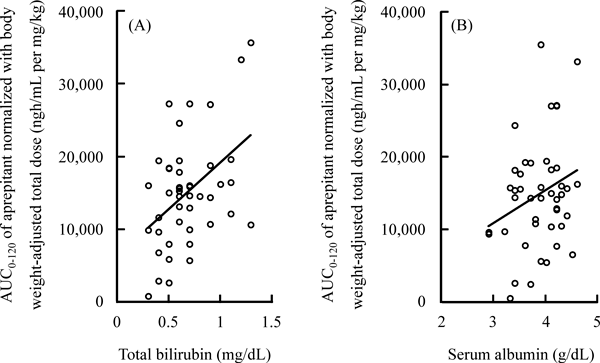
Fig. 2. Correlations between Total Bilirubin (A) or Serum Albumin (B) and AUC0–120 of Aprepitant Normalized with Body Weight-Adjusted Total Dose in Cancer Patients Receiving Cisplatin-Based Chemotherapy for the First Time (n=44)
There were 4 (9.1%), 10 (22.7%), and 30 (68.2%) patients with CYP3A5*1/*1, *1/*3, and *3/*3, respectively. The CYP3A5*3 allele frequency was 79.5%. The genotype frequency with CYP3A5*1/*1, *1/*3, and *3/*3 estimated using the Hardy–Weinberg principle were 4.2%, 32.6%, and 63.2%, respectively. The dose-normalized AUC0–120 of aprepitant was not significantly different between the CYP3A5*1 carrier group and CYP3A5*3/*3 group (medians and interquartile ranges, 16008 and 13201–18561 ng h/mL per mg/kg and 14534 and 8091–16559 ng h/mL per mg/kg, p=0.12, Fig. 3).
Stepwise Multiple Regression Analysis for Plasma Exposure of AprepitantDose-normalized AUC0–120 of aprepitant was significantly correlated with only T-Bil in multiple regression analysis (β=0.454, p<0.01, VIF=1.00). The acquired equation accounted for 18.7% of the interindividual variability in dose-normalized AUC0–120 of aprepitant (p<0.01).
Discussion
The present study characterized the plasma pharmacokinetics of aprepitant in clinical settings. The plasma pharmacokinetics of aprepitant varied markedly in cancer patients receiving cisplatin-based chemotherapy for the first time and were correlated with the level of T-Bil. The data from this study provides the significant information concerning to the diversity of aprepitant pharmacokinetics, because patients enrolled in this study did not have gastrointestinal disease and the clinical laboratory values of them were within their normal reference levels. To the best of our knowledge, this is the first report to characterize the pharmacokinetics of aprepitant and reveal their influence of laboratory tests and CYP3A5 gene polymorphisms in clinical settings.
In the present study, the plasma pharmacokinetics of aprepitant showed interindividual differences, and was not correlated with body weight. Nakade et al. also reported that body weight affected the oral clearance of aprepitant.10) This inconsistency between the current study and their report on the contribution of body weight to the plasma pharmacokinetics of aprepitant is most likely due to the narrower range of the body weights in our study (40–85 kg) compared to their patients (33–93 kg). Earlier studies with various doses of aprepitant indicated some nonlinearity in the disposition of aprepitant, reflecting saturation of metabolism and decreased clearance with an increasing dose.4,10,18) The low oral bioavailability of aprepitant was also reported to be attributed to its slow dissolution rate, poor permeability across the intestinal mucosa, or first-pass metabolism in the gut and liver.5)
Higher T-Bil was correlated with a higher plasma exposure to aprepitant in a univariate analysis. Multiple regression analysis also revealed that T-Bil affected the pharmacokinetics of aprepitant in the present study. This correlation may be due to increased absorption of aprepitant via the mixed micelle formation of bile salts, which could increase the rate of dissolution. The absorption of aprepitant with poor aqueous solubility is limited in the upper gastrointestinal tract.5) The correlation may occur due to decreased biliary excretion of aprepitant, because aprepitant was almost exclusively eliminated after metabolism and via the feces.11,12) Although bilirubin is one of the hepatic functional markers for liver injury, the T-Bil value of all study patients was within the normal reference range. These results indicate that the influence of T-Bil on the pharmacokinetics of aprepitant may be remarkable, because T-Bil affected the plasma exposure of aprepitant despite the normal reference range.
Univariate analysis showed that the level of Alb was statistically tended to be correlated with the plasma exposure to aprepitant, however, multiple regression analysis was not able to ascertain the influence of Alb on the pharmacokinetics of aprepitant in this study. This discrepancy between the univariate analysis and the multivariate analysis on the contribution of Alb to the pharmacokinetics of aprepitant can be explained based on the significant correlation between the level of T-Bil and that of Alb using Pearson’s correlation coefficient test.
The plasma exposure to aprepitant was not correlated with AST, ALT, or γ-GTP in this study. Nakade et al. reported that ALT affected the oral clearance of aprepitant,10) although their study did not examine linear correlation. These enzyme activities are affected by not only hepatic function,19) but also by the extent of liver fat accumulation,20) insulin resistance,20,21) inflammation,22) and oxidative stress.22,23) Several cohort studies have shown that AST,24) ALT,20,21) and γ-GTP20,21) levels are associated with the development of diabetes. The levels of these enzymes would not be specific markers affecting aprepitant pharmacokinetics.
The level of plasma exposure to aprepitant was not linearly correlated with BUN and Cre in this study. Nakade et al. reported that an increase in the oral clearance of aprepitant was associated with an increase in BUN.10) However, BUN and Cre were within their normal reference levels in that study (the medians of BUN and Cre were 13.8 mg/dL and 0.79 mg/dL, respectively). Aprepitant is eliminated by hepatic metabolism rather than renal excretion.10) The contribution of renal function to the pharmacokinetic variability of aprepitant would be smaller than hepatic function.
Age and gender were not significantly correlated with the level of plasma exposure to aprepitant in the present study. Nakade et al. reported that age had an effect on the oral clearance of aprepitant,10) although their study did not examine any possible linear correlation. Aging was reported to be associated with reductions in hepatic and renal function and alterations in plasma protein concentration.25,26) However, age-related changes in the physiology of the liver and kidney would not affect aprepitant pharmacokinetics because patients enrolled in this study had normal hepatic and renal function regardless of their age. With respect to gender, our result supported that of the report of Nakade et al.10) which found that gender had no significant effect on aprepitant pharmacokinetics.
Plasma exposure to aprepitant in CYP3A5*1/*1 and *1/*3 was similar to that in CYP3A5*3/*3 in this study. The discrepancy between the current study and the Hardy–Weinberg principle on the values of the genotype frequency is most likely due to the small sample size in our study. However, the Japanese allele frequency of CYP3A5*3 is 0.7675,17) which is similar to that found in the present study (0.7954). CYP3A5 is polymorphically expressed in individuals carrying the wild-type CYP3A5*1 allele, and homozygous subjects with CYP3A5*3 are considered to lack CYP3A5 activity.14) CYP3A5 shows approximately 85% amino acid sequence identity and has large overlapping substrates with CYP3A4.27) These findings indicate that the contribution of CYP3A5 A6986G gene polymorphisms to aprepitant AUC was smaller than non-genetic factors. In addition, CYP3A5 is not the rate limiting enzyme for aprepitant metabolism.
This study indicates that the level of T-Bil had an effect on the plasma exposure of aprepitant in patients with otorhinolaryngology/head and neck surgery cancers and urology cancers. We performed the statistical analysis using univariate and multivariate analysis to support our clinical results. The influence of radiation therapy on the pharmacokinetics of aprepitant would be small because the radiation therapy was performed except to the abdomen in the present study. Further study is needed to clarify the relationship between many chemotherapy regimens or the clinical laboratory values after its chemotherapy and aprepitant pharmacokinetics, because our study population was limited to patients described above. As a limitation of the present study, the accurate AUC of aprepitant could not calculate because of the small blood sampling point. However, 3-day oral aprepitant yielded high plasma concentrations for the greater part of the 120-h postdosing period in almost all this study patients. The more solid conclusion on the clinical implication of T-Bil is needed in populations containing other cancer types, thereby providing adequate information in order to avoid excessive increases in aprepitant plasma concentrations in patients with increased T-Bil.
In conclusion, the plasma levels of aprepitant varied markedly in cancer patients receiving cisplatin-based chemotherapy for the first time and were correlated with the level of T-Bil. The results from this study provides the significant information concerning to the diversity of aprepitant pharmacokinetics.
References
- 1) Hesketh PJ, Grunberg SM, Gralla RJ, Warr DG, Roila F, de Wit R, Chawla SP, Carides AD, Ianus J, Elmer ME, Evans JK, Beck K, Reines S, Horgan KJ. The oral neurokinin-1 antagonist aprepitant for the prevention of chemotherapy-induced nausea and vomiting: a multinational, randomized, double-blind, placebo-controlled trial in patients receiving high-dose cisplatin—The Aprepitant Protocol 052 Study Group. J. Clin. Oncol., 21, 4112–4119 (2003).
- 2) Poli-Bigelli S, Rodrigues-Pereira J, Carides AD, Julie Ma G, Eldridge K, Hipple A, Evans JK, Horgan KJ, Lawson F, Aprepitant Protocol 054 Study Group. Addition of the neurokinin 1 receptor antagonist aprepitant to standard antiemetic therapy improves control of chemotherapy-induced nausea and vomiting. Results from a randomized, double-blind, placebo-controlled trial in Latin America. Cancer, 97, 3090–3098 (2003).
- 3) Warr DG, Hesketh PJ, Gralla RJ, Muss HB, Herrstedt J, Eisenberg PD, Raftopoulos H, Grunberg SM, Gabriel M, Rodgers A, Bohidar N, Klinger G, Hustad CM, Horgan KJ, Skobieranda F. Efficacy and tolerability of aprepitant for the prevention of chemotherapy-induced nausea and vomiting in patients with breast cancer after moderately emetogenic chemotherapy. J. Clin. Oncol., 23, 2822–2830 (2005).
- 4) Majumdar AK, Howard L, Goldberg MR, Hickey L, Constanzer M, Rothenberg PL, Crumley TM, Panebianco D, Bradstreet TE, Bergman AJ, Waldman SA, Greenberg HE, Butler K, Knops A, De Lepeleire I, Michiels N, Petty KJ. Pharmacokinetics of aprepitant after single and multiple oral doses in healthy volunteers. J. Clin. Pharmacol., 46, 291–300 (2006).
- 5) Wu Y, Loper A, Landis E, Hettrick L, Novak L, Lynn K, Chen C, Thompson K, Higgins R, Batra U, Shelukar S, Kwei G, Storey D. The role of biopharmaceutics in the development of a clinical nanoparticle formulation of MK-0869: a Beagle dog model predicts improved bioavailability and diminished food effect on absorption in human. Int. J. Pharm., 285, 135–146 (2004).
- 6) Tattersall FD, Rycroft W, Francis B, Pearce D, Merchant K, MacLeod AM, Ladduwahetty T, Keown L, Swain C, Baker R, Cascieri M, Ber E, Metzger J, MacIntyre DE, Hill RG, Hargreaves RJ. Tachykinin NK1 receptor antagonists act centrally to inhibit emesis induced by the chemotherapeutic agent cisplatin in ferrets. Neuropharmacology, 35, 1121–1129 (1996).
- 7) Huskey SE, Dean BJ, Bakhtiar R, Sanchez RI, Tattersall FD, Rycroft W, Hargreaves R, Watt AP, Chicchi GG, Keohane C, Hora DF, Chiu SH. Brain penetration of aprepitant, a substance P receptor antagonist, in ferrets. Drug Metab. Dispos., 31, 785–791 (2003).
- 8) Bergström M, Hargreaves RJ, Burns HD, Goldberg MR, Sciberras D, Reines SA, Petty KJ, Ogren M, Antoni G, Långström B, Eskola O, Scheinin M, Solin O, Majumdar AK, Constanzer ML, Battisti WP, Bradstreet TE, Gargano C, Hietala J. Human positron emission tomography studies of brain neurokinin 1 receptor occupancy by aprepitant. Biol. Psychiatry, 55, 1007–1012 (2004).
- 9) Van Laere K, De Hoon J, Bormans G, Koole M, Derdelinckx I, De Lepeleire I, Declercq R, Sanabria Bohorquez SM, Hamill T, Mozley PD, Tatosian D, Xie W, Liu Y, Liu F, Zappacosta P, Mahon C, Butterfield KL, Rosen LB, Murphy MG, Hargreaves RJ, Wagner JA, Shadle CR. Equivalent dynamic human brain NK1-receptor occupancy following single-dose i.v. fosaprepitant vs. oral aprepitant as assessed by PET imaging. Clin. Pharmacol. Ther., 92, 243–250 (2012).
- 10) Nakade S, Ohno T, Kitagawa J, Hashimoto Y, Katayama M, Awata H, Kodama Y, Miyata Y. Population pharmacokinetics of aprepitant and dexamethasone in the prevention of chemotherapy-induced nausea and vomiting. Cancer Chemother. Pharmacol., 63, 75–83 (2008).
- 11) Huskey SE, Dean BJ, Doss GA, Wang Z, Hop CE, Anari R, Finke PE, Robichaud AJ, Zhang M, Wang B, Strauss JR, Cunningham PK, Feeney WP, Franklin RB, Baillie TA, Chiu SH. The metabolic disposition of aprepitant, a substance P receptor antagonist, in rats and dogs. Drug Metab. Dispos., 32, 246–258 (2004).
- 12) Sanchez RI, Wang RW, Newton DJ, Bakhtiar R, Lu P, Chiu SH, Evans DC, Huskey SE. Cytochrome P450 3A4 is the major enzyme involved in the metabolism of the substance P receptor antagonist aprepitant. Drug Metab. Dispos., 32, 1287–1292 (2004).
- 13) Chavez-Eng CM, Constanzer ML, Matuszewski BK. Simultaneous determination of Aprepitant and two metabolites in human plasma by high-performance liquid chromatography with tandem mass spectrometric detection. J. Pharm. Biomed. Anal., 35, 1213–1229 (2004).
- 14) Kuehl P, Zhang J, Lin Y, Lamba J, Assem M, Schuetz J, Watkins PB, Daly A, Wrighton SA, Hall SD, Maurel P, Relling M, Brimer C, Yasuda K, Venkataramanan R, Strom S, Thummel K, Boguski MS, Schuetz E. Sequence diversity in CYP3A promoters and characterization of the genetic basis of polymorphic CYP3A5 expression. Nat. Genet., 27, 383–391 (2001).
- 15) Constanzer ML, Chavez-Eng CM, Dru J, Kline WF, Matuszewski BK. Determination of a novel substance P inhibitor in human plasma by high-performance liquid chromatography with atmospheric pressure chemical ionization mass spectrometric detection using single and triple quadrupole detectors. J. Chromatogr. B Analyt. Technol. Biomed. Life Sci., 807, 243–250 (2004).
- 16) U.S. Food and Drug Administration. “Guidance for industry bioanalytical method validation.”: ‹http://www.fda.gov/downloads/Drugs/GuidanceComplianceRegulatroyInformation/Guidances/UCM070107.pdf›, cited 6 October, 2011.
- 17) Fukuen S, Fukuda T, Maune H, Ikenaga Y, Yamamoto I, Inaba T, Azuma J. Novel detection assay by PCR-RFLP and frequency of the CYP3A5 SNPs, CYP3A5*3 and *6, in a Japanese population. Pharmacogenetics, 12, 331–334 (2002).
- 18) Takahashi T, Nakamura Y, Tsuya A, Murakami H, Endo M, Yamamoto N. Pharmacokinetics of aprepitant and dexamethasone after administration of chemotherapeutic agents and effects of plasma substance P concentration on chemotherapy-induced nausea and vomiting in Japanese cancer patients. Cancer Chemother. Pharmacol., 68, 653–659 (2011).
- 19) Teschke R, Brand A, Strohmeyer G. Induction of hepatic microsomal gamma-glutamyltransferase activity following chronic alcohol consumption. Biochem. Biophys. Res. Commun., 75, 718–724 (1977).
- 20) Doi Y, Kubo M, Yonemoto K, Ninomiya T, Iwase M, Tanizaki Y, Shikata K, Iida M, Kiyohara Y. Liver enzymes as a predictor for incident diabetes in a Japanese population: the Hisayama study. Obesity (Silver Spring), 15, 1841–1850 (2007).
- 21) Wannamethee SG, Shaper AG, Lennon L, Whincup PH. Hepatic enzymes, the metabolic syndrome, and the risk of type 2 diabetes in older men. Diabetes Care, 28, 2913–2918 (2005).
- 22) Yamada J, Tomiyama H, Yambe M, Koji Y, Motobe K, Shiina K, Yamamoto Y, Yamashina A. Elevated serum levels of alanine aminotransferase and gamma glutamyltransferase are markers of inflammation and oxidative stress independent of the metabolic syndrome. Atherosclerosis, 189, 198–205 (2006).
- 23) Kugelman A, Choy HA, Liu R, Shi MM, Gozal E, Forman HJ. gamma-Glutamyl transpeptidase is increased by oxidative stress in rat alveolar L2 epithelial cells. Am. J. Respir. Cell Mol. Biol., 11, 586–592 (1994).
- 24) Nannipieri M, Gonzales C, Baldi S, Posadas R, Williams K, Haffner SM, Stern MP, Ferrannini E, Mexico City diabetes study. Liver enzymes, the metabolic syndrome, and incident diabetes: the Mexico City diabetes study. Diabetes Care, 28, 1757–1762 (2005).
- 25) Le Couteur DG, McLean AJ. The aging liver. Drug clearance and an oxygen diffusion barrier hypothesis. Clin. Pharmacokinet., 34, 359–373 (1998).
- 26) Mühlberg W, Platt D. Age-dependent changes of the kidneys: pharmacological implications. Gerontology, 45, 243–253 (1999).
- 27) Rosso Felipe C, de Sandes TV, Sampaio EL, Park SI, Silva HT Jr, Medina Pestana JO. Clinical impact of polymorphisms of transport proteins and enzymes involved in the metabolism of immunosuppressive drugs. Transplant. Proc., 41, 1441–1455 (2009).

