Regular Articles
Infiltration of M1 Macrophages into Adipose Tissue of ddY-H Mice Preceding Spontaneous Appearances of Insulin Resistance
2013 Volume 36 Issue 5 Pages 825-832

Details
2013 Volume 36 Issue 5 Pages 825-832
We have isolated insulin resistant mice (ddY-H mice) which are spontaneously induced at 12-weeks of age even if fed with the standard chow pellets. Since accumulated evidences have suggested that an appearance of insulin resistance is associated with obesity and a state of inflammation in adipose tissue, the present study investigated an appearance of macrophages in adipose tissue of ddY-H mice. Although ddY-H mice were fed the standard chow pellets ad libitam, increases in body weight, adipose tissue mass, and fat cell size were observed. In adipose tissues of ddY-H mice, gene expression of monocyte chemoattractant protein-1 (MCP-1) elevated slightly at 5-weeks of age and was maintained at higher levels at 9- and 12-weeks of age, and MCP-1 content in adipose tissue increased 2-fold at 12-weeks of age. Also, increased gene expressions of CD68 and F4/80, markers of macrophage, in adipose tissue were observed at 9-weeks of age. In addition, F4/80 positive cells were histologically found in adipose tissue at 15-weeks of age but not at 7-weeks of age, suggesting an increased infiltration of macrophage into adipose tissue. In adipose tissue of ddY-H mice, gene expressions of CD11c and toll-like receptor 4 (TLR4), markers of proinflammatory macrophages (M1), markedly increased although those of CD163 and mannose receptor (MR), markers of anti-inflammatory macrophages (M2), did not change. These results suggest that proinflammatory (M1) macrophages infiltrate into enlarged adipose tissues of ddY-H mice, which is preceding spontaneous appearance of insulin resistance.
Adipose tissue is an important endocrine organ which secretes a number of adipocytokines such as leptin, adiponectin, and monocyte chemoattractant protein-1 (MCP-1).1–4) Dysregulation of adipocytokine production may be involved in a variety of pathologic processes.2,5–7) Strong positive correlations exist between degree of adiposity and obesity-associated disorders, such as hypertension and glucose intolerance.8,9) Visceral fat mass is closely correlated with obesity-associated pathology more than overall adiposity.10,11) Accumulated evidences suggests that macrophages infiltrate into obese adipose tissue to activate inflammatory process.12,13) Infiltration of macrophages into adipose tissue is caused by an increased production of MCP-1 in the tissue.14–16) Macrophage infiltration and inflammation in adipose tissue are suggested to be associated with the development of insulin resistance in obese animals and humans.14–17) Recent studies have indicated that adipose tissue macrophages in obesity show significant heterogeneity in their function, which are proinflammatory (M1) macrophage and anti-inflammatory (M2) macrophages, and diet-induced obesity leads to a shift in the activation state of adipose tissue macrophages from an M2-polarized state to an M1 proinflammatory state that contributes to insulin resistance.18,19) However, the molecular mechanisms underlying macrophage polarization in adipose tissue remain to be elucidated.
We previously showed that sustained hyperglycemia could be induced in ddY mice by re-feeding them with standard chow pellets after a 48 h-fasting.20) By selective breeding based on serum glucose levels after re-feeding, two strains, namely spontaneous insulin resistant mice (ddY-H) and non-insulin resistant mice (ddY-L), have been isolated from ddY mice.21) The clinical characteristics of ddY-H mice resemble a common form of type 2 diabetes in humans, with an age-dependent onset, mild obesity, insulin resistance and hypertriglyceridemia.21) On the other hand, ddY-L mice are lean and do not show insulin resistance at any weeks of age. Studies of macrophage recruitment into adipose tissue have been mainly carried out by using obese models induced by high-fat feeding.15,18,22–24) The ddY-H mice develop mild obesity, even if fed with standard chow pellets ad libitum.15) In this study, we investigated macrophage recruitment in adipose tissue of ddY-H mice, the spontaneous insulin resistant mice, by comparing with that of ddY-L mice.
Aprotinin and Somnopentyl® were purchased from Wako Pure Chemical Industries, Ltd. (Osaka, Japan) and Schering-Plough Co. (NJ, U.S.A.), respectively.
Animal CareFour-week-old male ddY mice were purchased from SLC Inc. (Hamamatsu, Japan), and male ddY-H mice and male ddY-L mice from our own colony were used. The mice were maintained on 12 h light/dark cycles (light from 08:00 to 20:00) with free access to standard chow pellets (MF diet, Oriental Yeast Co., Ltd., Tokyo, Japan) and water ad libitum until the experiments were carried out. Body mass index (BMI) was calculated according to the following formula: body weight (g)/body length2 (cm2). As body length, the length between the top of nose and the base of tail was measured while the mice were under anesthesia by Somnopentyl®. Mice were killed at 13:00 after 4 h-fasting to avoid acute effects of food intake.
Animal care and experiments were performed in accordance with the guidelines for the care and use of laboratory animals of the University of Shizuoka, Japan.
Measurement of Fat Cell SizesUnder anesthesia with Somnopentyl®, epididymal adipose tissues were excised from five mice at respective ages, and photographs were taken under the microscope with a magnification of 200-fold. The average of length and breadth of 200 fat cells (5- and 9-week-old) and 400 fat cells (12-week-old) in one adipose tissue were measured and the averages of them were calculated as a cell size.
Immunohistochemistry of Adipose TissueTo assess the macrophage infiltration in the adipose tissue, samples of an epididymal adipose tissues were fixed in 10% buffered formalin, processed, embedded in paraffin, and sectioned. The macrophages were stained using rat monoclonal F4/80 antibody (Novus Biologicals, U.S.A.) and Histostain®-SP Kit (ZYMED® Laboratories, U.S.A.) in which F4/80-reactive macrophages were visualized by coloring with diaminobentizine (DAB).
Measurement of MCP-1 in Adipose Tissue and PlasmaBlood was collected and epididymal adipose tissues were excised from mice sacrificed by decapitation. Plasma was separated by centrifugation and was stored at −80°C until measurement was carried out. Sections of adipose tissue (0.5 g) were homogenized in 5 mL of phosphate buffered saline containing aprotinin (1 µg/mL) and Homogenate was centrifuged by 3000 rpm at 4°C. After removal of the lipid layer, the supernatant was used for determination of MCP-1. MCP-1 in plasma and adipose tissue was measured by Mouse MCP-1 ELISA Kit (Endogen®, U.S.A.)
Gene Expression Analysis in Adipose TissueFrom mice sacrificed at 13:00 after a 4-hour fasting, epididymal adipose tissues were excised. Total RNA was isolated by RNeasy Lipid Tissue Mini Kit (QIAGEN, U.S.A.). Reverse transcription-polymerase chain reaction (RT-PCR) was performed using TaKaRa RNA PCR Kit (TaKaRa, Tokyo, Japan) according to references for MCP-1,24) F4/80,15) CD68,15) CD11c,25) toll-like receotor-4 (TLR4),25) CD163,25) mannose receptor (MR),25) and β-actin.26) Primers, which were purchased from Invitrogen (Carlsberg, CA, U.S.A.), were as follows: MCP-1, forward, 5′-CTT CTG GGC CTG CTG TTC A-3′, reverse, 5′-CCA GCC TAC TCA TTG GGA TCA -3′; F4/80, forward, 5′-CTT TGG CTA TGG GCT TCC AGT C-3′, reverse, 5′-GCA AGG AGG ACG AGT TTA TCG TG-3′, CD68, forward, 5′-CTT CCC ACA GGC AGC ACA G-3′, reverse, 5′-AAT GAT GAG AGG CAG CAA GAG G-3′; CD11c, forward, 5′-CTG GAT AGC CTT TCT TCT GCT G-3′, reverse,5′-GCA CAC TGT GTC CGA ACT C-3′; TLR4, forward, 5′-AGA AAT TCC TGC AGT GGG TCA -3′, reverse, 5′-TCT CTA CAG GTG TTG CAC ATG TCA -3′; CD163, forward, 5′-GGG TCA TTC AGA GGC ACA CTG -3′, reverse, 5′-CTG GCT GTC CTG TCA AGG CT-3′; MR, forward, 5′-CGG TGA ACC AAA TAA TTA CCA AAA T-3′, reverse, 5′-GTG GAG CAG GTG TGG GCT -3′; β-actin, forward, 5′-TGG AAT CCT GTG GCA TCC ATG AAA C-3′, reverse, 5′-TAA AAC GCA GCT CAG TAA CAG TCC G-3′. The amplification products obtained by RT-PCR were mixed with 10× Loading Buffer (TaKaRa, Tokyo, Japan) and were electorophoretically separated on 2% agarose gel. Gels were stained with ethidium bromide (Nippom Gene, Tokyo, Japan) and images of fluorescent bands were photographed by E-Graph AE-9000 (Atto Incorporation, Tokyo, Japan). Fluorescence intensity was evaluated by Image J and normalized to β-actin.
Data and Statistical AnalysisOne-way analysis of variance (ANOVA) was used to compare the means among different groups, and Tukey’s test was used in the post hoc multiple comparison. Statistical significance was set at p<0.05.
Figure 1A depicts body weights of ddY mice, ddY-H mice, and ddY-L mice fed with the standard chow pellets ad libitum body weights of ddY-H mice were significantly higher than those of ddY mice, the original strain, at 7- and higher-weeks of age, but lower weights were observed in ddY-L mice at 9- and higher-weeks of age. The body mass index (mean±S.E. of 20 mice) in ddY-H mice was 0.46±0.02, which was significantly higher than those in ddY mice (0.41±0.02) and in ddY-L mice (0.38±0.01) at 15-weeks of age.
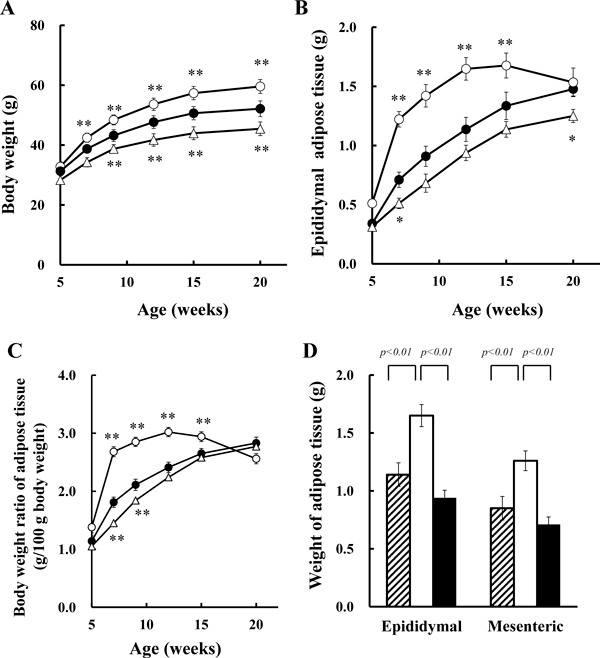
(A) Body weights, (B) epididymal adipose tissue weights, (C) body weight ratio of epididymal adipose tissues of ddY mice (closed circle), ddY-H mice (open circle), ddY-L mice (open triangle). (D) Weights of epididymal adipose tissues and mesenteric adipose tissues of 12-week-old ddY mice (shaded columns), ddY-H mice (open column), and ddY-L mice (closed column). Each column and symbol plus bar represents the mean and S.E. of 20 mice. ** p<0.01, * p<0.05 vs. ddY.
Figure 1B depicts epididymal adipose tissue weight. Increased weights of epididymal adipose tissues in ddY-H mice were found at 7-, 9-, 12- and 15-weeks of age, but not at 20-weeks of age. Weights of epididymal adipose tissues in ddY-L mice tended to be low. Body weight ratios of epididymal adipose tissues in ddY-H mice, as shown in Fig. 1C, increased markedly at 7-weeks of age, and maintained at significant high levels at 9-, 12- and 15-weeks of age. Weights of epididymal and mesenteric adipose tissues of ddY-H mice at 12-weeks of age were significantly high compared to those in ddY mice (Fig. 1D). These results indicated that visceral fat mass increased in ddY-H mice. On the other hand, a tendency of lower weight of both tissues in ddY-L mice was observed.
Size of AdipocyteIt is well known that hypertrophy of adipose tissue is usually associated with increases in size and number of fat cells.27) Microscopic photographs of fresh tissues in ddY-H mice at 12-weeks of age show a certain increase in fat cell size compared with those in ddY mice and ddY-L mice. (Fig. 2) Although, as shown in Fig. 3A, no difference between ddY mice and ddY-L mice was observed in the distribution of fat cell size, the distribution in ddY-H mice shifted to the right, meaning that fat cell sizes were increased. (Fig. 3A) The average of fat cell size in adipose tissues of ddY-H mice was significantly increased at 9- and 12-weeks of age (Fig. 3B).

Epididymal adipose tissues were excised from ddY mice (A), ddY-H mice (B) and ddY-L mice (C) at 12-weeks of age.
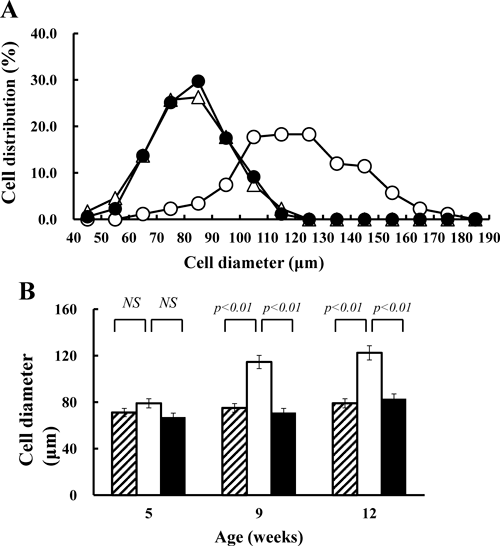
Diameters of 1000 (5- and 9-weeks old) and 2000 (12-weeks old) fat cells in five mice were measured as described in Materials and Methods. (A) Distributions of fat cell size in epididymal adipose tissues of ddY (closed circle), ddY-H (open circle) and ddY-L (open triangle) male mice at 12-weeks of age. (B) Average of fat cell diameters in epididymal adipose tissues of ddY (shaded column), ddY-H (open column) and ddY-L (closed column) at 5-, 9- and 12-weeks of age. Each column plus bar represents the mean and S.D. of 1000 or 2000 cells.
It has been reported that macrophage infiltration and gene expressions of inflammatory cytokines are increased in adipose tissue of obesity. MCP-1 is derived from adipocytes and macrophages in adipose tissue, and plays a critical role in the recruitment of macrophage into obese adipose tissue.15–17) Plasma MCP-1 concentration is known to elevate in the plasma of obese mouse models. MCP-1 in plasma of ddY-H mice and ddY-L mice were measured by the Mouse MCP-1 ELISA Kit (Endogen®, U.S.A.), but the concentrations were undetectable (data not shown). Then, MCP-1 contents were measured in epididymal adipose tissues. Although no differences in MCP-1 contents was found in adipose tissues of ddY mice, ddY-H mice and ddY-L mice at five- and nine-weeks of age, its marked increase in adipose tissue of ddY-H mice compared to those in ddY mice and ddY-L mice was found at 12-weeks of age (Fig. 4).
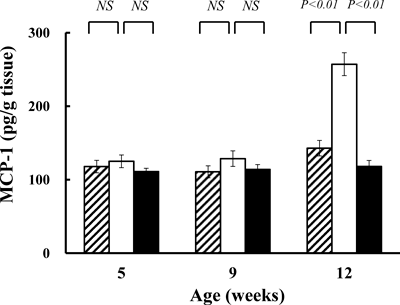
Epididymal adipose tissues (0.5 g) were homogenized in 1 mL of PBS containing aprotinin (µg/mL) and, after centrifugation, MCP-1 in the supernatant was measured as described in Materials and Methods. Each column plus bar represents the mean and S.E. of 13 mice.
Since MCP-1 content in adipose tissue of ddY-H mice increased as mentioned above, gene expression of MCP-1 was examined in epididymal adipose tissues of ddY mice, ddY-H mice, and ddY-L mice. Expression of MCP-1 in ddY-H mice was fairly elevated at 5-weeks of age (Figs. 5A, B) and marked increases in those were found at 9- and 12-weeks of age (Figs. 5A, B). On the other hand, no differences were observed in ddY mice and ddY-L mice at 12-weeks of age (Figs. 5A, B).
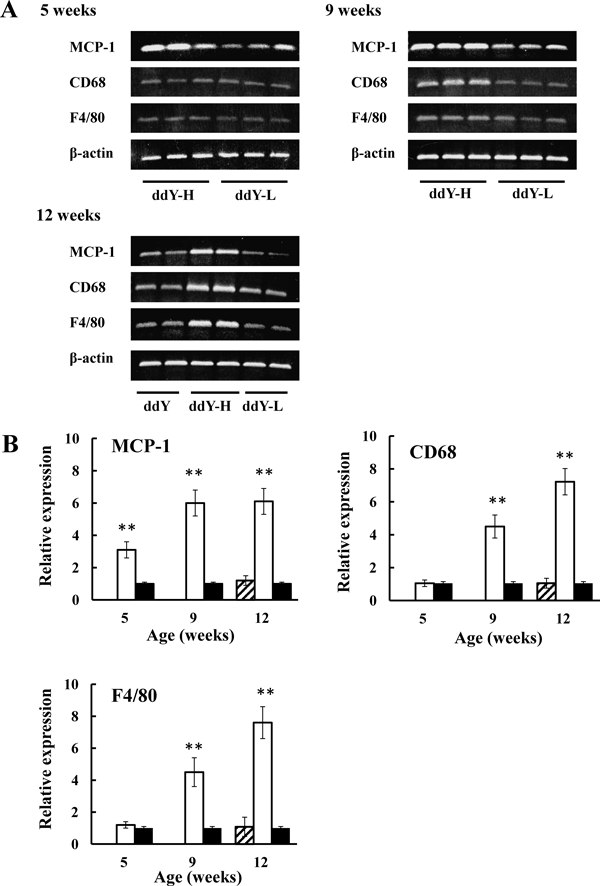
(A) Representative bands of gene expression separated on agarose gel. (B) Relative gene expressions of MCP-1, CD68, and F4/80 in ddY (shaded column) and ddY-H (open column) mice to those in ddY-L mice (closed column). Data are expressed as the mean and S.E. of 5 mice. ** p<0.01 vs. ddY-L.
To verify an appearance of macrophage in adipose tissue of ddY-H mice, gene expressions of CD68 and F4/80, markers of macrophage, were examined. (Figs. 5A, B) Although no difference was observed at 5-weeks of age, marked increases in expressions of CD68 and F4/80 were found in adipose tissue of ddY-H mice at 9- and 12-weeks of age. On the other hand, no differences were observed in ddY mice and ddY-L mice at 12-weeks of age.
Histological Examination of Adipose TissueTo confirm increased infiltration of macrophages into adipose tissue of ddY-H mice, epididymal adipose tissue of ddY-H mice and ddY-L mice were immunologically stained with an F4/80 antibody. As shown in Fig. 6A, an F4/80 positive cell was not observed in adipose tissue of ddY-H mice at 7-weeks of age, but many positive cells appeared at 15-weeks of age (Fig. 6C). On the other hand, F4/80 positive cells were hardly found in adipose tissues of ddY-L mice at 7- and 15-weeks of age (Figs. 6B, D). This histological finding certified an increase in macrophage infiltration into adipose tissue of ddY-H mice.
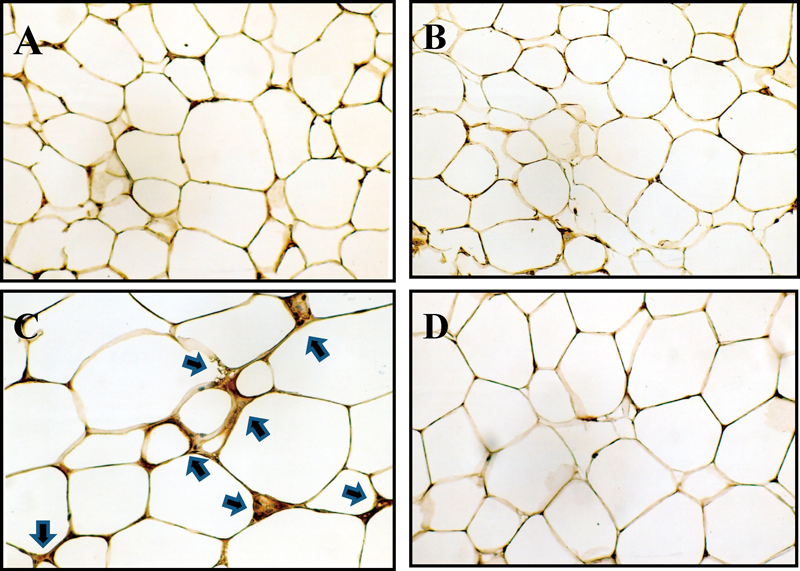
Epididymal adipose tissues were excised from mice and were fixed with formalin followed to stain F4/80 positive cell as described in Materials and Methods. Arrows indicate F4/80 positive cells. (A) 7-week-old ddY-H mice, (B) 7-week-old ddY-L mice, (C) 15-week-old ddY-H mice, (D) 15-week-old ddY-L mice.
Recent studies have pointed the heterogeneity of adipose tissue macrophages in obesity, proinflammatory macrophages (M1 macrophages) and anti-inflammatory macrophage (M2 macrophages).18,19) Gene expressions of their markers were analyzed in epididymal adipose tissues of ddY-H mice and ddY-L mice. As shown in Fig. 7A, gene expressions of CD11c, a marker of M1 macrophage, was increased in ddY-H mice at 9-, 12-, and 14-weeks of age, but not at 5-weeks of age. At 14-weeks of age, gene expression of TLR-4, an another marker of M1 macrophage, was increased and those of CD163 and MR, markers of M2 macrophage, were not changed (Fig. 7B). These findings suggest that infiltrations of M1 macrophages were increased at 9-weeks of age and were maintained until 14-weeks of age.
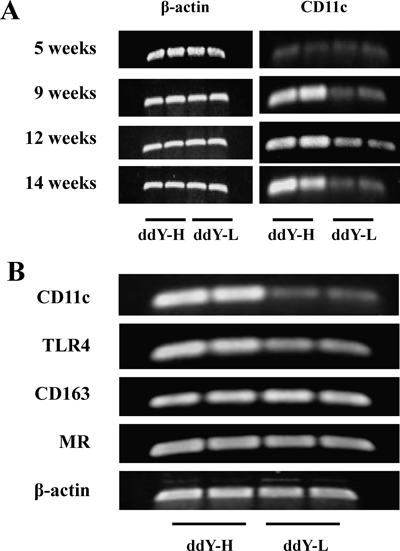
(A) mRNA expressions of CD11c and β-actin in adipose tissue of mice at 5-, 9-, 12- and 14-weeks of age were examined, and representative bands separated electrophoretically on agarose gel were shown. (B) Gene expressions of macrophage markers and β-actin in adipose tissues of mice at 14-weeks of age were examined, and representative bands separated electrophoretically on agarose gel were shown.
We have isolated two strains, namely spontaneous insulin resistant mice (ddY-H) and non-insulin resistant mice (ddY-L), from ddY mice.21) The ddY-H mice are observed to have an age-dependent onset, mild obesity, insulin resistance and hypertriglyceridemia, which resemble a common form of type 2 diabetes in humans. In this study, ddY-H mice exhibited enlargement of visceral fat mass and an elevation in body weight ratio of adipose tissue. Adipose tissue in ddY-H mice was quickly enlarged at seven-weeks of age, and enlargement of fat cell was confirmed at 9-weeks of age. Since insulin resistance was observed in ddY-H mice at 12-weeks of age but not at 9-weeks of age,21) enlargement of adipose tissues and fat cells preceded an appearance of insulin resistance. Enlargement of adipose tissue was found at 12- and 15-weeks of age, and weight of epididymal adipose tissue in ddY-H mice at 20-weeks of age was not different from those in ddY mice. Although its cause is not clear, hyperglycemia and glycosuria, which are observed in certain ddY-H mice at the age,21) may influence weights of adipose tissues.
A large number of investigations suggest that obesity gives rise to a state of chronic and low-grade inflammation in adipose tissue.17,28) A correlation between an increase in body weight and MCP-1 production has been reported.13) In ddY-H mice, gene expression of MCP-1 was fairly increased at 5-weeks of age and a definite elevation of it was seen at 9- and 12-weeks of age. However, MCP-1 content in adipose tissue was increased at 12-weeks of age but not at 9-weeks of age. There is an inconsistency between time courses of MCP-1 content and MCP-1 expression in adipose tissue of ddY-H mice. It has been reported that elevated production of MCP-1 in adipose tissue and infiltration of macrophages into adipose tissue are found in obesity induced by high-fat diet feeding15,18,22–24) or in db/db mice, severe obesity mice.15) In those cases, both of serum MCP-1 concentrations and MCP-1 content in adipose tissue were increased, and MCP-1 production must be abundant to elevate the concentrations. In contrast, obesity of ddY-H mice was definitely induced by fed with the standard chow pellets, but it was mild and serum MCP-1 concentration was not detectable. Production of MCP-1 may not be enough to elevate concentrations of serum and adipose tissue homogenate in ddY-H mice at 9-weeks of age. However, increases in gene expression of MCP-1 and production of MCP-1 protein were demonstrated in ddY-H mice at 12-weeks of age. The mechanism by which gene expression of MCP-1 in adipose tissue increased is not clear although a correlation between increases in MCP-1 gene expression and an enlargement of adipose tissue was seen.
Macrophages have been shown to infiltrate into obese adipose tissue, by increased production of MCP-1 in the tissue, and to activate inflammatory process.12–16) Over-expressions of MCP-1 in adipose tissue of adipocyte P2 promoter transgenic mice caused macrophage recruitment and insulin resistance.14) On the other hand, mice with targeted deletion in the genes of MCP-1 and its receptor, C–C motif chemokine receptor2 (Ccr2), revealed decreased macrophage content, decreased inflammation in adipose tissue, and protection from high-fat diet-induced insulin resistance.15,22) These findings indicate that macrophage infiltration into adipose tissue is associated with the development of insulin resistance in obese animals and humans. Macrophage infiltration into adipose tissue was mainly observed in obesity induced by high-fat diet feeding.15,18,22–24) Also, in genetically obese diabetic (db/db) mice, abundances of MCP-1 expressions and macrophage infiltrations in adipose tissue were demonstrated.15) ddY-H mice exhibited enlargement of adipose tissue and increment of MCP-1 production in adipose tissue, suggesting that macrophage infiltration may be induced. Appearance of macrophage in adipose tissue of ddY-H mice was suggested by increased gene expression of CD68 and F4/80, markers of macrophage, at 9- and 12-weeks of age. Macrophage infiltration was verified by histological appearance of F4/80 positive cells at 15-weeks of age. However it is not certain that increases in MCP-1 content and MCP-1 expression are enough to recruit macrophages into adipose tissue. In ddY-H mice, since insulin resistance is induced at 12-weeks of age,21) recruitment of macrophages precede an appearance of insulin resistance.
Lumeng et al. have shown adipose tissue macrophages in obesity exist as heterogenous form in their function, which are proinflammatory (M1) macrophages and anti-inflammatory (M2) macrophages.18,19) In diet-induced obesity, adipose tissue macrophages exhibit the phenotypic change from M2 to M1 during the course of obesity, thereby accelerating adipose tissue inflammation.18,26,29) However, it was suggested that an obesity-induced switch in macrophage activation is coupled to the recruitment of an inflammatory subtype from the circulation, but not to the conversion of M2 to M1.19) Although, in ddY-H mice, increased infiltration of macrophages was shown as described above, no change in gene expression of CD163 and MR, markers of M2 macrophage,25) was observed. However, increases in gene expressions of CD11c and TLR4, markers of M1 macrophage,25) were observed at 14-weeks old, suggesting that increased recruitment in adipose tissue of ddY-H mice was due to M1 macrophages. The increment of M1 macrophages in adipose tissue may be caused by recruitment of monocytes from the circulation, but not by the conversion of M2 to M1, since gene expressions of M2 markers did not change.
On the other hand, ddY-L mice tend to be lean, and adipose tissue mass has a tendency to be small compared with those of ddY mice. Since an uncommon occurrence of adiposity was observed in ddY mice at higher-weeks of age but not in ddY-L mice. In ddY-L mice, alterations such as enlargement of adipose tissue, increases in MCP-1 production, gene expressions of MCP-1 and macrophage markers, and macrophage infiltration into adipose tissue were not found at any age. Also insulin resistance is not induced in the lean mice by aging.21) Therefore it was indicated that ddY-L mice are appropriate for control mice to investigate insulin resistance induction and inflammation in adipose tissue of ddY-H mice.
In conclusion, inflammatory M1 macrophage infiltrates into enlarged adipose tissue of ddY-H mice, genetically insulin resistant mice, and the infiltration of macrophage precedes a spontaneous appearance of insulin resistance. It is noteworthy that ddY-H mice were fed with standard chow pellets ad libitum and the inflammatory changes in adipose tissue were spontaneously induced. Although molecular mechanism of M1 macrophage infiltration should be clarified, ddY-H mice might be a moderate mouse model for research concerned with macrophage recruitment into adipose tissue.