Abstract
The aim of this study was to determine whether α-lipoic acid (LA) is effective in blunting the detrimental effect of light to transformed retinal ganglion cells (RGC-5 cells) in culture. In this study, RGC-5 cells were exposed to light (400–760 nm; 1000 lx) for 48 h with or without LA. For cell assessment, 3-(4,5-dimethylthiazol-2-yl)-2,5-diphenyltetrazolium bromide (MTT) and 4-[3-(-iodophenyl)-2-(4-nitrophenyl)-2H-5-tetzolio]-1,3-benzene disulfonate (WST-1) reduction assays were used to assess cell and mitochondrial viability respectively. Furthermore, cells were stained for reactive oxygen species (ROS), Apoptosis DNA breakdown and Apoptosis membrane alteration. Antioxidant-capacity, glutathione (GSH) and gluthathione-S-transferase (GST) were determined as well. Light reduced cell viability, affected mitochondrial function, increased the number of terminal deoxynucleotidyl transferase-mediated deoxyuridine triphosphate nick-end labeling (TUNEL)-positive cells and enhanced labelling for ROS. These effects were all attenuated by the presence of LA. LA also stimulated GSH and GST. These findings support the view that light can affect mitochondria which could lead to retinal ganglion cell apoptosis and LA can blunt by decreasing ROS generation and stimulating GSH and GST.
Human retina is exposed mainly to the “visible component” of the electromagnetic spectrum from 400–760 nm.1) Studies have shown that irradiation of mammalian cells with visible light induces cellular damage primarily via reactive oxygen species (ROS).2) The levels of ROS are balanced at appropriate levels in healthy cells by some antioxidants (e.g. vitamins E and C) and a variety of enzymes [e.g. superoxide dismutase,3) catalase,4) glutathione peroxidase,5) but when cells are unable to keep the formation of these species in check, toxicity can result. ROS such as the hydroxyl radical, superoxide anion, and singlet oxygen can be produced when visible light excites cellular photosensitizers.6,7) A number of photosensitizers exist, including flavin-containing oxidases, the cytochrome system, heme-containing proteins, and tryptophan-rich proteins. The interaction of these chromophores with light can generate ROS, which in turn can damage lipids, proteins, and DNA.8) Recent researches have proven that mitochondrial respiratory chain enzymes, such as flavins and cytochrome oxidases are able to absorb light maximally around 440–450 nm, and as a consequence, can also contribute to the generation of ROS in cells and in the process induce oxidative stress.9–11) Importantly, oxidative stress and mitochondrial function are interrelated and are involved in the promotion and regulation of apoptosis.12)
Retinal ganglion cells, compare with other retinal neurons, might be particularly susceptible to light-induced injury because ganglion cells have a particularly rich supply of mitochondria, associated with their axons within the globe.13) It is well known that mitochondria are the major cellular site of energy production, and these organelles also play a key role in ROS generation, resulting in oxidative damage to neurons. So mitochondria are the major location of ROS production in the cell. It might be that ROS which generated by light acting on such mitochondria, are removed by the ganglion cells’ scavenging mechanisms in healthy cells. However, when the ganglion cells are in a state of energetic compromise, as might occur because of reduced optic nerve head blood flow caused by raised intraocular pressure or because of a genetic defect,14,15) the normal adequate scavenging mechanism of ROS becomes overburdened. The proposition has therefore been made that ROS, produced by light acting on mitochondrial photosensitizers, can become a risk factor to retinal ganglion cells, accumulation of free radicals can result in cell dysfunction and death, but only when the cells are in a compromised state, as in optic neuropathies like glaucoma and Leber’s Hereditary Optic Neuropathy (LHON).16)
α-Lipoic acid (LA) is a potent intracellular antioxidant that can induce all three cellular protective mechanisms.17) The physiologically relevant (R) form of lipoic acid is a coenzyme in mitochondria and has been shown to reverse the age-associated decline in mitochondrial function.18,19) Laboratory studies also have shown that LA significantly attenuated ischemia/reperfusion caused retinal damage in vivo.20) In addition, LA can act as an indirect antioxidant by inducing γ-glutamylcysteine ligase (GCL), the rate-controlling enzyme in gluthathione (GSH) synthesis, and other phase II enzymes that are involved in detoxification of xenobiotic compounds.
In the present study, we have investigated the role of oxidative stress in retinal ganglion cell death induced by light. Further, we have investigated the neuroprotective potential of LA. Our data indicate that treatment with light induces an increase in total cellular ROS generation and apoptotic cell death. We have demonstrated that pre-treatment with LA inhibits ROS production, prevents cells from undergoing apoptosis and enhances GSH synthesis. These results illustrate the potential of LA as a preventative therapeutic agent for the treatment of light induced cell apoptosis.
Materials and Methods
MaterialsCell culture media and reagents (including foetal bovine serum) were obtained from Invitrogen (Paisley, U.K.). Culture vessels and CellPlus charged-coat 96-well plates and 24-well plates were from Sarstedt (Leicester, U.K.). The terminal deoxynucleotidyl transferase (TdT)-aUTP-linked nick end labelling (TUNEL) System was obtained from Promega Corp. (Madison, WI, U.S.A.) and the 2′,7′-dihydroethidium (DHE) from Biochemical, U.K. The APOPercentage™ Apoptosis Assay were from Biocolor Ltd. (Newtownabbey, Northern Ireland). The filters used to absorb certain wavelengths of light were from Lee Filters (Andover, U.K.). 3-(4,5-Dimethylthiazol-2-yl)-2,5-diphenyltetrazolium bromide (MTT) and 4-[3-(-iodophenyl)-2-(4-nitrophenyl)-2H-5-tetzolio]-1,3-benzene disulfonate (WST-1) were from Roche Diagnostics (Indianapolis, IN, U.S.A.). Where not mentioned, all other chemicals were from Sigma Chemical Company (Poole, U.K.).
Light Treatment SystemA normal culture incubator was equipped with two 8 W strip-lights that could be adjusted to be 30–60 cm directly above a tray containing 24-well or 96-well plates with established retinal ganglion cells (RGC-5). The two strip-lights were covered with filters completely. The filters excluded light wavelengths below 400 nm (filter number 2CUV) to mimic the situation that occurs for retinal ganglion cells in situ. The intensity of light directed onto the cells was determined by use of a digital lux meter (LX-101, Lutron, U.K.).
Well-plates exposed to light or dark were present in the same incubator for 48 h. White paper covers were placed over the well-plates to set up dark situation. Using a electric fan to keep the temperature around 37°C to get rid of the temperature factor. And we also measured the temperature of culture medium and found no differences after being maintained in the light or dark conditions for 2 d.
MTT AssayThe assay used to assess cell viability was the MTT reduction assay modified from that of Mosmann.21) Surviving RGC-5 cells in 96-well plates were assayed as follows. Ten micro-liter of a 5 mg/mL MTT solution dissolved in Dulbecco’s modified Eagle’s medium (DMEM) was added to each well at a final concentration of 0.5 mg/mL and incubated at 37°C for 1 h. After this time, overturning and gently shaking the plates removed the supernatant. The plates were then allowed to dry at room temperature overnight. The dark blue formazan crystal precipitate at the base of each well was then solubilized by adding 100 µL of dimethyl sulfoxide (DMSO) detergent. After 15–30 min, the optical density of the solubilized formazan product in each well was measured using an automatic micro-plate reader (Titertek Plus, MS212; ICN Flow, Thame, U.K.) with a 570 nm test wavelength and a 690 nm reference wavelength.
WST-1 AssayRGC-5 cells in 96-well plates were analysed for mitochondrial dehydrogenase activity by using WST-1 assay. WST-1 is a tetrazolium dye containing an electron-coupling agent that is cleaved by mitochondrial dehydrogenases to a formazan dye with an absorbance at 490 nm.22) Mitochondrial dehydrogenase activity is directly related to mitochondrial energy production— a fall in activity suggests a reduced production.
Assessment of DNA Breakdown with the TUNEL ProcedureFor the TUNEL procedure, treated RGC-5 cells on coverslips were fixed for 30 min with 4% paraformaldehyde in 0.1 M sodium phosphate buffer (pH=7.4) and then washed in phosphate buffered saline (PBS) containing 0.1% triton X-100 (PBS-T). Fixed cells were washed initially in Tris buffer (10 mM Tris–HCl, pH=8.0) for 5 min and then exposed to 1% (v/v) H2O2 for 15 min to remove endogenous peroxidase activity. Following a further 5 min wash in Tris buffer, cells were pre-incubated with TdT buffer (30 mM Tris–HCl, pH=7.2, containing 140 mM sodium cacodylate and 1 mM cobalt chloride) for 10 min at 37°C. Subsequent to this the transferase reaction was performed by incubating for 90 min at 37°C with TdT buffer containing 0.25 units/µL of TdT and 40 µM biotin–16-dUTP. As a positive control for the labelling methodology some cells were treatment with DNase I (0.1 mg/mL) for 10 min prior to transferase reaction. The reaction was stopped by incubation in sodium citrate buffer (300 mM NaCl, 30 mM sodium citrate) for 2×15 min before blocking with 2% (w/v) bovine serum albumin (BSA) in PBS for 10 min and washing in PBS for 5 min. The coverslips were then incubated with avidin–biotin–peroxidase complex solution in PBS for 30 min at room temperature. Apoptotic nuclei that had been labelled were visualized with 3′,3′-diaminobenzidine (0.5 mg/mL) in 0.1 M sodium phosphate buffer (pH=7.4) containing 0.1% (v/v) H2O2. The labelled cells on coverslips were washed in PBS again, mounted on glass slides and visualised with a Zeiss light microscope. For analysis of culture density, coverslips were dipped in solution of toluidine blue (0.5% toluidine blue, 0.5% thionine, 1% sodium tetraborate) for 30 s and washed with PBS to remove excess stain. Microscopy was to count the number of TUNEL-positive cells in five randomly chosen visual field (0.4 mm2) on each coverslip of cells.
Assessment of ROS ProductionRGC-5 cells were assessed for the production of reactive oxygen species using the dye DHE according to Carter et al.23) DHE is a reduced form of ethidium bromide, which is non-fluorescent and can passively cross the membrane of live cells. In the cells DHE can be oxidized by superoxide anion or hydrogen peroxideto ethidium bromide, which binds to DNA, when they activated, emits red fluorescence that is proportional to the intracellular superoxide anion/H2O2 level. After different treatments, RGC-5 cells on coverslips were stained with DHE (10 µg/mL) and incubated for 30 min at 37°C in culture medium in a humified chamber and then fixed with 4% paraformaldehyde for 20 min. After washing in PBS-T coverslips were mounted in PBS containing 1% glycerol and red fluorescence was detected using a Zeiss epifluorescence microscope.
Intracellular ROS level was measured by the 2′,7′-dichlorodihydrofluorescein (DCFH) method.24) RGC-5 cells (5×10³) were seeded in 96 well plates and cultured for 24 h before a 1 h pretreatment with different concentrations of LA and subsequent exposure to 1000 lx light for 48 h. After the treatment, cells were incubated with DCFH diacetate for 15 min in the dark. Then the fluorescence of liberated DCF was quantified, using a fluorescence plate reader (Fluoroskan Ascent, Thermo Scientific, Waltham, MA, U.S.A.) (Ex/Em=485/535 nm). N-Acetylcysteine (NAC) was used as an antioxidant positive control.
Assessment of Apoptosis Membrane Alteration with the APOPercentage™ AssayThe APOPercentage Apoptosis Assay (Biocolor Ltd., Belfast, Northern Ireland) was used to quantify apoptosis. The assay uses a dye that stains red the apoptotic cells undergoing the membrane “flip-flop” event when phosphatidylserine is translocated to the outer leaflet. Add 100 µL/well fresh culture medium containing 5 µL APOPercentage Dye and incubate for 30 min at 37°C. After that, syringe off the culture medium and gently wash the cells twice with 200 µL/well PBS. Transfer immediately to a Zeiss epifluorescence microscope and obtain a photographic record. Quantification of the number of apoptotic RGC-5 cells were achieved by counting the pink apoptosis positive cells in at least five different fields of view under a magnification of 250×.
Antioxidant-Capacity AssayAntioxidant-capacity assay was used to examine intracellular ROS. This assay measured the radicals induced in RGC-5 by the application of ROS (H2O2, O2•−, and HO−). The cells were seeded at a density of 2×10³ cells per well into 96-well plates, and then incubated in a humidified atmosphere of 95% air and 5% CO2 at 37°C. Twenty-four hours later, the cell-culture medium was replaced, before any treatment with drugs or their vehicle (DMEM containing 1% fetal bovine serum (FBS)). After pretreatment with LA at different concentrations or its vehicle for 1 h, the radical probe, 5-(and-6)-chloromethyl-2′,7′-dichlorodihydrofluorescein diacetate, acetyl ester (CM-H2DCFDA) (Molecular Probes, Eugene, OR, U.S.A.) at 10 µM was added and incubated for 20 min at 37°C.25) The cell culture medium was then replaced to remove the surplus probe. CM-H2DCFDA (inactive for ROS) is converted to DCFH (active for ROS) by being taken into the cell and acted upon by an intracellular enzyme (esterase). The H2O2 or O2•− oxidizes intracellular DCFH (non-fluorescent) to DCF (fluorescent). To generate the ROS H2O2 at 1 mM (H2O2) or KO2 at 1 mM (O2•−) as the radical probe was added to the loading-medium. Fluorescence was measured, after the ROS-generating compounds had been present for various time-periods, using a fluorescence plate reader (Fluoroskan Ascent, Thermo Scientific, Waltham, MA, U.S.A.) (Ex/Em=485/535 nm). In addition, to detect the HO• formed in the Fenton reaction, 2-[6-(4′-amino)phenoxy-3H-xanthen-3-on-9-yl]benzoic acid (APF) (Enzo Life Sciences, U.K., Ltd.) was used. Briefly, cells were loaded with APF by incubation for 20 min at 37°C in Hanks/N-(2-hydroxyethyl)piperazine-N′-2-ethanesulfonic acid (Hepes) buffer solution containing APF (10 µM). To perform the Fenton reaction, H2O2 was added to the Hanks/Hepes buffer solution of APF, and then iron(II) perchlorate hexahydrate was added. Fluorescence was measured at excitation/emission wavelengths of 490/515 nm. Total fluorescence intensity was measured at 20 min after treatment with ROS-generating compounds.
Assessment of Glutathione-S-Transferase (GST) ActivityGST activity was measured using the Marker Gene™ live cell glutathione transferase activity kit (Marker Gene Technologies, Inc., OR, U.S.A.). Briefly, RGC-5 cells (1×10⁶) were collected by centrifugation at 700×g for 10 min at 4°C. The supernatant was removed and the cell pellet was resuspended in 1 mL ice-cold D-PBS. The suspension was then transferred into a 1.5 mL micro-centrifuge tube, and centrifuged at 700×g for 5 min at 4°C. The supernatant was then removed and the cells resuspended in 100 µL ice-cold cell lysis buffer. This was then incubated on ice for 10 min, and then centrifuged at high speed (10000×g) in an Eppendorf centrifuge for 10 min. The supernatant was stored on ice and used for the assay. Sample Assay: For background or non-enzymatic controls, 178 µL of cell lysis buffer was added and 20 µL of GSH solution were added to three wells of a 96-well plate. For positive controls, 176 µL of cell lysis buffer, 20 µL of GSH solution, and 2 µL of GST solution were added to three wells. For sample wells, 158 µL of cell lysis buffer was added plus 20 µL of GSH solution, and 20 µL of sample. Finally 2 µL of monochlorobimane (mBCL) solution was added to each 96-well with gentle shaking to mix the reaction mixture. Fluorescence intensities were measured at different time intervals for kinetic assessment using a fluorescence plate reader (Fluoroskan Ascent, Thermo Scientific, U.S.A.) (Ex/Em=380/460 nm).
Assessment of Total Intracellular GSHThe assay is based on glutathione-S-transferase reacting with GSH with monochlorobimane (mBCL) to form the fluorescent product bimaneglutathione. Briefly, after maintaining cell cultures in 40 mm wells in the presence of different substances for 24 h approximately 1×10⁶ RGC-5 cells (collected from two 40 mm wells) were collected and centrifuged at 700×g for 10 min at 4°C. The pelleted cells were then resuspended in cell lysis buffer (100 µL) and after 10 min centrifuged at 10000×g for 10 min. Twenty microliter supernatant samples were transferred to a microplate and to each sample 2 µL 20 mM mCB and 4 µL of GST 25 U/mL was added. After incubation at 37°C for 15 min, fluorescence was measured in a plate reader where the excitation and emission spectra were 380 and 460 nm, respectively.
StatisticsStatistical significance was determined by Bonferroni and Games–Howell post-hoc tests after ANOVA using SPSS for Windows, version 12.0 (SPSS Inc., Chicago, IL, U.S.A.). All data are expressed as mean±S.E.M.; a p-value of <0.05 was generally consider statistically significant.
Results
The effects of light 1000 lx on the viability of RGC-5 cells with or without LA for 48 h, as assessed by the MTT assay, are summarized in Fig. 1A. It can be seen that 48 h of light 1000 lx caused an approximate reduction of 23% and 10 µM LA can improve cell viability to 92% and 50 µM LA can improve cell viability almost to 100% (Fig. 1A).
Support for the MTT assay data which showed that 48 h 1000 lx of light significantly affected RGC-5 cells was confirmed by measuring mitochondrial dehydrogenase activity by WST-1 assay. As shown in Fig. 1B, mitochondrial dehydrogenase activity was significantly reduced in RGC-5 cells exposed to light (1000 lx) for 48 h and the situation was changed at all after adding 50 µM LA (Fig. 1B).
Evidence showed that light was inducing RGC-5 cells to die by apoptosis was obtained by “staining” for DNA breakdown (TUNEL) (Fig. 2). RGC-5 cells were prepared in 4 different 24-well plates with coverslips. One was kept in the dark (Fig. 2A), the other three plates were exposed to 1000 lx light for 48 h. One was exposed to light without any durgs (Fig. 2B) and the other two were added LA at different consentrations (Figs. 2C, D). Figure 2A shows that TUNEL positive cells can not be seen in dark situation. A number of TUNEL positive cells exhibited various degrees of brown TUNEL staining associated with their nuclei when RGC-5 cells were exposed to light (Fig. 2B). The TUNEL positive cells significantly decreased after 10 µM (Fig. 2C) LA was added but less effectively than 50 µM (Fig. 2D).

One thousand lux light for 48 h also caused extensive signs of RGC-5 cell apoptosis, detected by the APOPercentage™ assay (Fig. 3). It is very clear that the pink apoptosis positive cells can not be seen in dark situation (Fig. 3A). But a number of pink apoptosis positive cells appeared in light situation (Fig. 3B). However, the pink apoptosis positive cells significantly decreased after adding 10 µM LA (Fig. 3C). There were almost no apoptosis positive cells after 50 µM LA were added (Fig. 3D).

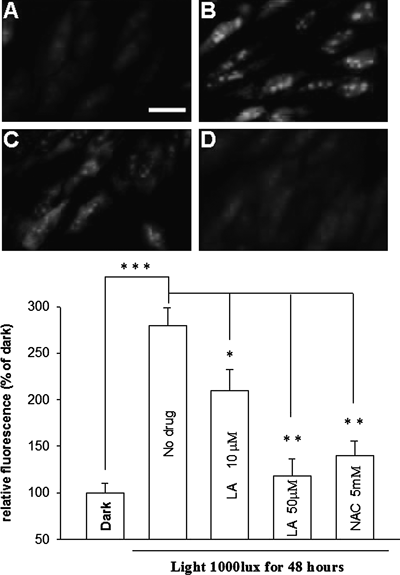
Moreover, DHE staining and quantification for ROS is shown in Fig. 4. In DHE staining, ROS production is indicated by a yellow fluorescence where the background is a red colour. The yellow fluorescence in RGC-5 cells was barely visible in dark situation (Fig. 4A), but enhanced clearly when exposed to light (Fig. 4B). However, the fluorescence were decreased after adding 10 µM LA (Fig. 4C) and almost disappeared after adding 50 µM LA (Fig. 4D). Quantification for ROS also support that LA is a quite powerful radical scavenger. The thiol antioxidant N-acetyl-cysteine (NAC) used as an internal control also significantly scavenged the ROS production.
The antioxidant capacity was subsequently determined where LA significantly scavenged ROS production. LA at 10 µM and 50 µM was able to significantly reduce ROS levels (Fig. 5). When H2O2 at 1 mM was added to RGC-5 cells, ROS activity (relative fluorescence units: RFU) was significantly increased. LA at 10 µM and 50 µM significantly scavenged the H2O2 induced ROS (Fig. 5C). LA also scavenged O2•− radicals caused by 1 mM KO2 (Fig. 5A) and hydroxyl radicals produced by adding 1 mM H2O2 plus 100 µM Ferrous(II) perchlorate in the similar manner (Fig. 5B). The thiol antioxidant NAC used as an internal control also significantly scavenged the ROS production.

To further evaluate the beneficial effects of LA, its influence on key intracellular antioxidant components were investigated. The GSH levels in RGC-5 cells treated with 10 µM and 50 µM LA over 24 h were significantly increased (Fig. 6A). GST levels increased by approximately 13% and 30% after 60 min pre-incubated with 10 µM and 50 µM LA, respectively (Fig. 6B). As previously shown the sulphur compound NAC also stimulated GSH and GST significantly but at much higher concentration.
Discussion
Oxidative stress reflects a marked imbalance between ROS and their removal by antioxidant systems. This imbalance may originate from an overproduction of ROS or from a reduction in antioxidant defenses or both.26) In the present study, a number of researches were employed in order to not only examine the influence of light on retinal ganglion cell but also test whether certain antioxidant can remove overproduction of ROS in light induced retinal ganglion cell death by apoptosis.
Cell viability was initially assessed by monitoring the capability of the cells to reduce MTT to a formazan product.21) MTT reduction is induced by succinate dehydrogenase, a component of complex II in oxidative phosphorylation, and is therefore an indicator of the mitochondrial redox state.27,28) WST-1 is a tetrazolium dye containing an electron-coupling agent that is cleaved by mitochondrial dehydrogenases to a formazan dye. Only living cells can make the conversion and therefore the amount of blue formazan production is directly proportional to the number of viable cells present. Figure 1 indicates two conclusions that the first is light was found to significantly affect the redox state of retinal ganglion cells by implication their mitochondrial activity (Fig. 1A). Support for this was provided by experiments showing that light actually reduces the mitochondrial dehydrogenase activity of RGC-5, as assessed by the WST-1 (Fig. 1B). The second is the antioxidant LA significantly blunted the influence of light 1000 lx for 48 h which reduced cell viability in RGC-5 cells, as assessed by MTT assay and WST-1 assay. Thus, the MTT (redox state) and WST-1 (mitochondrial dehydrogenase activity) experiments on cell culture provide strong support for the idea that light is harmful to retinal cells by affecting mitochondrial function and antioxidant LA can attenuate protect against the light-induced reduction in cell viability.
TUNEL staining, APOPercentage Apoptosis Assay staining and the staining and quantification for ROS suggest that light exposure had a significant negative effect on all of these parameters. Light increased the number of TUNEL-positive cells in TUNEL staining (Fig. 2), increased the number of apoptotic cells in APOPercentage Apoptosis Assay staining (Fig. 3) and intensified the labelling of ROS (Fig. 4) (compared with dark conditions). These combined studies thus support the notion that light causes RGC-5 cells death by apoptosis mechanism that involves the production of ROS. To evaluate the possible involvement of ROS in the cytotoxic effects of light, RGC-5 cells were stained with the fluorescent dye DHE. The production of ROS is indicated by a yellow fluorescence where the background is of a red colour. The yellow fluorescence was barely visible when in the dark, but clearly enhanced when exposed to light 1000 lx for 48 h. However, the fluorescence of RGC-5 cells which were added to LA was almost the same comparing with dark. These observations provide therefore further support for the view that ROS production is involved in the light-induced apoptotic pathways and antioxidant- LA can counteract the influence of light by decreasing the ROS generation.
Studies in several different systems have demonstrated significant antioxidant properties of LA.17,20,29) The mitochondrial E3 enzyme, dihydrolipoyl dehydrogenase, reduces lipoate to dihydrolipoate at the expense of NADH. Dihydrolipoic acid reacts directly with various oxidants and regenerates different antioxidants, such as vitamin C, glutathione, and α-tocopherol.30,31) LA has an unusual property of being a free radical scavenger, not only in reduced, but also in oxidized form. Its oxidized form has been shown to quench hydroxyl radicals, singlet oxygen, and hydrogen peroxide.32) In our experiments, pretreatment of RGC-5 cells with LA resulted in significantly lower levels of light-stimulated intracellular ROS production, consistent with its ability to decrease oxidative damage and subsequent RGC-5 cell death.
Studies on the effects of LA on different types of ROS showed LA at 10 µM and 50 µM scavenged OH−, H2O2 and O2•− (Fig. 5). H2O2 can give rise to the formation of OH− which is the most reactive species among the three radicals, a process markedly accelerated in the presence of ferric ions via the Fenton reaction. H2O2 can be removed when GSH is oxidized to GSSG via the action of glutathione peroxidase.33) Also in the present study, LA at 10 µM and 50 µM had positive effects on the antioxidants GSH and GST levels (Fig. 6). LA is thought to enhance the biosynthesis of GSH under conditions when the demand for GSH is increased, such as in some pathological conditions where excessive oxidative stress is implicated, for example light injury.
The combined data demonstrate that light (400–760 nm) as impinging on the retina in situ is able to cause a generation of ROS and induce cell death to RGC-5 cells in culture. LA is able to blunt the detrimental effect of light by getting rid of excessive reactive oxygen species and enhance glutathione levels.
In conclusion, the present study shows that LA attenuates the negative impact of light to a transformed ganglion cell line (RGC-5) of cells in culture. The pathogenesis for the death of ganglion cells in glaucoma has been proposed to involve an influence of light.16) Our experimental findings suggest that a case for considering LA as a possible candidate neuroprotectant for the treatment of glaucoma is worthy of consideration. This idea receives substance from the knowledge that LA can be taken orally and is likely to reach the retina by this route of administration.
REFERENCES
- 1) Marshall J. Radiation and the ageing eye. Ophthalmic Physiol. Opt., 5, 241–263 (1985).
- 2) Peak MJ, Peak JG. Solar-ultraviolet-induced damage to DNA. Photodermatology, 6, 1–15 (1989).
- 3) Sandbach JM, Coscun PE, Grossniklaus HE, Kokoszka JE, Newman NJ, Wallace DC. Ocular pathology in mitochondrial superoxide dismutase (Sod2)-deficient mice. Invest. Ophthalmol. Vis. Sci., 42, 2173–2178 (2001).
- 4) Moragón AC, De Lucas García N, Encarnación López Fernández M, Rodriguez-Manzaneque AS, Jimenez Fraile JA. Antioxidant enzymes, occupational stress and burnout in workers of a prehospitalary emergency service. Eur. J. Emerg. Med., 12, 111–115 (2005).
- 5) Kortuem K, Geiger LK, Levin LA. Differential susceptibility of retinal ganglion cells to reactive oxygen species. Invest. Ophthalmol. Vis. Sci., 41, 3176–3182 (2000).
- 6) Peak MJ, Peak JG. Hydroxyl radical quenching agents protect against DNA breakage caused by both 365-nm UVA and by gamma radiation. Photochem. Photobiol., 51, 649–652 (1990).
- 7) Cunningham ML, Krinsky NI, Giovanazzi SM, Peak MJ. Superoxide anion is generated from cellular metabolites by solar radiation and its components. J. Free Radic. Biol. Med., 1, 381–385 (1985).
- 8) Hockberger PE, Skimina TA, Centonze VE, Lavin C, Chu S, Dadras S, Reddy JK, White JG. Activation of flavin-containing oxidases underlies light-induced production of H2O2 in mammalian cells. Proc. Natl. Acad. Sci. U.S.A., 96, 6255–6260 (1999).
- 9) Jung J, Kim H, Cho M. Action spectra for the generation of singlet oxygen from mitochondrial membranes from soybean (Glycine max) hypocotyls. Photochem. Photobiol., 51, 561–566 (1990).
- 10) Putting BJ, Van Best JA, Vrensen GF, Oosterhuis JA. Blue-light-induced dysfunction of the blood-retinal barrier at the pigment epithelium in albino versus pigmented rabbits. Exp. Eye Res., 58, 31–40 (1994).
- 11) Godley BF, Shamsi FA, Liang FQ, Jarrett SG, Davies S, Boulton M. Blue light induces mitochondrial DNA damage and free radical production in epithelial cells. J. Biol. Chem., 280, 21061–21066 (2005).
- 12) Fink SL, Cookson BT. Apoptosis, pyroptosis, and necrosis: mechanistic description of dead and dying eukaryotic cells. Infect. Immun., 73, 1907–1916 (2005).
- 13) Wang L, Dong J, Cull G, Fortune B, Cioffi GA. Varicosities of intraretinal ganglion cell axons in human and nonhuman primates. Invest. Ophthalmol. Vis. Sci., 44, 2–9 (2003).
- 14) Kerr J, Nelson P, O’Brien C. A comparison of ocular blood flow in untreated primary open-angle glaucoma and ocular hypertension. Am. J. Ophthalmol., 126, 42–51 (1998).
- 15) Votruba M. Molecular genetic basis of primary inherited optic neuropathies. Eye (Lond.), 18, 1126–1132 (2004).
- 16) Osborne NN, Lascaratos G, Bron AJ, Chidlow G, Wood JP. A hypothesis to suggest that light is a risk factor in glaucoma and the mitochondrial optic neuropathies. Br. J. Ophthalmol., 90, 237–241 (2006).
- 17) Fuchs J, Packer L, Zimmer G. Lipoic Acid in Health and Disease. Marcel Dekker, New York (1997).
- 18) Hagen TM, Yowe DL, Bartholomew JC, Wehr CM, Do KL, Park JY, Ames BN. Mitochondrial decay in hepatocytes from old rats: membrane potential declines, heterogeneity and oxidants increase. Proc. Natl. Acad. Sci. U.S.A., 94, 3064–3069 (1997).
- 19) Liu J, Head E, Gharib AM, Yuan W, Ingersoll RT, Hagen TM, Cotman CW, Ames BN. Memory loss in old rats is associated with brain mitochondrial decay and RNA/DNA oxidation: partial reversal by feeding acetyl-L-carnitine and/or R-alpha-lipoic acid. Proc. Natl. Acad. Sci. U.S.A., 99, 2356–2361 (2002).
- 20) Osborne NN. Pathogenesis of ganglion “cell death” in glaucoma and neuroprotection: focus on ganglion cell axonal mitochondria. Prog. Brain Res., 173, 339–352 (2008).
- 21) Mosmann T. Rapid colorimetric assay for cellular growth and survival: application to proliferation and cytotoxicity assays. J. Immunol. Methods, 65, 55–63 (1983).
- 22) Toimela T, Tähti H. Mitochondrial viability and apoptosis induced by aluminum, mercuric mercury and methylmercury in cell lines of neural origin. Arch. Toxicol., 78, 565–574 (2004).
- 23) Carter WO, Narayanan PK, Robinson JP. Intracellular hydrogen peroxide and superoxide anion detection in endothelial cells. J. Leukoc. Biol., 55, 253–258 (1994).
- 24) Shimazawa M, Nakajima Y, Mashima Y, Hara H. Docosahexaenoic acid (DHA) has neuroprotective effects against oxidative stress in retinal ganglion cells. Brain Res., 1251, 269–275 (2009).
- 25) Adom KK, Liu RH. Rapid peroxyl radical scavenging capacity (PSC) assay for assessing both hydrophilic and lipophilic antioxidants. J. Agric. Food Chem., 53, 6572–6580 (2005).
- 26) Butterfield DA, Stadtman ER. Protein oxidation processes in aging brain. Adv. Cell Aging Gerontol., 2, 161–191 (1997).
- 27) Lippold HJ. Quantitative succinic dehydrogenases histochemistry. A comparison of different tetrazolium salts. Histochemistry, 76, 381–405 (1982).
- 28) Berridge MV, Tan AS. Characterization of the cellular reduction of 3-(4,5-dimethylthiazol-2-yl)-2,5-diphenyltetrazolium bromide (MTT): subcellular localization, substrate dependence, and involvement of mitochondrial electron transport in MTT reduction. Arch. Biochem. Biophys., 303, 474–482 (1993).
- 29) Sen CK, Roy S, Khanna S, Packer L. Determination of oxidized and reduced lipoic acid using high-performance liquid chromatography and coulometric detection. Methods Enzymol., 299, 239–246 (1999).
- 30) Moini H, Packer L, Saris NE. Antioxidant and prooxidant activities of alpha-lipoic acid and dihydrolipoic acid. Toxicol. Appl. Pharmacol., 182, 84–90 (2002).
- 31) Packer L, Tritschler HJ, Wessel K. Neuroprotection by the metabolic antioxidant alpha-lipoic acid. Free Radic. Biol. Med., 22, 359–378 (1997).
- 32) Biewenga GP, Haenen GR, Bast A. The pharmacology of the antioxidant lipoic acid. Gen. Pharmacol., 29, 315–331 (1997).
- 33) Meister A, Anderson ME. Glutathione. Annu. Rev. Biochem., 52, 711–760 (1983).

