Abstract
Assessing microbiological quality assurance by monitoring bacteria in various sources of freshwater used for human consumption, recreation, and food preparation is important for a healthy life. Bacterial number and their community structure in freshwater should be determined as quickly as possible, and “real-time” and “on-site” microbiological methods are required. In this study, we examined the protocol for microchip-based terminal restriction fragment length polymorphism (T-RFLP) analysis, which uses microchip electrophoresis for rapid microbial community analysis. The availability of microchip-based T-RFLP was compared with conventional T-RFLP analysis, which uses a capillary electrophoresis system, with freshwater samples (spring water, river water, groundwater, and hydroponics solution). The detection limit of targeted bacteria by on-chip T-RFLP analysis was 1% (103 cells/mL). The fragment sizes determined by the two analysis methods were highly correlated (r2=0.98). On-chip T-RFLP analysis was completed within 15 min. T-RFLP profiles of nine hydroponics solution samples were analyzed by multidimensional scaling. Considerable changes and stability in bacterial community structure during hydroponic culture were detected by both analyses. These results show that on-chip T-RFLP analysis can monitor changes in bacterial community structure, as well as conventional T-RFLP analysis. The present results indicate that on-chip T-RFLP analysis is an effective tool for rapid and “on-site” bacterial community profiling in freshwater environments, as well as freshwater used for medical and industrial purposes.
Assessing microbiological quality assurance by monitoring bacteria in various sources of freshwater used for human consumption, recreation, and food preparation is important for a healthy life. In addition, regeneration of used water and seawater desalination are important to save freshwater resources. Microorganisms that survive the water purification process can become a source of microbial contamination.1) Bacterial number and their community structure in freshwater should be determined as quickly as possible, and “real-time” and “on-site” microbiological methods are therefore required.
Determination of total bacterial number is a basis for routine monitoring and microbiological quality assurance. Microchip-based systems have been developed for rapid quantification of bacteria in freshwater.2,3) These systems enable counting of bacteria in freshwater within 1 h using a microfluidic device following fluorescent staining, without concentration or other time-consuming preparation steps.
For microbiological quality assessment of freshwater, assessment is required to determine whether the number of harmful bacteria is increasing when total bacterial numbers are rapidly changing. Terminal restriction fragment length polymorphism (T-RFLP) targeting the bacterial 16S ribosomal RNA (rRNA) gene as a universal genetic marker is widely used for characterization of bacterial community composition.4) T-RFLP is semi-quantitative and has a high sensitivity, resolution, and reproducibility. T-RFLP has been applied for community analysis of bacteria in natural environments (e.g., lakes,5) ocean,6) and soil7)) as well as human oral8) or intestinal9) microbiota, because this method is suitable for evaluation of temporal and spatial changes of targeted microbial communities. The terminal restriction fragments (T-RFs) of digested polymerase chain reaction (PCR) products are usually analyzed by capillary electrophoresis, and the relative abundance and size of each T-RF are measured. DNA sequence information of each T-RF can be obtained by comparing its size and type of the used restriction enzymes with several specified databases.10,11) However, conventional capillary electrophoresis systems are large and expensive for on-site T-RFLP analysis.
The present study examined the use of microchips, which have been developed during decades of progress in microfabrication technologies. Microchip-based analyses are faster, performed on a smaller scale, and consume less sample and reagents than conventional approaches, and are thus applied to microbiological studies.12,13) Application of these new and useful techniques in environmental microbiology is highly expected.14) In this study, we examined the protocol for microchip-based T-RFLP analysis and compared its availability with conventional T-RFLP analysis with freshwater samples.
MATERIALS AND METHODS
Freshwater SamplesSpring water was collected at Suma spring, Sawanoi spring, Jyurinji Temple (Hyogo Prefecture, Japan), and Tarumi Shrine (Osaka Prefecture, Japan). River water samples were collected at the Minoh River (Osaka Prefecture, Japan). Bottled potable groundwater (natural mineral water) was purchased from a retail store.
Hydroponics solution of the Closed Ecology Experiment Facilities (CEEF; Aomori Prefecture, Japan) was also analyzed. The CEEF were developed to study stable material circulation by the physicochemical system and long-term closed habitation experiments based on material balance between plants, animals, and humans.15)
The collected samples were kept on ice and immediately analyzed after sampling.
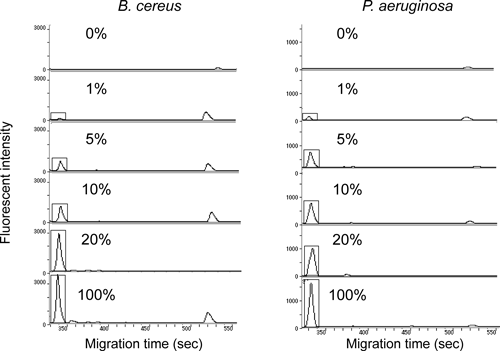
Bacterial StrainsTwo bacterial strains, Bacillus cereus ATCC 14579 and Pseudomonas aeruginosa ATCC 10145, were used to estimate the detection limit of on-chip T-RFLP analysis. B. cereus or P. aeruginosa was inoculated to potable groundwater with the ratio of 0%, 0.1%, 0.25%, 0.5%, 1%, 5%, 10%, and 20% of indigenous bacterial number.
Escherichia coli W3110 was used to prepare the upper marker for on-chip T-RFLP analysis.
These bacterial cells were grown aerobically at 37°C in Luria–Bertani medium (1% tryptone, 0.5% yeast extract, 1% NaCl).
DNA ExtractionApproximately 100–1000 mL of freshwater or hydroponics solution was filtrated on filters (0.2 µm pore polycarbonate filter, Toyo-Roshi, Tokyo, Japan) to collect bacteria in the samples. These filters were then cut in small pieces and put in beat bead vials with a 1/2 volume of 0.1 mm sterilized glass beads (Biospec Products, Bartlesville, U.S.A.). Genomic DNA of each bacterium and total DNAs from environmental samples were extracted by using a bead-beating method.16)
PCRReaction mixtures for PCR contained PCR buffer, each deoxynucleoside triphosphate (dNTP) at a concentration of 200 mM, 2.5 mM MgCl2, each primer at a concentration of 0.1 mM, and 2.5 U of Taq DNA polymerase (Applied Biosystems, New Jersey, U.S.A.) in a final volume of 100 µL. The 16S rRNA fragments were amplified with the primers EUB 8F (5′-AGA GTT TGA TCC TGG CTC AG-3′) and 926R (5′-CCG TCA ATT CCT TTR AGT TT-3′), which are specific for the universally conserved bacterial 16S rRNA gene sequence.4) The 5′ end of the EUB 8F primer was labeled with fluorochrome Cy5. DNA amplification was performed with the PTC-200 thermal cycler (MJ Research, Massachusetts, U.S.A.) using the following program: 9 min hot start at 95°C, followed by 20 cycles consisting of denaturation (1 min at 94°C), annealing (1 min at 65°C, touch down: 0.5°C per cycle), and extension (3 min at 72°C), and then 15 cycles consisting of denaturation (1 min at 94°C), annealing (1 min at 55°C), and extension (3 min at 72°C), and a final extension at 72°C for 10 min. PCR products were purified by the MinElute PCR Purification Kit (Qiagen, Maryland, U.S.A.).
Klenow Fragment and Restriction Enzyme TreatmentPCR products were treated with Klenow fragment as follows17) to avoid the production of pseudo-T-RFs. Approximately 1 µg of PCR products were incubated with 5 U of Klenow fragment exonuclease minus in the reaction buffer (TaKaRa, Shiga, Japan) and 50 µM of each of the four dNTPs in a total volume of 100 µL for 1 h at 20°C in the dark.
After Klenow fragment treatment, DNA was recovered by adding 2.5-fold volume of 100% ethanol and 1/10 volume of 3 M sodium acetate. This solution was kept for 1 h at −80°C, followed by centrifugation at 13000×g for 30 min (ethanol precipitation). The pellet was washed with 70% ethanol, and then dried and resuspended in 20 µL of distilled water.
These Klenow-treated PCR products were incubated for 2.5 h at 37°C with the restriction enzymes HhaI, MboI or MspI (TaKaRa), followed by ethanol precipitation and resuspension in TE buffer (10 mM Tris–HCl, 1 mM ethylenediamine tetraacetic acid (EDTA)).
T-RFLP Analysis by Capillary ElectrophoresisThe precise lengths of the T-RFs were determined by electrophoresis with the CEQ 8000 automated sequencer (Beckman Coulter, Indianapolis, U.S.A.). For analysis, 1 µL of digested DNA from each sample (DNA concentration was 1 ng/µL, measured by the Quant-iT dsDNA HS Assay Kit [Invitrogen, Carlsbad, U.S.A.]) was mixed with 24.875 µL of loading buffer (Beckman Coulter) and 0.125 µL of DNA fragment length standard (Beckman Coulter). These mixtures were loaded onto the CEQ 8000. After electrophoresis, the lengths of fluorescently-labeled T-RFs were determined by comparison with internal standards.
on-Chip T-RFLP AnalysisFor on-chip T-RFLP analysis, Cosmo-I (size: 30 cm×45 cm×30 cm; Hitachi High-Technologies, Tokyo, Japan) was used as the microchip electrophoresis system, using i-chip 12 (size: 9.2 cm×6.6 cm×0.15 cm; Hitachi Chemical, Tokyo, Japan) and i-chip gel 3 (Hitachi Chemical). The analysis conditions were as follows: separation voltage, 650 V; temperature, 30°C; and separation time: 650 s. A volume of 1–8 µL of digested DNA (the DNA concentration was 100 ng, measured by the Quant-iT dsDNA HS Assay Kit) was mixed with the lower and upper markers, applied to the well on the chip, and analyzed. The lower marker was prepared by annealing two complementary single strand oligonucleotides of 100 bases labeled by Cy5 (Cy5-MARKER 100s [5′-GTA CGG TCA TCA TCT GAC ACG TAC GGT CAT CAT CTG ACA CGT ACG GTC ATC ATC TGA CAC GTA CGG TCA TCA TCT GAC ACG TAC GGT CAT CAT CTG ACA C-3′] and Cy5-MARKER 100a [5′-GTG TCA GAT GAT GAC CGT ACG TGT CAG ATG ATG ACC GTA CGT GTC AGA TGA TGA CCG TAC GTG TCA GAT GAT GAC CGT ACG TGT CAG ATG ATG ACC GTA C-3′]). The upper marker was developed by amplifying DNA extracted from E. coli, using Cy5-labeled EUB8F and Eco607R (5′-TCA CAT CTG ACT TAA CAA ACC G-3′) primers with the above-mentioned PCR conditions, followed by purification by the MinElute PCR Purification Kit (Qiagen).
Multi-Dimensional Scaling AnalysisTo visualize changes in bacterial community structure, multidimensional scaling (MDS) was performed on the Euclidean distance.18) The similarity of each T-RF was estimated by fragment size and the ratio of the peak area to the total peak area. The software SPSS Categories 10.0J (SPSS, Tokyo, Japan) was used for analysis.
RESULTS AND DISCUSSION
Detection Limit of on-Chip T-RFLP Analysis and Similarity of Fragment Sizes Determined by Capillary and on-Chip T-RFLP AnalysesThe conditions of microchip-electrophoresis were first optimized for on-chip T-RFLP analysis. Temperature (15°C, 30°C, and 45°C) and voltage (650 V, 800 V, and 950 V) were examined. A high temperature and high voltage reduced the time for the analysis. However, some peaks overlapped and the resolution was decreased. The best separation was obtained at 30°C with 650 V, and this condition was used for the following experiments.
Groundwater samples inoculated with different numbers of B. cereus or P. aeruginosa were analyzed by on-chip T-RFLP, and the detection limit of this technique was determined (Fig. 1). The number of indigenous bacteria in this groundwater was 105 cells/mL and the detection limit of targeted bacteria by on-chip T-RFLP analysis was 1% (103 cells/mL). Bacteria of 0.1%, 0.25%, and 0.5% of the total cells were not clearly detected by on-chip T-RFLP analysis because it was difficult to distinguish bacterial peaks from baseline. The detection limit of both Gram-positive and Gram-negative bacteria was 1% in these experiments (repeated four times).
Profiles for bacterial DNA in freshwater (spring water, river water, and hydroponics solution) were analyzed by conventional T-RFLP with capillary electrophoresis and on-chip T-RFLP, and we examined the similarity of fragment sizes obtained by these different systems. T-RFLP profiles of a freshwater sample obtained by the two analysis methods were similar (Fig. 2). The fragment sizes determined by these two methods were highly correlated (Fig. 3; r2=0.98).
on-Chip T-RFLP enabled rapid analysis. Conventional T-RFLP required longer than 1 h for the analysis with our condition, while on-chip T-RFLP analysis was completed within 15 min.
Bacterial Community Profiling in Hydroponics SolutionChanges in the bacterial community in hydroponics solution were monitored to estimate the usefulness of on-chip T-RFLP for bacterial community profiling of freshwater samples. This was carried out because bacterial community composition in hydroponics solution is simple and changeable compared with that in natural freshwater environments,19) and thus is suitable for bacterial monitoring. Changes in T-RFLP profiles of bacterial DNA in hydroponics solution in a 4-week-old culture are shown in Fig. 4. We assumed that certain bacterial species consistently existed and changed their ratio in hydroponics solution during hydroponic culture. In addition, the appearance and disappearance of some peaks were observed by on-chip T-RFLP analysis. We identified the dominant bacterium shown in Fig. 4 by the database MiCA311) (http://mica.ibest.uidaho.edu/) and the result was “uncultured bacterium.” More than 90% of bacteria in aquatic environments are difficult to culture under conventional conditions1–3) and this result was convincing.

Furthermore, we analyzed T-RFLP profiles of nine hydroponics solution samples by MDS analysis (Fig. 5). MDS is a nonmetric procedure that is robust to outliers and preserves the rank orders of the relative distances among points in the higher dimensional data cloud. An important component of the plot is a measure of the goodness of fit of the final plot, termed the “stress.” A stress less than 0.2 indicates a useful two-dimensional picture, while a stress greater than 0.2 indicates that the plot is close to random. MDS analysis showed similar results between the two T-RFLP analysis methods; large changes (Fig. 5; C to D and G to H) and stability (Fig. 5; E to F and H to I) in bacterial community structure during hydroponic culture were detected by both analyses. These results demonstrated that on-chip T-RFLP analysis could monitor changes in bacterial community structure, as well as conventional capillary T-RFLP analysis.

Several types of microchips have been developed for DNA extraction or PCR.14) Microchip-based T-RFLP analysis examined in this study could be combined with these other microchip-based systems, and this integrated system will enable whole on-site bacterial monitoring. Total bacterial number of a targeted freshwater sample can be first determined by a microchip-based system for rapid quantification of bacteria in freshwater.2,3) In addition, the bacterial community structure should be analyzed by a microchip-based system for DNA extraction, PCR, and on-chip T-RFLP to determine whether harmful bacteria are increasing when total bacterial number is increasing.
The present results indicate that on-chip T-RFLP analysis is an effective tool for “on-site” bacterial community profiling in freshwater environments, as well as freshwater used for medical20,21) and industrial purposes.1) Furthermore, people have activities in confined habitat such as Antarctic research bases and International Space Station. The importance of on-site monitoring, which means analysis at the sampling points, is now increasing especially in closed habitation systems. In microbiological monitoring, we usually take samples at the sampling points and bring the samples to a laboratory for the analysis. On the other hand, for microbiological monitoring in the International Space Station, astronauts have to bring samples to a laboratory on the ground for the analysis, while it takes more than a few weeks (sometimes more than several months). It is important to detect outbreaks of harmful bacteria as soon as possible for microbiological safety assurance and avoid infectious diseases among astronauts because of limited treatment and isolation possibilities and no immediate return to Earth. In addition, it is thought that diversity of bacterial community decreased in these confined environments where both air and water are regenerated and reused. Some harmful bacteria can sometimes easily increase in simplified microbial ecosystems.19) “Real-time” and “on-site” microbiological monitoring is therefore more important in closed habitation systems than our usual living environments. On-chip T-RFLP system is small, portable and easy to maintain, and microchip is more robust than glass capillary. This rapid microbiological monitoring technique is very useful to assure microbiological safety in confined habitat where space and resources are limited.
Acknowledgments
This study was supported by the Ground-Based Research Program for Space Utilization promoted by the Japan Space Forum, and by JSPS KAKENHI (Grant-in-Aid for Scientific Research [A]) Grant No. 21256002. We thank the CEEF staff for their kind cooperation.
REFERENCES
- 1) Baba T, Matsumoto R, Yamaguchi N, Nasu M. Bacterial population dynamics in a reverse-osmosis water purification system determined by fluorescent staining and PCR-denaturing gradient gel electrophoresis. Microbes Environ., 24, 163–167 (2009).
- 2) Sakamoto C, Yamaguchi N, Yamada M, Nagase H, Seki M, Nasu M. Rapid quantification of bacterial cells in potable water using a simplified microfluidic device. J. Microbiol. Methods, 68, 643–647 (2007).
- 3) Yamaguchi N, Torii M, Uebayashi Y, Nasu M. Rapid, semiautomated quantification of bacterial cells in freshwater by using a microfluidic device for on-chip staining and counting. Appl. Environ. Microbiol., 77, 1536–1539 (2011).
- 4) Liu WT, Marsh TL, Cheng H, Forney LJ. Characterization of microbial diversity by determining terminal restriction fragment length polymorphisms of genes encoding 16S rRNA. Appl. Environ. Microbiol., 63, 4516–4522 (1997).
- 5) Schwarz JI, Eckert W, Conrad R. Community structure of Archaea and Bacteria in a profundal lake sediment Lake Kinneret (Israel). Syst. Appl. Microbiol., 30, 239–254 (2007).
- 6) Zhang R, Thiyagarajan V, Qian P-Y. Evaluation of terminal-restriction fragment length polymorphism analysis in contrasting marine environments. FEMS Microbiol. Ecol., 65, 169–178 (2008).
- 7) Singh BK, Nazaries L, Munro S, Anderson IC, Campbell CD. Use of multiplex terminal restriction fragment length polymorphism for rapid and simultaneous analysis of different components of the soil microbial community. Appl. Environ. Microbiol., 72, 7278–7285 (2006).
- 8) Sakamoto M, Umeda M, Benno Y. Molecular analysis of human oral microbiota. J. Periodontal Res., 40, 277–285 (2005).
- 9) Nakanishi Y, Murashima K, Ohara H, Suzuki T, Hayashi H, Sakamoto M, Fukasawa T, Kubota H, Hosono A, Kono T, Kaminogawa S, Benno Y. Increase in terminal restriction fragments of Bacteroidetes-derived 16S rRNA genes after administration of short-chain fructooligosaccharides. Appl. Environ. Microbiol., 72, 6271–6276 (2006).
- 10) Marsh TL, Saxman P, Cole J, Tiedje J. Terminal restriction fragment length polymorphism analysis program, a web-based research tool for microbial community analysis. Appl. Environ. Microbiol., 66, 3616–3620 (2000).
- 11) Shyu C, Soule T, Bent SJ, Foster JA, Forney LJ. MiCA: a web-based tool for the analysis of microbial communities based on terminal-restriction fragment length polymorphisms of 16S and 18S rRNA genes. Microb. Ecol., 53, 562–570 (2007).
- 12) Wakamoto Y, Yasuda K. Quantitative evaluation of cell-to-cell communication effects in cell group class using on-chip individual-cell-based cultivation system. Biochem. Biophys. Res. Commun., 349, 1130–1138 (2006).
- 13) Lee JG, Cheong KH, Huh N, Kim S, Choi JW, Ko C. Microchip-based one step DNA extraction and real-time PCR in one chamber for rapid pathogen identification. Lab. Chip, 6, 886–895 (2006).
- 14) Liu WT, Zhu L. Environmental microbiology-on-a-chip and its future impacts. Trends Biotechnol., 23, 174–179 (2005).
- 15) Institute for Environmental Sciences: ‹http://www.ies.or.jp/facility_e/Facility201.html›, cited 13 April, 2013.
- 16) Ichijo T, Yamaguchi N, Tani K, Nasu M. Oligonucleotide probes for phylogenetic detection of waterborne bacteria. J. Health Sci., 56, 321–325 (2010).
- 17) Egert M, Friedrich MW. Post-amplification Klenow fragment treatment alleviates PCR bias caused by partially single-stranded amplicons. J. Microbiol. Methods, 61, 69–75 (2005).
- 18) Iwamoto T, Tani K, Nakamura K, Suzuki Y, Kitagawa M, Eguchi M, Nasu M. Monitoring impact of in situ biostimulation treatment on groundwater bacterial community by DGGE. FEMS Microbiol. Ecol., 32, 129–141 (2000).
- 19) Murase A, Uchiyama T, Yamaguchi N, Nasu M. In situ enumeration of total counts and number of physiologically active bacterial cells in groundwater using fluorescent staining methods. J. Antibact. Antifung. Agents, 27, 785–792 (1999).
- 20) Kawai M, Matsutera E, Kanda H, Yamaguchi N, Tani K, Nasu M. 16S ribosomal DNA-based analysis of bacterial diversity in purified water used in pharmaceutical manufacturing processes by PCR and denaturing gradient gel electrophoresis. Appl. Environ. Microbiol., 68, 699–704 (2002).
- 21) Yamaguchi N, Baba T, Nakagawa S, Saito A, Nasu M. Rapid monitoring of bacteria in dialysis fluids by fluorescent vital staining and microcolony methods. Nephrol. Dial. Transplant., 22, 612–616 (2007).

