Abstract
Fibrates are used in biochemical and pharmacological studies as bioactive tools. Nevertheless, most studies have lacked information concerning the concentrations of fibric acids working inside tissues because a simple and sensitive method is not available for their quantitation. This study aimed to develop a simple and sensitive bioanalytical method for the quantitation of clofibric, bezafibric and fenofibric acids in samples of very small portions of tissues. Fibric acids were extracted into n-hexane–ethyl acetate from tissue homogenates (10 mg of liver, kidney or muscle) or serum (100 µL) and were derivatized with 4-bromomethyl-6,7-dimethoxycoumarin, followed by HPLC with fluorescence detection. These compounds were separated isocratically on a reversed phase with acetonitrile–water. Standard analytical curves were linear over the concentration range of 0.2–20 nmol/10 mg of liver. Precision and accuracy were within acceptable limits. Recovery from liver homogenates ranged from 93.03 to 112.29%. This method enabled the quantitation of fibric acids in 10 mg of liver from rats treated with clofibric acid, bezafibric acid or fenofibrate. From these analytical data, it became clear that there was no large difference in ratio of acyl-CoA oxidase 1 (Acox1) mRNA level to fibric acid content in the liver among the three fibric acids, suggesting that these three fibric acids have similar potency to increase expression of the Acox1 gene, which is a target of peroxisome proliferator-activated receptor α. Thus, the proposed method is a simple, sensitive and reliable tool for the quantitation of fibric acids working in vivo inside livers.
Fibrates are known to increase low-density lipoprotein size, high-density lipoprotein synthesis, reverse cholesterol transport and insulin sensitivity, and suppress plasma triacylglycerol, and vascular and systemic inflammation.1–5) Owing to these beneficial effects, fibrates are utilized as drugs for therapies of diseases, such as primary dyslipidemia, metabolic syndrome, type 2 diabetes, nonalcoholic fatty liver disease and atherosclerosis. Most of these actions of fibrates are considered to be mediated through peroxisome proliferator-activated receptor α (PPARα), which then forms a heterodimer with retinoid X receptor (RXR); once activated, the PPARα/RXR heterodimer binds to peroxisome proliferator response element, causing increased or decreased transcription of many genes in various tissues.6,7) Tissues with the highest expression of PPARα are liver, kidney, heart and brown adipose. Fatty acids and eicosanoids are the endogenous ligands of PPARα7–9); before starting to function, fibrates, which are ester forms, have to be converted by hepatic esterases to fibric acids, carboxylic acid forms that are active forms as PPARα ligands.7,10) Because of their potent activities, fibrates or fibric acids are widely used in biochemical and pharmacological studies as tools. Nevertheless, most of the studies provided information concerning the dosages of fibrates administered to experimental animals in in vivo studies, but lacked information with respect to the concentrations of fibric acids working inside tissues because a simple and sensitive method is not available for their quantitation. To obtain a better understanding of the mechanism underlying the ongoing action of fibrates in tissues, however, the precise concentrations of fibric acids working inside tissues or cells need to be determined.
In terms of the quantitation of fibric acids in biological samples, more than ten methods have been proposed so far, methods that employed GC11) and HPLC with UV detection.12–17) These methods were developed to determine the levels of fibric acids in plasma for clinical purposes, and are not always sensitive enough to quantitate fibric acids in the liver of rodents treated with these agents for biochemical or pharmacological studies. In this context, this study aimed to develop a simple and sensitive bioanalytical method for quantitation of clofibric, bezafibric and fenofibric acids in samples of very small portions of livers. In the present study, we developed a method for quantitative determination of these three fibric acids in liver samples by HPLC with fluorescence detection using 4-bromomethyl-6,7-dimethoxycoumarin (BrMDMC) as a derivatization reagent. This presently developed method is simple and sensitive enough to analyze fibric acids in tissues from experimental animals that were administered fibrates for biochemical and pharmacological purposes.
MATERIALS AND METHODS
MaterialsBezafibrate (also referred as bezafibric acid), clofibric acid, fenofibrate (isopropyl ester of fenofibric acid) and BrMDMC were obtained from Sigma-Aldrich Japan (Tokyo, Japan). Bezafibric acid and clofibric acid were recrystallized from methanol–water and ethanol–water solutions, respectively. 18-Crown-6-ether was obtained from Wako Pure Chemical Industries, Ltd. (Osaka, Japan). All other chemicals were of analytical grade and were used without further purification. Fenofibric acid was prepared by hydrolysis of fenofibrate with 10% (w/v) potassium hydroxide in methanol; the fenofibric acid obtained was recrystallized from methanol–water. 2-{4-[(4-Chlorophenyl)(hydroxy)methyl]phenoxy}-2-methylpropanoic acid was prepared as follows. To a solution of fenofibric acid (300 mg, 0.941 mmol) in methanol (10 mL) was added portionwise sodium borohydride (231 mg, 6.118 mmol) at 0°C. The reaction mixture was shirred for 2 h at room temperature. After the reaction was completed, the mixture was concentrated under reduced pressure and acidified by 10% (w/v) HCl at 0°C. The mixture was extracted with ethyl acetate (2×20 mL) and the organic layer was washed with brine, dried over Na2SO4, and concentrated. The residue was recrystallized from ethyl acetate–n-hexane to afford the corresponding alcohol (153 mg, 50.7%) as colorless crystals. The product was characterized by NMR and EI (electron impact)-MS data; 1H-NMR (400 MHz, CDCl3+D2O) δ 1.59 (s, 6 H), 5.79 (s, 1 H), 6.89 (d, J=5.6 Hz, 2 H), 7.25 (d, J=5.6 Hz, 2 H), 7.31 (s, 4 H); EI-MS m/z (relative intensity) 320 (M+, 10), 322 (M++2, 3.4), 216 (74), 153 (100).
AnimalsAll animal studies complied with the recommendations of the Institutional Board for Animal Studies, Josai University. Seven-week-old male Wistar rats were obtained from SLC (Hamamatsu, Japan). After acclimatization, the rats were fed on a standard diet (CE-2; Clea Japan, Tokyo, Japan) or a diet admixed with 0.1% (w/w) clofibric acid, bezafibric acid or fenofibrate, for 14 d. Under diethyl ether anesthesia, the liver was rapidly removed, washed with ice-cold saline and weighed. One part of the liver was frozen in liquid nitrogen and stored at −80°C for the determination of mRNA. The other part of the liver was perfused with ice-cold 0.9% NaCl and used for the determination of fibric acids.
Sample PreparationOne part of the tissue was homogenized in nine volumes of 0.25 M sucrose–1 mM ethylenediaminetetraacetic acid–10 mM potassium phosphate buffer (pH 7.4) in a Potter glass-Teflon homogenizer. The resulting homogenates were divided into small portions, frozen in liquid nitrogen and then stored at −30°C until use.
Apparatus and HPLC ConditionsThe chromatographic analysis was carried out on a Shimadzu HPLC system (Shimadzu Corporation; Kyoto, Japan) equipped with a solvent delivery pump (LC-20AT), a degasser (DGU-20A3), a system controller (SCL 10AVP) and a fluorescence detector (RF-10AXL). The analytical column was a reversed-phase YMC-Pack Pro C18 (100×4.6 mm, 3 µm particle), supplied by YMC Co. (Kyoto, Japan). The column was kept at 40°C. Isocratic separation was achieved at a flow rate of 1.0 mL/min using a mobile phase consisting of acetonitrile–water (43 : 57, v/v) for MDMC derivatives of clofibric and bezafibric acids and of acetonitrile–water (46 : 54, v/v) for MDMC derivatives of clofibric and fenofibric acids. After the MDMC derivatives of fibric acids were eluted, the column was washed with methanol at a flow rate of 1.0 mL/min for 15 min to remove the contaminants, which were retained on the column. The fluorescence excitation and emission wavelengths were set at 340 and 425 nm, respectively.
Extraction and DerivatizationTissue homogenate (100 µL of homogenate equivalent to 10 mg of tissue) or serum (100 µL) was placed in a screw-cap glass tube. To the tube were added an internal standard (IS), 400 µL of water and 1 mL of 0.5 M HCl, and then the mixture was vortex-mixed. ISs used were as follows: clofibric acid for the determination of bezafibric acid and fenofibric acid, and bezafibric acid for the determination of clofibric acid; the ISs were dissolved in methanol–water (90 : 10, v/v). The samples were extracted 2 times with 3 mL of n-hexane–ethyl acetate (85 : 15, v/v) by shaking, and the samples were centrifuged for 10 min at 1780×g after each extraction. The organic phase was transferred to a new glass tube, and fibric acids were back-extracted from the organic phase with 2 mL of 0.1 M disodium hydrogen phosphate by vigorous shaking and the samples were centrifuged. After discarding the organic phase, 2 mL of 0.5 M HCl was added to the resulting aqueous phase. Fibric acids were re-extracted 2 times from the aqueous phase with 3 mL of n-hexane–ethyl acetate (85 : 15, v/v) by shaking, and the samples were centrifuged after each extraction. The extracts were combined and then taken to dryness under a flow of nitrogen at 37°C. To the resulting residue was added 1 mg of dried K2CO3, 100 µL of 0.25% (w/v) BrMDMC in acetone, and 100 µL of 0.0625% (w/v) 18-crown-6-ether in acetonitrile. The tube was capped, heated at 70°C for 60 min, and then cooled at room temperature. After the addition of 200 µL of acetonitrile–acetone (1 : 1, v/v), the mixture was filtered through a Millex®-LH filter (Merck Millipore, Darmstadt, Germany); 10 µL of the filtrate was injected into the HPLC system.
Method ValidationMethod validation was performed according to internationally accepted recommendations for bioanalytical method validation.18) The proposed method was validated with respect to selectivity, linearity, precision and accuracy, recovery, and limit of quantification. (1) Selectivity: Selectivity of the method was investigated against endogenous compounds in the liver. Blanks of homogenates of livers were analyzed under the described chromatographic conditions to determine whether any endogenous compounds might interfere at the retention time of each analyte and IS. (2) Linearity of Calibration Curves: Blank samples of liver homogenates (10 mg of liver) were spiked with fibric acids to produce seven calibration standards in the range of 0.2–20 nmol and with a fixed amount of IS (2 nmol). Calibration curves were prepared by plotting the peak area ratios (peak area of analyte/peak area of IS) against the corresponding ratios of the nominal concentration of fibric acid to that of IS. Linear regression was performed on calibration data. (3) Accuracy, Precision and Recovery: Accuracy and precision were analyzed by spiking fibric acids (0.5, 2.5 and 20 nmol/10 mg of liver) into blank samples of liver homogenates. Precision was determined by repeated analysis (5 replicates) of the samples on the same day and on 5 different days, and was expressed as the percentage of coefficient of variation (CV) of the replicate measurements. The acceptance criterion for precision was a CV not exceeding 15%. Accuracy was calculated as the percentage difference between the measured value and the nominal value, and was expressed as percentage of deviation from the nominal value (% bias). The acceptance criterion for accuracy was a bias value within ±15%. Recovery was determined by assaying five replicates. The absolute recovery of the analyte was calculated by comparing the peak area of processed liver homogenate samples with the corresponding peak area obtained from fibric acids that were directly derivatized and analyzed by HPLC. (4) Limit of Quantification (LOQ): LOQ for the proposed method was established through the analysis of blank liver homogenate samples that contained decreasing concentrations of fibric acids to the lowest level quantified with suitable precision and accuracy (within ±20%).
Mass Spectra of MDMC Derivatives of Fibric AcidsThe fractions of peaks of MDMC derivatives of fibric acids of HPLC chromatogram were repeatedly collected. The eluates were evaporated to dryness in vacuo and the residues were subjected to electron impact (EI)- and FAB-MS structural analyses on a JEOL JMS-700 mass spectrometer (JEOL, Tokyo, Japan).
RNA Isolation and Analysis of Gene ExpressionTotal RNA was isolated from the liver using QIAzol reagent and RNeasy kit (QIAGEN, Hilden, Germany). cDNA was synthesized from 500 ng of total RNA with avian myeloblastosis virus reverse transcriptase (TaKaRa, Shiga, Japan). Polymerase chain reaction (PCR) amplification was carried out using SYBR Premix EX Taq (2x) (Perfect Real Time; TaKaRa, Shiga, Japan). The amplification and detection were performed with the Applied Biosystems Step One Plus™ real time PCR system (Life Technologies Corp., Carlsbad, CA, U.S.A.). The following primers were used: acyl-CoA oxidase 1 (Acox1) forward, 5′-TTC GTG CAG CCA GAT TGG TAG-3′; Acox1 reverse, 5′-CGG CTT TGT CTT GAA TCT TGG-3′; β-actin, forward, 5′-TGC AGA AGG AGA TTA CTG CC-3′; β-actin reverse, 5′-CGC AGC TCA GTA ACA GTC C-3.′ The thermal cycling program was as follows: 10 s denaturation step at 95°C followed by 50 cycles of 5 s denaturation at 95°C, 34 s annealing and extension at 60°C. Melting curve analysis was performed to confirm the real-time PCR products. Changes in gene expression were calculated by using the comparative threshold cycle (Ct) method. Ct values were first normalized by subtracting the Ct value obtained from β-actin (control).
Application of the Method to Liver SamplesRats were fed on a diet containing one of clofibric acid, bezafibric acid or fenofibrate at a dietary concentration of 0.1% (w/w) for 14 d. Livers were isolated as described above, and the mRNA encoding Acox1 in the livers was measured by real time-PCR. The concentrations of the fibric acids in the livers were also measured by the proposed method.
RESULTS AND DISCUSSION
Conditions for Extraction and DerivatizationConsidering that selectivity and sensitivity can be limited by sample clean-up procedures, sample preparation was an important step in the development of this method. To obtain higher recovery values of analytes, however, the number of clean-up steps in a sample preparation procedure should be kept to a minimum. The extraction conditions of fibric acids into organic solvent that was employed in the present study were based on those developed previously by Abe et al.,12) who reported a method for the determination of fenofibric acid in plasma and urine by extraction with a mixed solvent of n-hexane–ethyl acetate (90 : 10, v/v) for the first extraction, and n-hexane–ethyl acetate (95 : 5, v/v) for the second extraction after back-extraction with aqueous disodium hydrogen phosphate, followed by detection with HPLC-UV. In the study, they showed that the higher the proportion of ethyl acetate in a mixed solvent of n-hexane–ethyl acetate, the better the extractability of fenofibric acid from biological samples; in addition, the proportion of ethyl acetate in the extraction solvent should be kept lower than 10% to reduce the extraction of contaminants, which interfere with HPLC-UV analysis. In the current study, n-hexane–ethyl acetate (85 : 15, v/v) was used; this solvent gave very high extraction yields of not only fenofibric acid, but also bezafibric and clofibric acids. This extraction procedure is simple, and provided not only high recoveries of fibric acids from liver homogenates, but also clear chromatograms of HPLC after the derivatization.
We have sought a fluorescent labeling reagent for the determination of fibric acids by HPLC. Among a number of fluorescent labeling reagents for carboxylic acids, BrMDMC was found to be reactive with fibric acids. The reaction scheme is illustrated in Fig. 1. Heating was required to derivatize fibric acids with BrMDMC. In the reaction at 70°C, the fluorescence intensity reached a plateau within 30 min (Fig. 2A). To optimize the amount of BrMDMC used, the derivatization was examined using water and liver homogenates from the untreated control rats, spiked with 1 nmol clofibric acid. In the derivatization reaction of both water and liver homogenate samples, the fluorescence peak area reached a plateau at 125 µg of BrMDMC and 31.5 µg of crown ether; the results that were obtained for the homogenate samples were almost the same as those for the water samples (Fig. 2B). On the basis of these results, the procedure for the derivatization was decided as described in Materials and Methods.

Fig. 1. Scheme of Derivatization Reaction
The proposed method was validated with respect to selectivity, linearity, precision and accuracy, recovery, and limits of quantification, according to internationally accepted recommendations.18)
Selectivity: Chromatographic conditions, in particular the composition of the mobile phase, were crucial in the process of separating the interferences from liver endogenous compounds and quantitation of fibric acids with adequate precision. Figure 3 shows typical chromatograms of MDMC derivatives of fibric acids. Complete separation of the derivatives of three fibric acids was achieved (Figs. 3A, D). Typical chromatograms obtained for blank liver (10 mg of liver) (Figs. 3B, E) and for liver homogenates (10 mg of liver) spiked with three fibric acids (Figs. 3C, F) are also shown. No endogenous compounds were found to interfere with the assay under the present experimental conditions. We also confirmed that no endogenous compounds interfere with the assay using other biological matrices, kidney homogenates, muscle homogenates and serum (Fig. 4). We confirmed that the retention times of MDMC derivatives of fatty acids, lauric and stearic acids, were more than double that of fenofibric acid (unpublished results). The proposed method could quantitate the three fibric acids without interference from endogenous compounds of liver, including a large number of BrMDMC-reactive substances, results that demonstrated the specificity of this proposed method. To verify that the fluorescence peaks of the HPLC chromatogram were MDMC derivatives of fibric acids, the fractions of these peaks were collected and subjected to EI-MS and FAB-MS structural analyses. Mass spectra of all MDMC derivatives of fibric acids were obtained, which provided reliable structural information (Table 1). EI-MS revealed that the heaviest ions of each derivative were the molecular ions peaks [M+] and [M++2] that contain a chlorine atom of the origin to fibric acids. Additionally, the pseudo-molecular ion peaks [M+H]+ observed by FAB-MS confirmed the structure of MDMC-fibric acids.

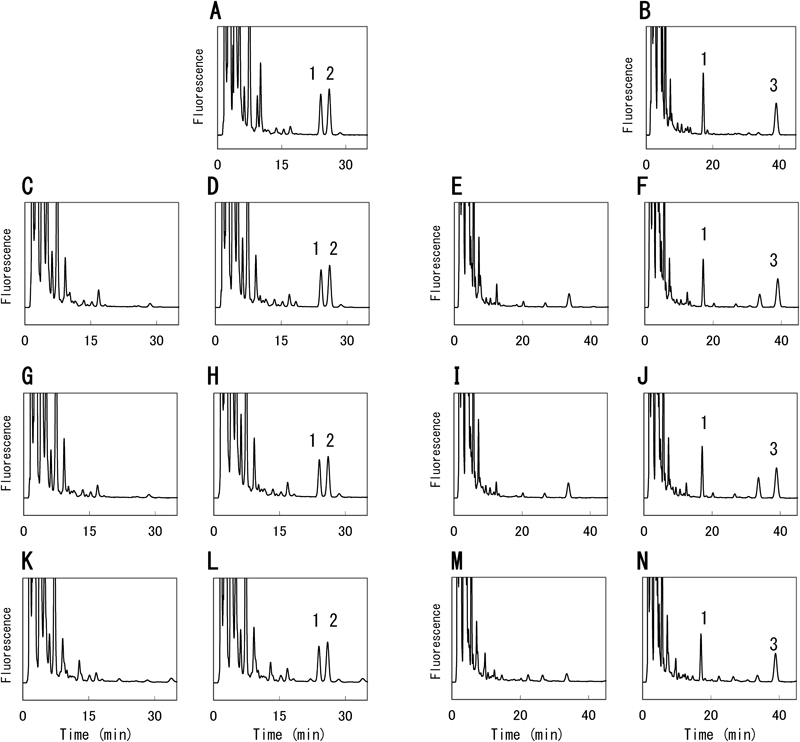
Table 1. EI- and FAB-MS Analyses of MDMC Derivatives of Fibric Acids
| MDMC-fibric acid | Formula | EI-MS (relative intensity) | FAB-MSa) |
|---|
| M+ | M++2 | [M+H]+ |
|---|
| MDMC-clofibric acid | C22H21ClO7 | 432 (66) | 434 (22) | 433 |
| MDMC-bezafibric acid | C31H30ClNO8 | 579 (0.38) | 581 (0.18) | 580 |
| MDMC-fenofibric acid | C29H25ClO8 | 536 (100) | 538 (38) | 537 |
MDMC derivatives of each fibric acid isolated by using HPLC were subject to EI- and FAB-MS analyses. a) Matrix: 3-nitrobenzyl alcohol.
Linearity of Calibration Curves: The calibration curves (y=ax+b) were prepared using blank liver homogenates (10 mg of liver) to which fibric acids had been added in the range of 0.2–20 nmol and a fixed amount of IS (2 nmol). A high correlation was found between the ratio of the nominal amount of fibric acid to respective IS (x) and the peak area ratio (y) (Table 2).
Table 2. Calibration Lines for HPLC Assay of Fibric Acids and LOQ
| Fibric acid | Linear regression equation (y=ax+b) | n |
|---|
| Slope (a) | Intercept (b) | Correlation (r) |
|---|
| Clofibric acid | 0.987 | −0.041 | 1.0000 | 7 |
| Bezafibric acid | 1.167 | 0.007 | 0.9999 | 7 |
| Fenofibric acid | 1.234 | −0.025 | 1.0000 | 7 |
Fibric acids (0.2–2.0 nmol) and IS were added to liver homogenates (10 mg of liver). The determination was made according to the standard procedure.
Accuracy, Precision and Recovery: All values of accuracy and precision were within acceptable limits, with % bias within ±15% and CV no greater than 15% (Table 3). The mean recovery rates were 99.14–107.57% for clofibric acid, 93.03–100.89% for bezafibric acid and 103.41–112.29% for fenofibric acid, results that demonstrated efficient extraction and determination of the fibric acids from liver homogenates (Table 4).
Table 3. Precision and Accuracy for the Determination of Clofibric Acid, Bezafibric Acid and Fenofibric Acid in Rat Liver Homogenates
| Fibric acid | Nominal concentration | Measured concentration | Precision (% CV) | Accuracy (%) |
|---|
| Intraday | | | | |
| Clofibric acid | 0.5 | 0.420±0.001 | 0.21 | −12.33 |
| 2.5 | 2.180±0.023 | 1.00 | −9.72 |
| 20 | 18.118±0.066 | 0.35 | −6.82 |
| Bezafibric acid | 0.5 | 0.533±0.001 | 0.22 | 6.49 |
| 2.5 | 2.582±0.003 | 1.03 | 3.28 |
| 20 | 19.984±0.072 | 0.36 | −0.08 |
| Fenofibric acid | 0.5 | 0.435±0.003 | 0.77 | −12.91 |
| 2.5 | 2.800±0.015 | 0.54 | 12.01 |
| 20 | 21.180±0.296 | 1.40 | 5.90 |
| Interday | | | | |
| Clofibric acid | 0.5 | 0.438±0.000 | 0.06 | −12.49 |
| 2.5 | 2.221±0.007 | 0.30 | −11.16 |
| 20 | 18.530±0.204 | 1.10 | −7.35 |
| Bezafibric acid | 0.5 | 0.533±0.000 | 0.06 | 6.68 |
| 2.5 | 2.625±0.008 | 0.31 | 5.01 |
| 20 | 20.106±0.232 | 1.15 | 0.53 |
| Fenofibric acid | 0.5 | 0.446±0.013 | 2.86 | −10.81 |
| 2.5 | 2.730±0.029 | 1.07 | 9.21 |
| 20 | 21.996±0.430 | 1.96 | 9.98 |
Table 4. Recovery of Fibric Acids from Liver Homogenates at the Three Concentrations
| Fibric acid | Nominal concentration(nmol/10 mg liver) | n | Recovery (%) |
|---|
| Mean | CV (%)a) |
|---|
| Clofibric acid | 0.5 | 5 | 107.57 | 3.17 |
| 2.5 | 5 | 103.72 | 2.82 |
| 20 | 5 | 99.14 | 1.48 |
| Bezafibric acid | 0.5 | 5 | 93.03 | 3.15 |
| 2.5 | 5 | 96.48 | 2.84 |
| 20 | 5 | 100.89 | 1.47 |
| Fenofibric acid | 0.5 | 5 | 103.41 | 5.08 |
| 2.5 | 5 | 108.40 | 1.76 |
| 20 | 5 | 112.29 | 1.86 |
Fibric acid (0.5, 2.5 or 20 nmol) was added to liver homogenates (10 mg of liver). The determination was made according to the standard procedure. a) Coefficient of variation.
LOQ: The LOQ for clofibric, bezafibric and fenofibric acids was 0.2 nmol/10 mg of liver. Previous studies employing HPLC with UV detection reported LOQ for fibric acids, with values ranging from 0.31 to 22.8 nmol/mL of plasma.12–17) A more recent study showed that the utilization of HPLC with tandem MS for the quantitation of fenofibric acid in plasma improved the LOQ, being 0.16 nmol/mL of plasma.19) However, to our knowledge, the LOQ for fibric acids in liver samples have not been reported. Low LOQ in liver samples is important when studying fibric acids working inside the liver. Thus, the LOQ obtained in the present study points to the sensitivity of this method for the quantitation of fibric acids in the liver.
Application of the Method to Actual Analysis of Liver SamplesThe application of the proposed method was demonstrated for the identification and quantitation of fibric acids in the livers of rats fed a diet containing 0.1% (w/w) clofibric acid, bezafibrate (bezafibric acid) or fenofibrate for 14 d. It is known that fibrates (ester forms of fibric acids) are hydrolyzed by esterase(s) in the liver to active metabolites, fibric acids. Accordingly, clofibric acid and bezafibric acid (bezafibrate) themselves are active forms. On the other hand, fenofibrate is required to be hydrolyzed to fenofibric acid in hepatocytes before working functionally. Fibric acids are agonists of PPARα, the activation of which stimulates expression of the gene encoding Acox1. Acox1 is the first characterized PPARα target gene and encodes the rate-limiting enzymes of peroxisomal fatty acid oxidation of fatty acids.20) In accordance with previous findings,20,21) clofibric acid, bezafibric acid and fenofibrate elevated the level of mRNA for Acox1 in the liver in vivo (Fig. 5A). The inductive effects of bezafibrate and fenofibric acid on expression of the Acox1 gene were 5.3- and 4.9-fold, respectively, greater than that of clofibric acid. The concentrations of fibric acids in the livers were measured by the proposed method. The results showed that hepatic concentrations of clofibric acid, bezafibric acid and fenofibric acid were 83, 406 and 384 nmol/g liver, respectively (Fig. 5B). Thus, a large difference was found in the steady-state concentrations between clofibric acid and bezafibric acid or fenofibric acid, despite the fact that the dosages of these agents were the same. Nevertheless, there was no significant difference in the ratio of Acox1 mRNA levels increased by fibric acids to concentrations of fibric acids existing in the liver among the three groups of rats, despite the facts that there is large difference in chemical structure among clofibric, bezafibric and fenofibric acids (Fig. 5C). These results importantly suggest the possibility that the difference in the potency in vivo to elevate Acox1 mRNA level between three fibrates dosed is essentially due to different concentrations of fibric acids existing in the liver and that the molecular potential of the three fibric acids for activating PPARα in the liver is very similar.

Moreover, interestingly, a large peak of an unknown compound was seen at the retention time of around 21 min on the chromatogram of the rats treated with fenofibrate (Fig. 6). Abe et al. demonstrated a reduced form of fenofibric acid, 2-{4-[(4-chlorophenyl)(hydroxy)methyl]phenoxy}-2-methylpropanoic acid, in plasma of rats treated with fenofibrate,12) suggesting the possibility that the unknown fluorescent compound observed in the current study is the reduced form of fenofibric acid, which was formed in the liver. To verify the chemical structure of the unknown fluorescent compound on our chromatogram, we prepared chemically 2-{4-[(4-chlorophenyl)(hydroxy)methyl]phenoxy}-2-methylpropanoic acid from fenofibric acid, and confirmed that the retention time of the unknown fluorescent compound was completely the same as that of MDMC derivative of reduced form of fenofibric acid, on HPLC.
Concluding DiscussionA simple bioanalytical method with HPLC was developed and validated for the precise and accurate determination of fibric acids in the liver. The high sensitivity to quantitate fibric acids without interference from liver components enable this method to be successfully applied to quantitate fibric acids in very small portions of the liver of rats treated with fibrates. A recently reported method, which employs HPLC with tandem MS detection,19) seems to be more sensitive than our proposed method, but the method requires a tandem MS detector. The high sensitivity and simplicity of the presently described method to determine fibric acids should accelerate quantitative studies on the mechanisms underlying the bioactive action of fibric acids in tissues. There is growing interest in the effects of fibric acids as PPARα agonists, so the quantitation of fibric acid in tissues could be interesting in studies on the mechanisms underlying the actions of fibrates in the treatments of diseases, such as hepatic steatosis, hyperlipidemia, metabolic syndrome and diabetes.
Acknowledgment
This work was partly supported by a Grant-in-Aid for Scientific Research from the Ministry of Education, Culture, Sports, Science and Technology of Japan.
REFERENCES
- 1) Keating GM, Croom KF. Fenofibrate: a review of its use in primary dyslipidaemia, the metabolic syndrome and type 2 diabetes mellitus. Drugs, 67, 121–153 (2007).
- 2) Wilding JPH. PPAR agonists fot the treatment of cardiovascular disease in patients with diabetes. Diabetes Obes. Metab., 14, 973–982 (2012).
- 3) Harano Y, Yasui K, Toyama T, Nakajima T, Mitsuyoshi H, Mimani M, Hirasawa T, Itoh Y, Okanoue T. Fenofibrate, a peroxisome proliferator-activated receptor α agonist, reduces hepatic steatosis and lipid peroxidation in fatty liver Shionogi mice with hereditary fatty liver. Liver Int., 26, 613–620 (2006).
- 4) Inoue I, Takahashi K, Katayama S, Akabane S, Negishi K, Suzuki M, Ishii J, Kawazu S. Improvement of glucose tolerance by bezafibrate in non-obese patients with hyperlipidemia and impaired glucose tolerance. Diabetes Res. Clin. Pract., 25, 199–205 (1994).
- 5) Berger J, Wagner JA. Physiological and therapeutic roles of peroxisome proliferator-activated receptors. Diabetes Technol. Ther., 4, 163–174 (2002).
- 6) Schoonjans K, Staels B, Auwerx J. Role of the peroxisome proliferator-activated receptor (PPAR) in mediating the effects of fibrates and fatty acids on gene expression. J. Lipid Res., 37, 907–925 (1996).
- 7) Willson TM, Brown PJ, Sternbach DD, Henke BR. The PPARs: From orphan receptors to drug discovery. J. Med. Chem., 43, 527–550 (2000).
- 8) Forman BM, Chen J, Evans RM. Hypolipidemic drugs, polyunsaturated fatty acids, and eicosanoids are ligands for peroxisome proliferator-activated receptors α and δ. Proc. Natl. Acad. Sci. U.S.A., 94, 4312–4317 (1997).
- 9) Kliewer SA, Sundseth SS, Jones SA, Brown PJ, Wisely GB, Koble CS, Devchand P, Wahli W, Willson TM, Lenhard JM, Lehmann JM. Fatty acids and eicosanoids regulate gene expression through direct interactions with peroxisome proliferator-activated receptors α and γ. Proc. Natl. Acad. Sci. U.S.A., 94, 4318–4323 (1997).
- 10) Barter PJ. Antiatherogenic properties of fibrates. Arterioscler. Thromb. Vasc. Biol., 25, 1095–1096 (2005).
- 11) Luley C, Kegel H, Jakobs C. Improved method for the determination of procetofenic acid in human plasma by gas–liquid chromatography. J. Chromatogr. B Biomed. Appl., 224, 500–502 (1981).
- 12) Abe S, Ono K, Mogi M, Hayashi T. High-performance liquid chromatographic method for the determination of fenofibric acid and reduced fenofibric acid in human blood, plasma and urine. Yakugaku Zasshi, 118, 447–455 (1998).
- 13) Straka RJ, Burkhardt RT, Fisher JE. Determination of fenofibric acid concentrations by HPLC after anion exchange solid-phase extraction from human serum. Ther. Drug Monit., 29, 197–202 (2007).
- 14) Lössner A, Banditt P, Tröger U. Rapid and simple method for detection of fenofibric acid in human serum by high-performance liquid chromatography. Pharmazie, 56, 50–51 (2001).
- 15) Streel B, Hubert Ph, Ceccato A. Determination of fenofibric acid in human plasma using automated solid-phase extraction coupled to liquid chromatography. J. Chromatogr. B Biomed. Sci. Appl., 742, 391–400 (2000).
- 16) Masnatta LD, Cuniberti LA, Rey RH, Werba JP. Determination of bezafibrate, ciprofibrate and fenofibric acid in human plasma by high-performance liquid chromatography. J. Chromatogr. B Biomed. Appl., 687, 437–442 (1996).
- 17) Barra J, Taburet AM, Jardel A, Fessi H, Puisieux F. High-performance liquid chromatographic assay for the simultaneous determination of ethyl clofibrate and clofibric acid in plasma: Evaluation of plasma stability of ethyl clofibrate polylactic nanocapsules in human and rat plasmas. J. Chromatogr. B Biomed. Appl., 661, 178–182 (1994).
- 18) Food and Drug Administration. “Guidance for Industry, Bioanalytical Method Validation.”: ‹http://www.fda.gov/downloads/Drugs/…/Guidances/ucm070107.pdf›, cited May 1, 2001.
- 19) Bhavesh D, Shah S, Shivprakash. Determination of fenofibric acid in human plasma by ultra performance liquid chromatography–electrospray ionization mass spectrometry: application to a bioequivalence study. Biomed. Chromatogr., 23, 922–928 (2009).
- 20) Tugwood JD, Issemann I, Anderson RG, Bundell KR, McPheat WL, Green S. The mouse peroxisome proliferator activated receptor recognizes a response element in the 5′ flanking sequence of the rat acyl CoA oxidase gene. EMBO J., 11, 433–439 (1992).
- 21) Guo L, Fang H, Collins J, Fan XH, Dial S, Wong A, Mehta K, Blann E, Shi L, Tong W, Dragan YP. Differential gene expression in mouse primary hepatocytes exposed to the peroxisome proliferator-activated receptor α agonists. BMC Bioinformatics, 7 (Suppl. 2), S18 (2006).

