Abstract
The human intestinal microbiota (HIM) settles from birth and continues to change phenotype by some factors (e.g. host’s diet) throughout life. However, the effect of extreme life environment on human HIM composition is not well known. To understand HIM fluctuation under extreme life environment in humans, fecal samples were collected from six Japanese men on a long Antarctic expedition. They explored Antarctica for 3 months and collected their fecal samples at once-monthly intervals. Using terminal restriction fragment length polymorphism (T-RFLP) and real time polymerase chain reaction (PCR) analysis, the composition of HIM in six subjects was investigated. Three subjects presented restoration of HIM after the expedition compared versus before and during the expedition. Two thirds samples collected during the expedition belonged to the same cluster in dendrogram. However, all through the expedition, T-RFLP patterns showed interindividual variability. Especially, Bifidobacterium spp. showed a tendency to decrease during and restore after the expedition. A reduction of Bifidobacterium spp. was observed in five subjects the first 1 month of the expedition. Bacteroides thetaiotaomicron, which is thought to proliferate during emotional stress, significantly decreased in one subject, indicating that other factors in addition to emotional stress may affect the composition of HIM in this study. These findings could be helpful to understand the effect of extreme life environment on HIM.
A human intestinal microbiota (HIM) is essential to the health of the host and plays important roles in nutrient absorption, development of the mucosal immune system, resistance to colonization by pathogens and metabolism of xenobiotics.1–4) Humans have harbored a vast and complex society of bacteria from birth and interacted with the bacterial complex.4) The HIM includes native species that permanently colonize the tract and temporary species that transit through the tract.1) Moreover, the establishment and maintenance of the HIM is continuously influenced by several factors such as diets, drugs (e.g. antibiotics), and health status.5–10) Even emotional stress, fatigue, and extreme conditions were reported as the factors.11–14)
However, it is difficult to precisely control some possible factors such as a body temperature, stress, and diets for evaluation the effect on the fecal microbiota in human because of ethic problem and safety. As a result, some animal studies have been conducted instead of clinical studies with human.15–20)
Six members whose mission is to investigate and collect meteorites explored the Sør Rondane Mountains in Antarctica for three months. They are exposed to extremely low temperature and strong ultraviolet radiation during the expedition and maybe suffer stress by carrying out their missions, possibly followed by alteration of HIM. In this study, we tried to analyze the fecal microbiota of the members of Antarctic expedition by terminal restriction fragment length polymorphism (T-RFLP) and real time polymerase chain reaction (PCR) for evaluating alteration of the microbiota induced by an expedition.
MATERIALS AND METHODS
Fecal SpecimensSix healthy explorer (all Japanese men) between 37 and 55 years of age (average=43 years old) participated in the study. The first fecal samples were collected before the departure to the Antarctica from Japan. The second, third and forth samples were collected once a month after beginning exploration. The fifth samples were collected after returning back to Japan. The study was approved by the Ethical Committee of Japan Aerospace Exploration Agency (JAXA, Tsukuba, Japan). Written informed consent was taken by the all participants in this study.
DNA Isolation from Fecal SamplesAbout 40 to 100 mg of fresh fecal samples were suspended in 500 mL of TE (10 mM Tris–HCl pH 8.0), 1 mM ethylenediaminetetraacetic acid (EDTA)) and centrifuged at 20800×g for 5 min. The supernatant was thrown away. This washing step was repeated 3 times. After 600 µL of TE, 600 µL of Tris-saturated phenol, 100 µL of 10% sodium dodecyl sulfate, and 0.3 g of glass beads (diameter, 0.15–0.21 mm) were added, the samples were treated at 7000 rpm for 20 s on a MagNA Lyser (Roche, Penzberg, Germany). And then, the samples were incubated at 70°C for 10 min. This crushing step was repeated 2 times. Six hundred microliter of upper layer was transferred in to a 1.5 mL tube, followed by addition of 600 µL of glacial isopropanol and 60 µL of 3 M sodium acetate. After shaking gently, the solutions were centrifuged at 20800×g for 5 min and then the supernatant was thrown away by decantation. The DNA pellet was washed with glacial 70% ethanol and dried on a centrifuge evaporator (Eyela, Tokyo, Japan) for 15 min. Then, the pellet was dissolved in 200 µL of TE. Next, the DNA preparation was purified by using the high pure PCR template preparation kit (Roche) and quantified with a Nanodrop 2000c (Thermo Scientific, Wilmington, DE, U.S.A.).
PCR Amplification and T-RFLP AnalysisThe amplification of the fecal 16S ribosomal DNA (rDNA), restriction enzyme digestion, size-fractionation of terminal restriction fragments (T-RFs) and the T-RFLP analysis were carried out described previously.21,22) PCR was performed using the total fecal DNA and the primers of 5′ FAM-labeled 516f (5′-TGC CAG CAG CCG CGG TA-3′; Escheriachia coli positions 516 to 532) and 1510r (5′-GGT TAC CTT GTT ACG ACT T-3′; E. coli positions 1510 to 1492). The resulting 16S rDNA amplicons were treated with 2 U of BslI (New England Biolabs, Ipswich, MA, U.S.A.) for 1 h and the digestives were fractionated using an automated sequence analyzer, ABI PRISM 3130xl DNA Sequencer (Applied Biosystems, Carlsbad, CA, U.S.A.) and GeneMapper (Applied Biosystems).
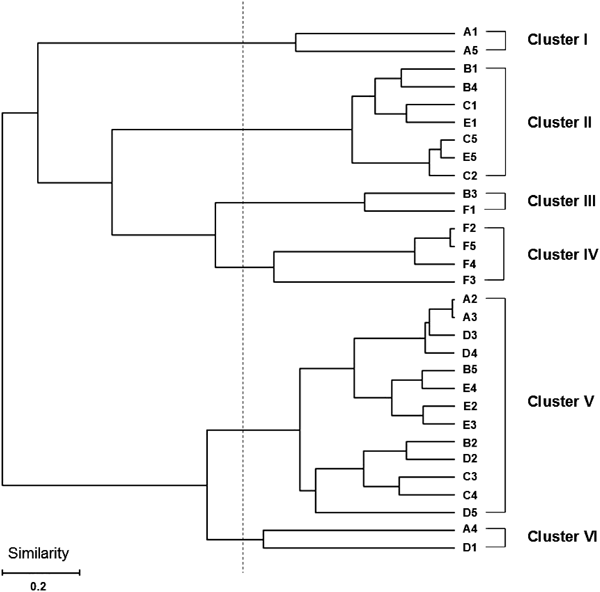
Assignment of T-RFs DetectedThe major T-RFs were identified by computer simulation, which was performed using a T-RFLP analysis program, (MiCA3 by Shyu et al.23); http://mica.ibest.uidaho.edu/), a phylogenetic assignment database for T-RFLP analysis of human colonic microbiota (PAD-HCM),24) and Microbiota Profiler (InfoCom Co., Tokyo, Japan). Cluster analysis was performed using Microbiota Profiler (InfoCom Co.) based on nineteen operational taxonomic units (OTUs) distributed from the T-RFs by the method of Nagashima et al.22) The distances were calculated to determine any similarity among the samples and were represented graphically by constructing a dendrogram.
Real-Time PCR AssaysRelative levels of Bifidobacterium and Bacteroides (B.) thetaiotaomicron to total fecal bacteria were analyzed using real-time PCR with SYBR Premix Ex Taq II (TaKaRa Bio, Shiga, Japan) and Thermal Cycler Dice Real Time System (TaKaRa Bio). The fold value in target bacteria, normalized to 16S rRNA gene of total bacteria and relative to the levels of samples collected before the expedition, was calculated for each sample using 2−ΔΔCt method.25) The primer sets used are shown in Table 1. Amplifications were performed using the following temperature profiles: one cycle at 95°C for 30 s, 45 cycles of denaturation at 95°C for 5 s, annealing at 55°C (Bifidobacterium spp. and total bacteria) and 60°C (B. thetaiotaomicron) for 30 s, and extension at 72°C for 60 s. Fecal DNA samples were diluted to 10 ng/µL and the real time PCR reaction mixture was composed of 20-fold diluted template DNA.
Table 1. Primer Sets for Real Time PCR
| Target | Primer | Sequence (5′ to 3′) | Reference |
|---|
| Bifidobacterium spp. | g-Bifid-F | CTCCTGGAAACGGGTGG | 35) |
| g-Bifid-R | GGTGTTCTTCCCGATATCTACA | |
| B. thetaiotaomicron | B. thetaF | AACAGGTGGAAGCTGCGGA | 36, 37) |
| B. thetaR | AGCCTCCAACCGCATCAA | |
| Total bacteria | Forward | TCCTACGGGAGGCAGCAGT | 38) |
| Reverse | GGACTACCAGGGTATCTAATCCTGTT | |
The dendrogram were established by Euclidean distance between correlation and coefficients and the unweighted pair-group methods with arithmetic means (UPGMA) algorithm. The T-RFs were quantified as the percentage of individual T-RF peak area per total T-RF peak areas, and this was expressed as the percentage of the area under the peak curve (% AUC). The nineteen OTUs, aforementioned, were used in principal component analysis to compare and group T-RFLP patterns. The principle component analysis was performed using PASW Statistics 18 (IBM, Armonk, NY, U.S.A.).
RESULTS
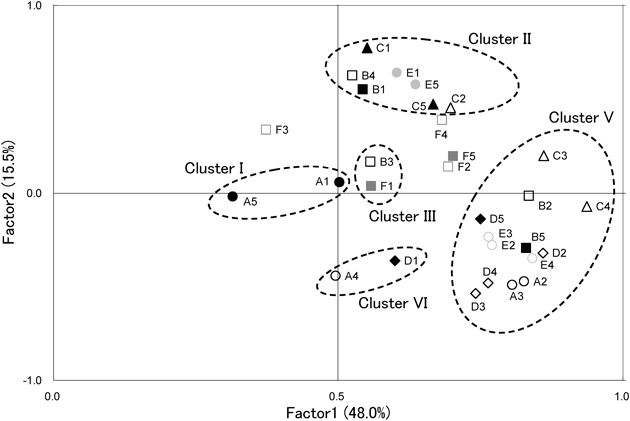
T-RFLP Analysis and Clustering of Fecal Microbiota in Members of Antarctic ExpeditionShown in Fig. 1, almost samples collected during expedition were included in cluster V. 61.1% of all samples collected during the expedition belong to cluster V. 84.6% of sample included in cluster V were the samples collected during the expedition. Shown in clusters I and II, three subjects, A, C and E, showed restoration to their original states. Subject C particularly showed typical restoration that samples collected before and after the expedition were included in same cluster and samples collected during the expedition belong to same cluster. Subject D, however, did not show the restoration because sample collected after the expedition was included in the same cluster with samples during the expedition. Subject B showed dramatic change among clusters for the entire period. In dendrogram, subject F showed little change during and after expedition. It means that the pattern of microbiota was not restored by returning to common life. Principal components analysis also showed same patterns with cluster analysis (Fig. 2).
Characteristics of OTU to Each Clusters and IndividualsThe proportion of OTU 124 that was presumed to correspond to bifidobacteria decreased in the subjects A, C and E and the proportion was restored after the expedition (Fig. 3). Subject B also showed decrease in the proportion of OUT 124, but dramatic increase was observed in the sample of B4. The mean proportion of OTU 955 was 7.7% before the expedition, but after a month, the proportion was increased to 24.1% significantly (t-test, p<0.001). OTU 955 was presumed to correspond to Clostridium subcluster XIVa including Ruminococcus obeum, Clostridium bolteae, Blautia wexlerae, and Clostridium asparagiforme (Table 2). The proportion of OTU469 that was presumed to correspond to Bacteroides was reduced to ground level during the expedition and restored to original level in subject A. The proportion of OTU650 that was presumed to correspond to Clostridium cluster XVIII showed a tendency to increase during and after the expedition. The proportion of OTU749 that was presumed to correspond to Clostridium cluster IV decreased during the expedition in subject A and D. The proportion of OTU940 that was presumed to correspond to Clostridium subcluster XIVa and Enterobacteriales dramatically decreased during and after the expedition in subject F.
Table 2. Correspondence of OTUs to Predicted Bacteria by Theoretical Digestion with
BslI
| OTU | Predicted bacteria from T-RFLP |
|---|
| 106 | Prevotella ruminicola | | |
| 110 | Mitsuokella jalaludinii | Selenomonas ruminantium | Selenomonas sputigena |
| Selenomonas infelix | Megasphaera elsdenii | Veillonella parvula |
| Veillonella dispar | Eggerthella lenta | Paraeggerthella hongkongensis |
| Akkermansia muciniphila | Coprococcus catus | |
| 124 | Bifidobacterium adolescentis | Bifidobacterium gallicum | Bifidobacterium bifidum |
| Bifidobacterium longum | Bifidobacterium pseudocatenulatum | |
| 168 | ND | | |
| 332 | Streptococcus bovis | Prevotella buccalis | Streptococcus sanguinis |
| Streptococcus oralis | Streptococcus mutans | |
| Clostridium mayombei | Streptococcus macedonicus | |
| 338 | Clostridium bartlettii | Clostridium lituseburense | |
| 366 | Prevotella bryantii | Prevotella stercorea | Bacteroides coprocola |
| Bacteroides coprophilus | Bacteroides plebeius | |
| 469 | Bacteroides splanchnicus | Clostridium propionicum | Bacteroides ovatus |
| Bacteroides fragilis | Bacteroides distasonis | Bacteroides vulgatus |
| Bacteroides caccae | Bacteroides eggerthii | Bacteroides uniformis |
| Bacteroides dorei | Bacteroides intestinalis | Bacteroides xylanisolvens |
| Bacteroides nordii | Bacteroides salyersiae | Bacteroides thetaiotaomicron |
| Bacteroides cellulosilyticus | Parabacteroides merdae | Parabacteroides johnsonii |
| Parabacteroides distasonis | Parabacteroides goldsteinii | Alistipes finegoldii |
| Alistipes onderdonkii | Brachyspira aalborgi | Clostridium hiranonis |
| Victivallis vadensis | Helicobacter canadensis | Eubacterium dolichum |
| Eubacterium tortuosum | | |
| 494 | Eubacterium cylindroides | Clostridium nexile | Clostridium clostridioforme |
| Peptostreptococcus anaerobius | Clostridium halophilum | Coprococcus eutactus |
| Clostridium oroticum | Clostridium fusiformis | Coprococcus comes |
| Blautia schinkii | Eubacterium ventriosum | Eubacterium eligens |
| 505 | Clostridium barati | Clostridium disporicum | Clostridium coccoides |
| Clostridium saccharolyticum | Clostridium methoxybenzovorans | Blautia producta |
| 520 | Enterococcus faecalis | Enterococcus faecium | Enterococcus hirae |
| Enterococcus azikeevi | Enterococcus durans | Lactobacillus casei |
| 650 | Holdemania filiformis | Campylobacter hominis | |
| 657 | Lactobacillus salivarius | Streptococcus constellatus | Streptococcus mitis |
| Streptococcus parasanquinis | Streptococcus salivarius | Streptococcus vestibular |
| Streptococcus thermophilus | Streptococcus salivalius | Streptococcus anginosus |
| Weissella kimchii | Lactobacillus mucosae | Lactobacillus acidophilus |
| Enterococcus caccae | Lactobacillus fermentum | Lactobacillus ruminis |
| Leuconostoc mesleftoides | Lactobacillus gasseri | Lactobacillus crispatus |
| Yersinia rohdei | Hafnia alvei | Proteus mirabilis |
| Vibrio furnissii | Lactobacillus salivarius ssp. salicinius | |
| 749 | Clostridium saccharogumia | Butyrate-producing bacterium | Faecalibacterium prausnitzii |
| Subdoligranulum variabile | Clostridium ghonii | |
| 754 | Clostridium perfringens | Eubacterium tenue | Clostridium difficile |
| Roseburia intestinalis | Roseburia hominis | Eubacterium halii |
| Clostridium symbiosum | Roseburia cecicola | Roseburia inulinivorans |
| Clostridium scindens | | |
| 770 | ND | | |
| 853 | ND | | |
| 919 | Lachnospira pectinoschiza | | |
| 940 | Clostridium litorale | Ruminococcus albus | Clostridium sphenoides |
| Clostridium polysaccharolyticum | Clostridium butyricum | Cetobacterium somerae |
| Clostridium algidixylanolyticum | Clostridium indolis | Roseburia faecis |
| Clostridium celerecrescens | Butyrivibrio fibrisolvens | Clostridium hathewayi |
| 955 | Ruminococcus obeum | Blautia wexlerae | Clostridium asparagiforme |
| 968 | Clostridium felsineum | | |
| 990 | ND | | |
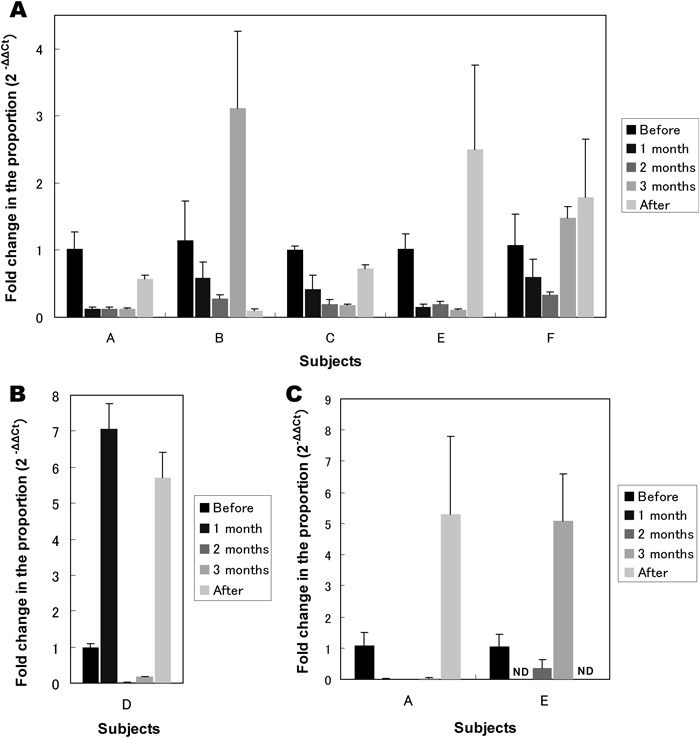
With specific primers, relative change in proportion of bifidobacteria and B. thetaiotaomicron was evaluated with real time PCR analysis (Fig. 4). Almost same pattern with T-RFLP analysis were observed. Especially, in subjects A, C and E, the relative proportion decreased during the expedition and was restored after the expedition in bifidobacteria. In B. thetaiotaomicron, subject A showed a decrease during the expedition in the relative proportion and restoration after returning to Japan.
DISCUSSION
In this study, we analyzed fecal microbiota of Antarctic expeditioners by T-RFLP to make it clear whether long-term exposure to the extreme environment affects HIM. T-RFLP is rapid and reproducible tool that allows an easy assessment of the diversity of complex bacterial communities culture-independently.26–30) For T-RFLP analysis, 516f-BslI combination which is considered to be useful for fully assigning bacterial species to the T-RFs and suitable for analysis of some species of Bifidobacteirum was selected.21)
Most of the samples collected during the expedition were included in cluster V. There are some possible factors affected the composition of fecal bacteria during the expedition. Dietary similarity is the one of the possible factors.
Next, cold stress may be another factor of the conversion because of awfully low temperature of Antarctic area. Acute cold stress may induce systemic biochemical and physiological changes which related with intestinal bacteria. The exposure to cold stress altered the urinary excretion level of some metabolites which are believed to be produced by the gut microbial community.15,31) Human physiological responses to cold exposure are systemic and extensive.32) The pathway how cold stress affects the composition of fecal bacteria has not fully elucidated. However, some factors can be raised. Lowering colonic temperature can affect the composition.16) In animal experiments the cold-stressed mice had lower colonic temperature compared with control groups. It can alter the environment for growth of certain bacteria and then influence the composition. And, the above-mentioned changes of metabolic patterns by cold stress affect the composition of human intestinal bacteria.15) Furthermore, a change of food intake which could affect the gastrointestinal microbiota by altering and/or favoring the multiplication of certain anaerobic species is one of the results of cold stress.17,33) Cold pain significantly delayed gastric emptying and biphasic alteration in both gastric secretion and pancreatic trypsin output, followed by losing appetite. Such a change in food intake could alter intestinal environment (e.g. pH, oxidation-reduction potential etc.) and metabolic patterns, finally induce dramatic perturbation of HIM.
All through the expedition, T-RFLP patterns showed interindividual variability. The case of a treatment of ciprofloxacin, broad-spectrum antibiotic, and controlled diet can be the good examples. When ciprofloxacin was treated, fecal bacterial communities of three subjects were influenced abundantly, however, the abundance and pattern varied among individual.9) Also, though the monotonous diet including high-beef regimen influenced the composition of intestinal bacteria, wide variation between different individuals on the same diet was observed.10) Likewise, because initial communities of intestinal bacteria of each Antarctic expeditioner are variable, their responses to the above-mentioned factors may vary.
When evaluating the change of fecal microbiota induced by the expedition, controlled factors (e.g. diet) make clear the response to the certain factor. However, it was not investigated in this study. Controlled life patterns (e.g. diet) during the expedition are likely to be a stress for the members. Of course, not all stressors are equally influential on all individuals, and the members cope with these stressors in the different way.34) Moreover, since they already had a mission which they undertook during the expedition, it is hard to restrict the environments for other researches.
A certain of psychological stress induced by extreme environments (e.g. cold exposure and ultraviolet), physical work, and circadian rhythm could be expected during the expedition. It has been reported that exposure to such stressors significantly change microbial populations in intestine.11–14,17) Holdeman et al.11) showed that emotional stress affected human intestinal bacteria, especially the population of B. thetaiotaomicron and Blautia producta. In this study, the change of Blautia producta was not evaluated because OTU505 was presumed to contain the species did not show remarkable change and the culture-independent method for detection of the species was not established yet. For evaluating the change of B. thetaiotaomicron, we analyzed B. thetaiotaomicron by real time PCR with specific primers because the proportion of OTU469 was presumed to correspond to Bacteroides did not detected during the expedition and restored by returning to the common life in subject A. Actually, B. thetaiotaomicron was not significantly changed in the experiment with graduate students having an upcoming exam.11) It assumed that in addition to emotional stress, other factor may affect the composition of human intestinal bacteria. Liźko et al.14) reported the decrease in counts of bifidobacteria and Lactobacilli due to nervous-emotional stress and Logan et al.12) showed that patient with chronic fatigue syndrome had marked alterations in microbiota, including lowered levels of bifidobacteria. The reports are identical to the present result. Same patterns of decreased bifidobacteria during the expedition were detected in not only subject A, but subjects B, C and E. However, dramatic and slight increase of OTU124 after three months of the expedition observed in subjects B and F, respectively. For confirming the alterations of Bifidobacterium spp., real-time PCR was conducted with the same fecal DNA samples. Then, almost same patterns with T-RFLP were observed in relative values to total bacteria, indicating that the proportion of bifidobacteria decreased during the expedition in subjects A, B, C and E. Because absolute quantities of bifidobacteria were so small, in subject D, inflated changes were observed (Fig. 4B).
Also, in subject E, the population of OTU657 corresponding to lactic acid bacteria (LAC) was decreased to ground level during the expedition and slightly recovered after expedition. However, subjects B and F showed increased population of LAC during the expedition. Different responses to stress and adoption to the extreme surroundings can be reasons of various patterns.
In this study, the approaches with culture-independent method, T-RFLP, was used for analyzing the alteration of HIM induced by long time exposure to extreme environment during Antarctic expedition. And, a change at the species level was concretely analyzed with real time PCR. However, an entire picture of the change was not revealed yet.
Acknowledgments
This work is performed under the collaborative research between Japan Aerospace Exploration Agency and National Institute of Polar Research Japan. We would like take this opportunity to thank all participants and Dr. Inokuchi, Dr. Morikawa, Dr. Okada, Dr. Yoshida for their dedicated contribution for this project.
REFERENCES
- 1) Guarner F. Enteric flora in health and disease. Digestion, 73 (Suppl. 1), 5–12 (2006).
- 2) Servin AL. Antagonistic activities of lactobacilli and bifidobacteria against microbial pathogens. FEMS Microbiol. Rev., 28, 405–440 (2004).
- 3) Li M, Wang B, Zhang M, Rantalainen M, Wang S, Zhou H, Zhang Y, Shen J, Pang X, Zhang M, Wei H, Chen Y, Lu H, Zuo J, Su M, Qiu Y, Jia W, Xiao C, Smith LM, Yang S, Holmes E, Tang H, Zhao G, Nicholson JK, Li L, Zhao L. Symbiotic gut microbes modulate human metabolic phenotypes. Proc. Natl. Acad. Sci. U.S.A., 105, 2117–2122 (2008).
- 4) Hooper LV. Bacterial contributions to mammalian gut development. Trends Microbiol., 12, 129–134 (2004).
- 5) Turnbaugh PJ, Ridaura VK, Faith JJ, Rey FE, Knight R, Gordon JI. The effect of diet on the human gut microbiome: a metagenomic analysis in humanized gnotobiotic mice. Sci. Transl. Med., 1, 6ra14 (2009).
- 6) Matsumoto M, Kakizoe K, Benno Y. Comparison of fecal microbiota and polyamine concentration in adult patients with intractable atopic dermatitis and healthy adults. Microbiol. Immunol., 51, 37–46 (2007).
- 7) Nishikawa J, Kudo T, Sakata S, Benno Y, Sugiyama T. Diversity of mucosa-associated microbiota in active and inactive ulcerative colitis. Scand. J. Gastroenterol., 44, 180–186 (2009).
- 8) Hooper LV, Midtvedt T, Gordon JI. How host-microbial interactions shape the nutrient environment of the mammalian intestine. Annu. Rev. Nutr., 22, 283–307 (2002).
- 9) Dethlefsen L, Huse S, Sogin ML, Relman DA. The pervasive effects of an antibiotic on the human gut microbiota, as revealed by deep 16S rRNA sequencing. PLoS Biol., 6, e280 (2008).
- 10) Maier BR, Flynn MA, Burton GC, Tsutakawa RK, Hentges DJ. Effects of a high-beef diet on bowel flora: a preliminary report. Am. J. Clin. Nutr., 27, 1470–1474 (1974).
- 11) Holdeman LV, Good IJ, Moore WE. Human fecal flora: variation in bacterial composition within individuals and a possible effect of emotional stress. Appl. Environ. Microbiol., 31, 359–375 (1976).
- 12) Logan AC, Venket Rao A, Irani D. Chronic fatigue syndrome: lactic acid bacteria may be of therapeutic value. Med. Hypotheses, 60, 915–923 (2003).
- 13) Liźko NN. The dysbacteriosis of extreme states. Antibiot. Med. Biotekhnol., 32, 184–186 (1987).
- 14) Liźko NN, Silov VM, Syrych GD. Events in the development of dysbacteriosis of the intestines in man under extreme conditions. Nahrung, 28, 599–605 (1984).
- 15) Wang X, Su M, Qiu Y, Ni Y, Zhao T, Zhou M, Zhao A, Yang S, Zhao L, Jia W. Metabolic regulatory network alterations in response to acute cold stress and ginsenoside intervention. J. Proteome Res., 6, 3449–3455 (2007).
- 16) Won SJ, Lin MT. Thermal stresses reduce natural killer cell cytotoxicity. J. Appl. Physiol., 79, 732–737 (1995).
- 17) Moro MH, Beran GW, Hoffman LJ, Griffith RW. Effects of cold stress on the antimicrobial drug resistance of Escherichia coli of the intestinal flora of swine. Lett. Appl. Microbiol., 27, 251–254 (1998).
- 18) Anderlik P, Szeri I, Bános Z, Barna Z. Bacterial translocation after cold stress in young and old mice. Acta Microbiol. Hung., 37, 289–294 (1990).
- 19) Wang SX, Wu WC. Effects of psychological stress on small intestinal motility and bacteria and mucosa in mice. World J. Gastroenterol., 11, 2016–2021 (2005).
- 20) Bailey MT, Dowd SE, Parry NM, Galley JD, Schauer DB, Lyte M. Stressor exposure disrupts commensal microbial populations in the intestines and leads to increased colonization by Citrobacter rodentium. Infect. Immun., 78, 1509–1519 (2010).
- 21) Nagashima K, Hisada T, Sato M, Mochizuki J. Application of new primer-enzyme combinations to terminal restriction fragment length polymorphism profiling of bacterial populations in human feces. Appl. Environ. Microbiol., 69, 1251–1262 (2003).
- 22) Nagashima K, Mochizuki J, Hisada T, Suzuki S, Shimomura K. Phylogenetic analysis of 16S ribosomal RNA gene sequences from human fecal microbiota and improved utility of terminal restriction fragment length polymorphism profiling. Bioscience and Microflora, 25, 99–107 (2006).
- 23) Shyu C, Soule T, Bent SJ, Foster JA, Forney LJ. MiCA: a web-based tool for the analysis of microbial communities based on terminal-restriction fragment length polymorphisms of 16S and 18S rRNA genes. Microb. Ecol., 53, 562–570 (2007).
- 24) Matsumoto M, Sakamoto M, Hayashi H, Benno Y. Novel phylogenetic assignment database for terminal-restriction fragment length polymorphism analysis of human colonic microbiota. J. Microbiol. Methods, 61, 305–319 (2005).
- 25) Livak KJ, Schmittgen TD. Analysis of relative gene expression data using real-time quantitative PCR and the 2−ΔΔCt method. Methods, 25, 402–408 (2001).
- 26) Nomura T, Ohkusa T, Okayasu I, Yoshida T, Sakamoto M, Hayashi H, Benno Y, Hirai S, Hojo M, Kobayashi O, Terai T, Miwa H, Takei Y, Ogihara T, Sato N. Mucosa-associated bacteria in ulcerative colitis before and after antibiotic combination therapy. Aliment. Pharmacol. Ther., 21, 1017–1027 (2005).
- 27) Liu WT, Marsh TL, Cheng H, Forney LJ. Characterization of microbial diversity by determining terminal restriction fragment length polymorphisms of genes encoding 16S rRNA. Appl. Environ. Microbiol., 63, 4516–4522 (1997).
- 28) Sakamoto M, Takeuchi Y, Umeda M, Ishikawa I, Benno Y. Application of terminal RFLP analysis to characterize oral bacterial flora in saliva of healthy subjects and patients with periodontitis. J. Med. Microbiol., 52, 79–89 (2003).
- 29) Sakamoto M, Hayashi H, Benno Y. Terminal restriction fragment length polymorphism analysis for human fecal microbiota and its application for analysis of complex bifidobacterial communities. Microbiol. Immunol., 47, 133–142 (2003).
- 30) Kitts CL. Terminal restriction fragment patterns: a tool for comparing microbial communities and assessing community dynamics. Curr. Issues Intest. Microbiol., 2, 17–25 (2001).
- 31) Dumas ME, Barton RH, Toye A, Cloarec O, Blancher C, Rothwell A, Fearnside J, Tatoud R, Blanc V, Lindon JC, Mitchell SC, Holmes E, McCarthy MI, Scott J, Gauguier D, Nicholson JK. Metabolic profiling reveals a contribution of gut microbiota to fatty liver phenotype in insulin-resistant mice. Proc. Natl. Acad. Sci. U.S.A., 103, 12511–12516 (2006).
- 32) Stocks JM, Taylor NA, Tipton MJ, Greenleaf JE. Human physiological responses to cold exposure. Aviat. Space Environ. Med., 75, 444–457 (2004).
- 33) Thompson DG, Richelson E, Malagelada JR. Perturbation of upper gastrointestinal function by cold stress. Gut, 24, 277–283 (1983).
- 34) Wood J, Lugg DJ, Hysong SJ, Harm DL. Psychological changes in hundred-day remote Antarctic field groups. Environ. Behav., 31, 299–337 (1999).
- 35) Matsuki T, Watanabe K, Fujimoto J, Kado Y, Takada T, Matsumoto K, Tanaka R. Quantitative PCR with 16S rRNA-gene-targeted species-specific primers for analysis of human intestinal bifidobacteria. Appl. Environ. Microbiol., 70, 167–173 (2004).
- 36) Teng LJ, Hsueh PR, Huang YH, Tsai JC. Identification of Bacteroides thetaiotaomicron on the basis of an unexpected specific amplicon of universal 16S ribosomal DNA PCR. J. Clin. Microbiol., 42, 1727–1730 (2004).
- 37) Carson CA, Christiansen JM, Yampara-Iquise H, Benson VW, Baffaut C, Davis JV, Broz RR, Kurtz WB, Rogers WM, Fales WH. Specificity of a Bacteroides thetaiotaomicron marker for human feces. Appl. Environ. Microbiol., 71, 4945–4949 (2005).
- 38) Nadkarni MA, Martin FE, Jacques NA, Hunter N. Determination of bacterial load by real-time PCR using a broad-range (universal) probe and primers set. Microbiology, 148, 257–266 (2002).