Abstract
Beneficial effect of eugenol on fatty liver was examined in hepatocytes and liver tissue of high fat diet (HFD)-fed C57BL/6J mice. To induce a fatty liver, palmitic acid or isolated hepatocytes from HFD-fed Sprague-Dawley (SD) rats were used in vitro studies, and C57BL/6J mice were fed HFD for 10 weeks. Lipid contents were markedly decreased when hepatocytes were treated with eugenol for up to 24 h. Gene expressions of sterol regulatory element binding protein 1 (SREBP1) and its target enzymes were suppressed but those of lipolysis-related proteins were increased. As a regulatory kinase for lipogenic transcriptional factors, the AMP-activated protein kinase (AMPK) signaling pathway was examined. Protein expressions of phosphorylated Ca2+-calmodulin dependent protein kinase kinase (CAMKK), AMPK and acetyl-CoA carboxylase (ACC) were significantly increased and those of phosphorylated mammalian target of rapamycin (mTOR) and p70S6K were suppressed when the hepatocytes were treated with eugenol at up to 100 µM. These effects were all reversed in the presence of specific inhibitors of CAMKK, AMPK or mTOR. In vivo studies, hepatic triglyceride (TG) levels and steatosis score were decreased by 45% and 72%, respectively, in eugenol-treated mice. Gene expressions of fibrosis marker protein such as α-smooth muscle actin (α-SMA), collagen type I (Col-I) and plasminogen activator inhibitor-1 (PAI-1) were also significantly reduced by 36%, 63% and 40% in eugenol-treated mice. In summary, eugenol may represent a potential intervention in populations at high risk for fatty liver.
Non-alcoholic fatty liver disease (NAFLD) is one of the most common liver ailment worldwide.1) While hepatic steatosis is often asymptomatic, it can progress to non-alcoholic steatohepatitis (NASH). If untreated, NASH can progress to cirrhosis and increased risk of early mortality.2) Obesity and insulin resistance, as seen in type 2 diabetes mellitus (T2DM), and hypertriglyceridemia are well-documented risk factors for NAFLD.3) These factors are key targets for prevention and therapy of NAFLD tends to focus on addressing the obesity or insulin resistance rather than NAFLD itself. NAFLD in the hepatic steatosis (HS) phase can be reversed by lifestyle modification, while NASH is more difficult to treat. Thus, preventing the progression of HS to NASH is of primary importance. Lifestyle recommendations for NAFLD are generally limited to losing weight through energy restriction and/or increasing physical activity, which is often to fail to hold on to them. With this notion, phytochemicals obtained from medicinal plants or foods are attracting alternative options for the treatment of NAFLD and prevention to progress to NASH.
Eugenol (4-allyl-2-methoxyphenol) has been identified in several aromatic plants such as cloves, cinnamon, basil and nutmeg as a supplement or a therapeutic ingredient in various medications and foods. In addition, it is widely used in agricultural applications to protect foods from microorganisms during storage and as a pesticide and fumigant. As a functional ingredient, it is included in many dental preparations and it has also been shown to enhance skin permeation of various drugs.4) In recent years, eugenol has been reported to have antioxidant,5) anti-inflammatory,6) anti-viral7) and anti-cancer8–10) activities. Although beneficial effects of eugenol on oxidative stress and inflammation have been well-studied, pharmacological effects on metabolic diseases are largely unknown. Here, we examined whether eugenol has a beneficial effect on NAFLD and mechanism(s) of action using human hepatoma HepG2 cells, rat primary hepatocytes isolated from high fat diet (HFD)-fed Sprague-Dawley (SD) rats and HFD-fed C57BL/6J mice.
MATERIALS AND METHODS
MaterialsEugenol, metformin, Oil Red O and Masson’s trichrome stain kit were purchased from Sigma (St. Louis, MO, U.S.A.). Eugenol was dissolved in 0.1% dimethyl sulfoxide (DMSO). Palmitate (Sigma) was bound to bovine serum albumin (BSA) at a 2 : 1 M ratio.11) Antibodies against AMP-activated protein kinase (AMPK), phospho-AMPK, acetyl-CoA carboxylase (ACC), phospho-ACC, mammalian target of rapamycin (mTOR), phospho-mTOR, p70S6K and phospho-p70S6K were from Cell Signaling Technology (Beverly, MA, U.S.A.) and anti-actin was from Santa Cruz Biotechnology (Santa Cruz, CA, U.S.A.). Ca2+-calmodulin dependent protein kinase kinase (CAMKK) and phospho-Ser/Thr antibodies were from BD Biosciences (San Jose, CA, U.S.A.). Reverse transcriptase, cell proliferation assay kits and Dual luciferase assay system were supplied by Promega (Madison, WI, U.S.A.), and compound C, STO-609 and rapamycin were from Calbiochem (Darmstadt, Germany). Protein extraction, EASY-BLUE total RNA extraction, ECL-reagent, Taq polymerase, SYBR-green and lipofectamin were from Intron Biotechnology Inc. (Beverly, MA, U.S.A.), and protein assay kit was from Bio-Rad (Hercules, CA, U.S.A.). Regular diet (RD) and HFD (Table 1) were purchased from Research Diets, Inc. (New Brunswick, NJ, U.S.A.). The other reagents and chemicals were of analytical grade commercially available.
Table 1. Composition of the Experimental Diets
| RD 10% kcal | HFD 45% kcal |
|---|
| g% | kcal% | g% | kcal% |
|---|
| Protein | 19.2 | 20 | 24 | 20 |
| Carbohydrate | 67.3 | 70 | 41 | 35 |
| Fat | 4.3 | 10 | 24 | 45 |
| Total | | 100 | | 100 |
| (kcal/gm) | 3.85 | | 4.73 | |
| Ingredient | g | kcal | g | kcal |
| Casein, 80 mesh | 200 | 800 | 200 | 800 |
| L-Cystine | 3 | 12 | 3 | 12 |
| Corn starch | 315 | 1260 | 72.8 | 291 |
| Maltodextrin 10 | 35 | 140 | 100 | 400 |
| Sucrose | 350 | 1400 | 172.8 | 691 |
| Cellulose, BW 200 | 50 | 0 | 50 | 0 |
| Soybean oil | 25 | 225 | 25 | 225 |
| Lard | 20 | 180 | 177.5 | 1598 |
| Mineral mix S10026 | 10 | 0 | 10 | 0 |
| Dicalcium phosphate | 13 | 0 | 13 | 0 |
| Calcium carbonate | 5.5 | 0 | 5.5 | 0 |
| Potassium citrate | 16.5 | 0 | 16.5 | 0 |
| Vitamin mix v10001 | 10 | 40 | 10 | 40 |
| Choline bitartrate | 2 | 0 | 2 | 0 |
| FD&C | 0.05 | 0 | 0.05 | 0 |
| Yellow dye #5 (RD) | | | | |
| Red dye #40 (HFD) | | | | |
| Total | 1055.05 | 4057 | 858.15 | 4057 |
The human hepatoma cell line HepG2 was purchased from Korean Cell Line Bank (Seoul, Korea), and rat hepatocytes were isolated by collagenase perfusion of the liver of SD rat. HepG2 cells and primary rat hepatocytes were grown in Dulbecco’s modified Eagle’s medium (DMEM) (Gibco BRL, Grand Island, NY, U.S.A.) supplemented with 10% fetal bovine serum (FBS), 100 unit/mL penicillin and 100 µg/mL streptomycin. Cells were maintained at subconfluent conditions in a humidified incubator at 37°C with ambient oxygen and 5% CO2. The cytotoxicity of eugenol was determined by a Cell Titer 96 AQueous One solution Cell Proliferation Assay kit (Promega). In brief, cells were seeded at 1.5×10⁴ cells/well in a 96-well plate and treated with eugenol as indicated. After 48 h of treatment, 20 µL of 3-(4,5-dimethylthiazol-2-yl)-5-(3-carboxymethoxyphenyl)-2-(4-sulfophenyl)-2H-tetrazolium (MTS) solution was added and incubated at 37°C for 30 min and then the absorbance was recorded at 490 nm using an enzyme-linked immunosorbent assay (ELISA) plate reader (Thermo LabSystem, Helsinki, Finland).
Isolation of Primary Rat HepatocytesFor hepatic lipid accumulation, male SD rats were fed a HFD, starting at 3 weeks of age for the next 4 weeks. Primary hepatocytes were isolated by a two-step collagenase perfusion in situ.12) Briefly, under anesthesia with pentobarbital (intraperitoneal, 30 mg/kg body weight), livers were perfused with a Ca2+-free Hanks’ balanced solution (Invitrogen, MA, U.S.A.) at 10 mL/min for 20 min, followed by a continuous perfusion with serum-free DMEM containing collagenase H (Roche, Indianapolis, IN, U.S.A.), 10 mM N-(2-hydroxyethyl)perazine-N′-2-ethanesulfonic acid (HEPES) and 0.004 N NaOH at 10 mL/min for 20 min. Hepatocytes were harvested and then centrifuged for 5 min at 350 rpm. The supernatant was discarded and the pellet, representing the hepatocytes, was gently resuspended in 50 mL DMEM media containing 10% FBS, 10−7 M dexametasone, 10−8 M insulin, 100 unit/mL penicillin and 100 µg/mL streptomycin. After 4 h incubation in a humidified atmosphere of 95% air 5% CO2, the medium was changed to remove unattached hepatocytes, and after 16–18 h cells were suspended in DMEM media containing 10% FBS, 100 unit/mL penicillin and 100 µg/mL streptomycin.
Immunoprecipitation and Western Blot AnalysisProtein extracts from HepG2 cells were prepared by addition of protein extraction reagent to cells after washing with ice-cold phosphate buffered saline (PBS). To harvest proteins in liver, liver was removed and homogenized for 30 s, and then insoluble protein was removed by centrifugation at 13000 rpm for 20 min. The protein concentration of the cell lysates was measured using a Bio-Rad protein assay kit. For immunoprecipitation, 300 µg of cell lysate was cleared with 20 µL of protein G-sepharose beads (Santa Cruz, CA, U.S.A.) and 1 µg of anti-CAMKK antibody was used. After the addition of 20 µL of G-sepharose beads, incubation was continued for an additional 2 h at 4°C. The beads were then collected by centrifugation and washed three times with PBS, the supernatant was removed, 30 µL of 2× loading buffer was added, and samples were run on a 8% sodium dodecyl sulfate-polyacrylamide gel electrophoresis (SDS-PAGE). For Western blot analysis, the total protein (40 µg/lane) was resolved by 8% SDS-PAGE and transferred to polyvinylidene difluoride membranes (PVDF, Millipore, Massachusetts, MA, U.S.A.). Levels of protein and actin were detected with a 1 : 1000 dilution of each antibody in a non-fat dry milk solution (Tris-buffered saline with 5% non-fat dry milk and 0.1% Tween 20), followed by incubation with a horseradish peroxidase-conjugated secondary antibody (diluted 1 : 2000) for 2 h at room temperature. Protein bands were detected using an ECL Western blot detection kit.
RNA Extraction, Reverse Transcription (RT)- and Real Time-Polymerase Chain Reaction (PCR)For RT- and real time-PCR, total RNA was extracted from the cells using EAZY-BLUE total RNA extraction kit and the first-strand cDNA was synthesized using M-MLV reverse transcriptase and oligo (dT) primer according to the manufacturer’s manual. The gene expressions of sterol regulatory element binding protein 1 (SREBP1), fatty acid synthase (FAS), steroyl-CoA desaturase 1 (SCD1), glycerol-3-phosphate acyltransferase (GPAT), CD36, carnitine palmitoyltransferase-1 (CPT-1), acyl-CoA oxidase (ACO), α-smooth muscle actin (α-SMA), collagen type I (Col-I), plasminogen activator inhibitor-1 (PAI-1) were examined by PCR and real-time PCR using Taq-based assay and SYBR green-based assay, respectively. The sequences of primers used for RT- and real time-PCR analysis were shown in Table 2. The RT-PCR products were electrophoresed in 0.8% agarose gels at 100 V and were stained with 0.5 µg/mL ethidium bromide. Levels of the house-keeping genes including glyceraldehyde-3-phosphate dehydrogenase (GAPDH), CPN and actin were used to correct for differences in RNA isolation, RNA degradation and the efficiency of the reverse transcription reaction. Relative expression were calculated with normalization to GAPDH or actin values by using the 2−ΔΔCt method.
Table 2. RT-PCR and Real-Time PCR Primer Sequence
| Gene (Forward/reverse) | PCR (5′→3′) | Real-time PCR (5′→3′) |
|---|
| hSREBP1 | GTGGCGGCTGCATTGAGAGTGAAG | ATACCACCAGCGTCTACC |
| AGGTACCCGAGGGCATCCGAGAAT | CACCAACAGCCCATTGAG |
| hFAS | CAAGAACTGCACGGAGGTGT | CGGCTCGCCCACCT |
| AGCTGCCAGAGTCGGAGAAC | CGGGCCGCAAAGC |
| hSCD1 | TGCCAGCTCTAGCCTTTAAATTC | TCCTGGTAGCATTATTCAGTAGTT |
| GTACCGCTGGCACATCAACTT | TTGGAGACTTTCTCCGGTCAT |
| hACO | TGCAGCACTCACCACCTTC | AACAGACGGAAGCCCAAGC |
| TAGGCATCCATGACAACTA | TCGGTGAGTGACCATTGCTC |
| hGPAT | CCAGCCTGTGCTACCTTCTC | AACCCCAGTATCCCGTCTTT |
| GAAGCTTCTTGTCCCACTG | CAGTCACATTGGTGGCAAC |
| hCPT-1 | GAAGCTTCTTGTCCCACTG | ACAGTCGGTGAGGCCTCTTATGAA |
| TCTTGCTGCCTGAATGTGAGTTGG | TCTGCTGCCTGAATGTGAGTTGG |
| hCD36 | GGGCTATAGGGATCCATTTTTG | TTGATGTGCAAAATCCACAGG |
| CCTTTCAGATTAACGTCGGATTC | TGTGTTGTCCTCAGCGTCCT |
| hGAPDH | TCCACCACCCTGTTGCTGTA | CGACGACCCATTCAAAAATC |
| ACCACAGTCCATGCCATCAC | AACCCTGATTCCCCATCAC |
| rSREBP1 | ACGACGGAGCCATGGATTG | CAGGTCCTTGAGCTCCACAATC |
| TTTGATTGGAGGCCCAGGGG | GCCCACAATGCCATTGAGA |
| rFAS | GCAGTCGCTCATCAAGCTCT | CAACCTGCATTTCCACAACCCCAA |
| GGCTCATTTTCCAGGCTACC | ACCTCCGAAGCCAAACGAGTTGAT |
| rSCD1 | GTGTTGAACCTTCCCCGACT | CAGAGCCAGGTGCCACTTTT |
| TGGAGGTAGGGAGGATCTGG | TGCTAGAGGGTGTACCAAGCTTT |
| rACO | GGCCAACTATGGTGGACATCA | GCCCTCAGCTATGGTATTAC |
| TACCAATCTGGCTGCACGAA | AGGAACTGCTCTCACAATGC |
| rGPAT | TGATCAGCCAGGAGCAGCTG | TGATCAGCCAGGAGCAGCTG |
| AGACAGTATGTGGCACTCTC | AGACAGTATGTGGCACTCTC |
| rCPT-1 | TATGTGAGGATGCTGCTTCC | TATGTGAGGATGCTGCTTCC |
| CTCGGAGAGCTAAGCTTGTC | CTCGGAGAGCTAAGCTTGTC |
| rCD36 | GAAGCATCGAAGAATCTGAAGAG | GACCATCGGCGGCGATGAGAAA |
| TCCAACACCAAGTAAGACCATC | CCAGGCCCAGGAGCTTTATT |
| rCPN/18S | ATGGTCAACCCACCGTG | TTAGAGTTGTCCACAGTTCGGAGA |
| CTTAGAGGGACAAGTGGCG | GGACATCTAAGGGCATCACA |
| mLXRαα | TCCTACACGAGGATCAAGCG | TCGCAAATGCCGCCA |
| AGTCGCAATGCAAAGACCTG | TCAAGCGGATCTGTTCTTCTGA |
| mSREBP1 | GATCCTGGAACGAGAACAC | GCAGTCTGCTTTGGAACCTC |
| TGCTGCCAAAAGACAAGGG | CCTCCTGTGTACTTGCCCAT |
| mFAS | GATCCTGGAACGAGAACAC | CCCTTGATGAAGAGGGATCA |
| AGACTGTGGAACACGGTGGT | ACTCCACAGGTGGGAACAAG |
| mSCD1 | CGAGGGTTGGTTGTTGATCTG | GCGATACACTCTGGTGCTCA |
| ATAGCACTGTTGGCCCTGGA | CTGGCAGAGTCGAAGGG |
| mGPAT | GGTAGTGGATACTCTGTCGTCCA | CCAGCCTGTGCTACCTTCTC |
| CAGCAACATCATTCGGT | GAAGCTTCTTGTCCCACTGC |
| mCD36 | TCCTCTGACATTTGCAGGTCTATC | TACCTGGGAGTTGGCGAGAA |
| GTGAATCCAGTTATGGGTTCCC | TTGCCACGTCATCTGGGTTT |
| mCPT-1 | ATCATGTATCGCCGCAAACT | GTGACTGGTGGGAGGAATAC |
| GGGATGCGTGTAGTGTTGAAC | GAGCATCTCCATGGCGTAG |
| mACO | ACTATATTTGGCCAATTTTGTG | GTGCAGCTCAGAGTCTGTCCAA |
| TGTGGCAGTGGTTTCCAAGCC | TACTGCTGCGTCTGAAAATCCA |
| mα-SMA | CTGACAGAGGCACCACTGAA | CTGCTCCAGCTATGTGTGA |
| CAGAGGCATAGAGGGACAGC | TTACAGAGCCCAGAGCCATT |
| mCol-I | GTGGACCTCCTGGACCTCAG | CCAAGGGTAACAGCGGTGAA |
| AGGAGCTCCGTTTTCACCAG | CCTCGTTTTCCTTCTTCTCCG |
| mPAI-1 | GACACCCTCAGCATGTTCATC | TCATCAATGACTGGGTGGAA |
| AGGGTTGCACTAAACATGTCAG | GCCAGGGTTGCACTAAACAT |
| mActin | GGACTCCTATGGTGGGTGACGAGG | TGACAGGATGCAGAAGGAGA |
| GGGAGAGCATAGCCCTCGTAGAT | CGCTCAGGAGGAGCAATG |
The animal experiment protocol was reviewed and approved by the Institutional Animal Ethics Committee of Kyung Hee University. Five-week-old C57BL/6J mice (Central Lab., Animal Inc., Seoul, Korea) were housed in a temperature- (22±2°C) and humidity-controlled (50±5%) room with a cycle of 12 h light/12 h darkness and free access to food and water. Mice were randomly divided into the following four groups: a regular diet-fed group (RD), a high fat diet-fed group (HFD), and two treatment groups fed a HFD plus eugenol at 40 mg/kg body weight (EU) or HFD plus metformin at 300 mg/kg (MET). The body weight was measured twice per week. After 12 weeks, the mice were fasted overnight and then sacrificed for tissue and blood serum collection. The livers were excised, rinsed with PBS, and weighed. Blood was collect from the heart aorta. Serum and liver sample were stored at −70°C until analyses. For determination of hepatic triglyceride levels, liver tissues were homogenized in a 2 : 1 solution of chloroform and methanol and incubated at 4°C overnight after the addition of 50 mM sodium chloride. After centrifugation, the lipid fractions were dried with nitrogen and the total lipid content was measured. Next, the dried lipids were dissolved in 1% Triton X-100 in PBS, and the triglyceride levels were measured according to the manufacturer’s instructions for triglyceride reagents (Asan Pharmaceutical Co., Seoul, Korea).
Biochemical Analysis and Pathological EvaluationThe plasma levels of alanine aminotransferase (pALT) and aspartate aminotransferase (pAST) were measured by standard clinical chemistry assays on an Automated Chemistry Analyzer (SMARTSAB, Mannheim, Germany). A cross section of the left lateral lobe of the liver was fixed in 10% neutral buffered formalin for 24 h. The liver tissues were dehydrated, embedded in paraffin, sectioned at 4 µm, and stained with hematoxylin and eosin (H&E). Lipid and collagen fiber deposits in liver were visualized by staining with Oil Red O and MASSON, respectively. The steatosis score was determined through the percentage of hepatocytes with cytoplasmic steatosis.13) Experimental groups were compared using a pint score: 0=<10% of hepatocytes exhibiting steatosis; 1=10–33% exhibiting steatosis, 2=34–66% exhibiting steatosis; 3=66% exhibiting steatosis.
Statistical AnalysisAll data are expressed as the mean±standard error (S.E.). Comparisons between groups were made using ANOVA, and the significance was determined by Tukey’s test. Differences of p<0.05 were considered to be statistically significant.
RESULTS
Eugenol Inhibits Lipid Accumulation via Regulation of Gene Expressions of Lipogenesis- and Lipolysis-Related Proteins in HepG2 Cells and Rat HepatocytesTo examine the cytotoxicity of eugenol, HepG2 cells and primary rat hepatocytes were treated with different concentrations of eugenol for 48 h. As shown in Figs. 1A and E, the viabilities of HepG2 cells and primary rat hepatocytes treated with 50 to 200 µM of eugenol were similar to those of the controls, but eugenol at concentration over 400 µM caused a slight cytotoxicity. Thus less than 400 µM of eugenol was employed in following experiments. First, effect of eugenol on cellular lipid accumulation was examined by utilizing an Oil Red O staining. Palmitic acid (PA) and HFD were used to induce cellular lipid accumulation in HepG2 cells and primary rat hepatocytes, respectively, and cellular lipids were successfully increased more than three times compared to those revealed in control cells. HepG2 cells were pretreated with indicated concentrations of eugenol for 2 h, followed by 48 h incubation with 200 µM of PA. Primary rat hepatocytes isolated from HFD-fed rats were treated with different concentrations of eugenol for 24 h. As shown in Fig. 1B, eugenol significantly prevented the PA-induced lipid deposition in a concentration-dependent manner. HFD-induced cellular lipid accumulation in primary rat hepatocytes was also decreased (Fig. 1F). To elucidate the mechanism of action of eugenol, the mRNA expression levels of SREBP1, a transcription factor that stimulates lipogenesis, and its target proteins (FAS, SCD1 and GPAT) were examined using RT- and real time-PCR. Eugenol significantly decreased PA- and HFD-induced overexpression of lipogenesis-related genes in concentration-dependent manners in HepG2 cells and primary rat hepatocytes, respectively. In contrast, gene expressions of lipolysis-related proteins, such as CD36, CPT-1 and ACO, were significantly up-regulated when HepG2 cells and primary rat hepatocytes were treated with eugenol at concentrations up to 100 µM.

Next, we examined whether eugenol activates AMPK by its phosphorylation in HepG2 cells and primary rat hepatocytes because AMPK plays a key role in the regulation of hepatic lipogenesis.14) As shown in Fig. 2A, eugenol treatment resulted in significantly increase in phosphorylation of AMPK and ACC in concentration-dependent manners, but not the expression levels of them. Eugenol also increased phosphorylation of CAMKK in a concentration-dependent manner, indicating that CAMKK acts as an upstream kinase for AMPK in these hepatocytes. In contrast, PA- and HFD-induced phosphorylation of mTOR and p70S6K were significantly decreased by eugenol treatment in HepG2 cell and primary rat hepatocytes, respectively. In the meantime, eugenol-induced increases in pAMPK and pACC protein level were reversed when the cells were pretreated with STO-609 (a specific CAMKK inhibitor) or compound C (an AMPK inhibitor) (Fig. 2B). In addition, pretreatment with rapamycin, mTOR complex 1 inhibitor, decreased phosphorylation of mTOR and p70S6K, but not the phosphorylation levels of CAKK, AMPK and ACC in PA-treated HepG2 cells and HFD-fed rat hepatocytes. Eugenol-induced decrease in SREBP1 gene expression was also abrogated in the presence of rapamycin in HeG2 cell and in primary rat hepatocytes. These results suggested that eugenol prevented and/or treated intracellular lipid accumulation via CAMKK-AMPK-mTOR-p70S6K-SREBP1 signaling cascade in these hepatocytes.

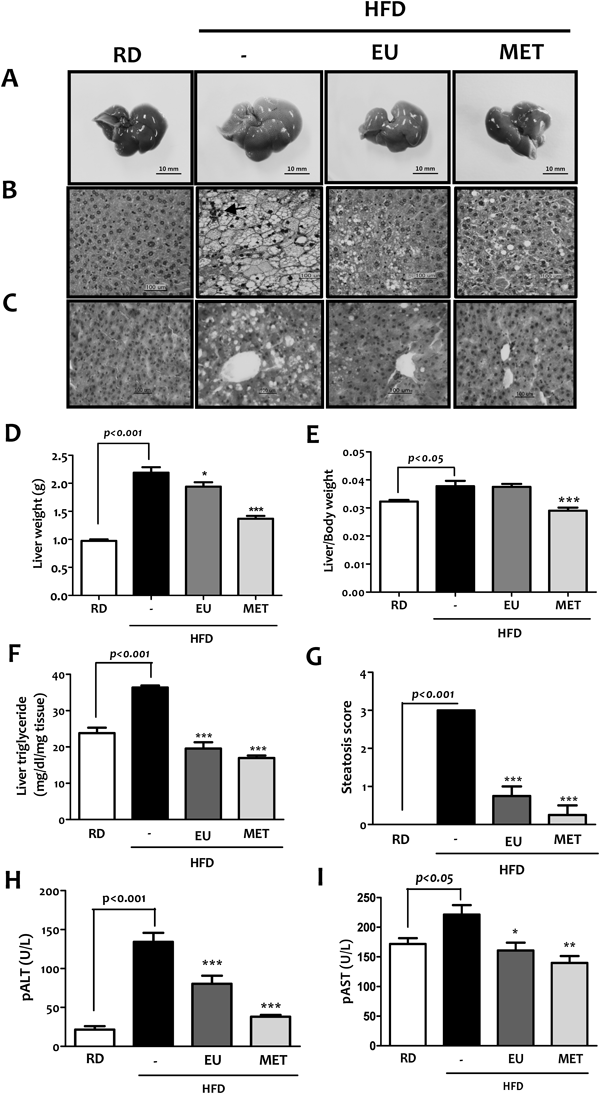
Six-week-old C57BL/6J mice were fed RD or HFD for 12 weeks, and then administrated with 40 mg/kg EU or 300 mg/kg MET for 12 weeks. Histological analyses revealed an enlarged, pale-color (Fig. 3A) and increased lipid deposition (Figs. 3B, C) in the livers of mice fed HFD compared with those fed the RD. As shown in Fig. 3B, HFD-fed mice showed a combination of mild micro- and macro-vesicular steatosis affecting >60% hepatocytes. Occasionally, HFD control mice showed a mild steatohepatitis with steatosis and predominantly micro-vesicular and inflammatory foci, composed of lymphocytes and Kupffer cells in the hepatic lubules. The lipid droplets were markedly reduced both in size and number in the liver of eugenol- or metformin-treated mice, suggesting that eugenol effectively treated hepatic steatosis, evidently confirmed by significant decrease in hepatic triglyceride contents (Fig. 3F). HFD has increased the liver weight markedly when compared to that of RD-fed mice, and eugenol and metformin significantly reduced the liver weights by 12% and 32% in HFD-fed mice, respectively (Fig. 3D). To verify anti-hepatic steatosis effect of eugenol, steatosis score was measured in each group. As shown in Fig. 3G, HFD-induced hepatic steatosis was significantly improved in mice fed eugenol or metformin. Furthermore, plasma ALT and AST activities were also significantly decreased in mice administered with eugneol or metformin, indicating that PA- or HFD-induced liver damage is improved when mice were treated with eugenol or metformin (Figs. 3H, I).
To investigate molecular mechanisms, liver tissues were removed and liver protein and mRNA were extracted to examine protein and gene expression levels of CAMKK, AMPK, ACC, mTOR, p70S6K, SREBP1, FAS, SCD1, GPAT, CD36, CPT-1 and ACO. Comparable to results obtained from in vitro experiments, eugenol decreased the gene expression of lipogenic transcription factors (i.e., LXRα and SREBP1), and their target proteins (i.e., FAS, SCD1 and GPAT). On the contrary, the mRNA expressions of fatty acid oxidation-related genes, such as CPT1 and ACO, were significantly increased when compared to those of HFD-fed mice (Figs. 4A, B). CAMKK, AMPK and ACC were markedly phosphorylated in the liver issues of eugenol or metformin-treated mice (Figs. 4C, D). In contrast, the phosphorylation of mTOR and p70S6K was significantly decreased in the eugenol- or metformin-treated mice when compared to those of HFD-fed mice.
Eugenol Treated HFD-Induced Hepatic Fibrosis in MiceTo determine the pharmacological effect of eugenol on the liver fibrosis, histopathological changes and gene expression level of pro-fibrogenic molecules (i.e., α-SMA, Co-I and PAI-1) were examined. Hepatic collagen accumulation was examined using Masson trichrome staining. As shown in Fig. 5A, HFD conferred a combination of perivenular and pericellular fibrosis in hepatocytes. Parallel to the fibrotic changes in liver tissue, HFD increased the gene expressions of hepatic α-SMA, Col-I, and PAI-1 by 2.8-, 3.8-, and 2.0-fold when compared to those of RD-fed mice. However, these gene expressions were significantly suppressed in the liver tissues of eugenol- or metformin-treated mice (Figs. 5B, C).
DISCUSSION
In mammals, liver has a pivotal role in controlling the metabolic homeostasis for carbohydrates, lipids and proteins. Dysregulation of liver functions could lead to the metabolic disease that is consequently detrimental to the human health. HS occurs when the input (dietary glucose, fructose and fat) exceeds the output (fatty acid oxidation and triglyceride (TG) exportation) capacity.15,16) NAFLD is histologically further categorized into HS and NASH. HS is characterized by the presence of fat accumulation with no evidence of hepatocellular injury, while NASH is by the presence of HS and inflammation with hepatocyte injury (ballooning) with or without fibrosis. The reported prevalence of NAFLD among potential living liver donors ranged from 20% to 51% in two different studies from the United States and Republic of Korea.17,18) Current therapeutic options for NAFLD can be divided into those targeting components of metabolic syndrome with weight reduction and insulin sensitizers, those targeting the liver with antioxidants and liver transplantation for decompensated cirrhosis.19) The most recent guidelines recommended pioglitazone as the only insulin sensitizer for use in the treatment of patients with biopsy-proven NASH.2) However, pioglitazone has considerable side-effects such as weight gain, bone loss, congestive heart failure, and bladder cancer.20) Therefore, there is in great demand for development of effective and safe therapeutics for NAFLD.
Phytochemicals found in fruits, vegetables and medicinal plants are among the recommended lifestyle modifications to decrease the risk of degenerative diseases, such as cardiovascular disease but also to reduce the complications associated with metabolic disorders. Neutraceuticals are in fact affordable and usually does not include the side effects and the metabolic and physiologic burden that medications impose on body systems.21) In this regard, many different phytochemicals are under study for their possible pharmacologic activity in several pathophysiological conditions at different levels. Eugenol is a major volatile constituent of clove essential oil obtained through hydrodistillation of mainly Eugenia caryophyllata buds and leaves. It is a remarkably versatile molecule incorporated as a functional ingredient in numerous products and has found application in the pharmaceutical, agricultural, fragrance, flavor, cosmetic and various other industries. In Chinese traditional medicine clove oil has been used as carminative, antispasmodic, antibacterial and anti-parasitic agent, while the buds were used to treat dyspepsia, acute/chronic gastritis and diarrhea.22) In recent years, eugenol has attracted the attention of many researchers because of its anti-inflammatory and chemo-preventive effects, as well as its superior anti-oxidant activity due the presence of its phenolic group.23) As a result of its broad range of pharmacological and biological activities, studies on eugenol and clove products still remains a research priority. It is therefore of significant interest to demonstrate the anti-fatty liver activity of eugenol.
SREBP1, a membrane-bound transcription factor, plays a crucial role in the regulation of de novo lipogenesis in the liver. SREBP1 binds to the sterol regulatory element in the nucleus, and activates the transcription of target genes associated with fatty acid synthesis. SREBP is negatively regulated by AMPK in the control of lipid homeostasis. AMPK inhibits SREBP activation either by inhibition of mTOR or by direct SREBP phosphorylation, resulting in the inhibition of cleavage and translocation of SREBP into nucleus. In studies performed in hepatocytes and in the livers of ethanol-fed mice, You et al. demonstrated that inhibition of AMPK leads to the activation of SREBP1-mediated lipogenesis.24) Thus, identifying pharmacological agents that stimulate AMPK activity in hepatocytes may provide an effective treatment option for fatty liver disease.
First, we examined whether eugenol inhibits intracellular lipid accumulation in an insulin resistant hepatic cell line of human origin (HepG2) and in primary hepatocytes isolated from SD rats. To induce the pathological condition of fatty liver, HepG2 cells were treated with 200 µM PA, and three-week-old SD rats were fed a HFD for four weeks, after which hepatocytes were isolated. As shown in Figs. 1B and F, lipid contents in PA- or HFD-fed hepatocytes were increased by more than three times when compared to those in control cells. The phosphorylation of CAMKK and AMPK was significantly reduced in hepatocytes isolated from HFD-fed rats and HepG2 cells, respectively, when compared to those in control cells (Fig. 2A). In contrast, the phosphorylation of mTOR and p70S6K and the mRNA expression of SREBP1 and its target molecules were all significantly enhanced upon PA or HFD feeding (Figs. 1, 2). These results indicate that fatty liver conditions induced by PA or HFD are evident and severe enough to utilize these hepatocytes as a fatty liver disease model. In these cells, eugenol markedly suppressed hepatic lipid accumulation via activating CAMKK-AMPK-SREBP1 signaling pathway as well as over-expression of lipolysis-related genes including CD36, CPT-1 and ACO.
Rodents fed a HFD demonstrate visceral adiposity, hyperglycemia, dyslipidemia, hyperinsulinemia and HS, are similar to human NAFLD.25) To simulate the situation in humans, we examined the effects of eugenol on liver fat metabolism in C57BL/6J mice fed a HFD for ten weeks, which is long enough to induce HS and early stage of fibrosis, evidently shown by presence of hepatomegaly (Fig. 3A), large number of lipid droplets (Fig. 3C), and perivenular and pericellular fibrosis (Fig. 5A). Eugenol significantly decreased hepatic TG levels, steatosis score and gene expressions of fibrosis marker proteins such as α-SMA, Col-I and PAI-1 when administered to mice with definite fatty liver disease for 12 weeks. α-SMA and PAI-1 are indicative of stellate cell activation and inhibited extracellular matrix degradation. In vitro studies using HepG2 cells and primary rat hepatocytes showed that activated AMPK down-regulated protein and mRNA expressions of pmTOR, pp70S6K and SREBP1, thereby preventing the transcription of target lipogenic genes. This is likely to hold true in vivo, as hepatic AMPK activation by eugenol also suppressed the transcriptional activities of LXRα and SREBP1 via inhibition of protein expressions of phosphorylated mTOR and p70S6K.
Here, we describe the novel finding that the CAMKK-AMPK-mTOR-p70S6K-SREBP1 signaling pathway is involved in the inhibitory effect of eugenol on fatty liver. Our study demonstrated that eugenol activates AMPK by increasing its phosphorylation by an upstream kinase, CAMKK, and suppresses mTOR- and p70S6K-mediated activation of SREBP1 in a human hepatoma cell line, primary rat hepatocytes and liver tissue of C57BL/6J mice fed on a HFD. Inhibition of SREBP1 and SREBP1-regulated promoters by eugenol was mediated via CAMKK-AMPK-mTOR pathway, as verified by co-treatment with the CAMKK inhibitor (STO-609), the AMPK inhibitor (compound C) or mTOR inhibitor (rapamycin) (Fig. 2B). Parallel to these in vitro findings, treatment with eugenol inhibited HFD-induced changes in nuclear SREBP1 activation and consequent hepatic TG accumulation. At this time, we do not know exactly how eugenol activates AMPK in hepatocytes and liver tissue of HFD-fed C57BL/6J mice, although a calcium-dependent pathway involving phosphorylation of AMPK by CAMKK is evidently provided in this study. Recently, Li et al. reported that transient receptor potential vanilloid 1 (TRPV1) activation by capsaicin reduced lipid accumulation and TG levels in mice, and chronic dietary capsaicin increased the hepatic uncoupling protein 2 expression.26) As an alternative mechanism it would be interesting to test whether eugenol activates TRPV1 cation channel in hepatocytes, because eugenol belongs to a vanilloid compound and natural congener of capsaicin. TRPV1 is affiliated to the family of nonselective cation channels that display high Ca2+ permeability. Acute exposure of eugenol may stimulate an increase in the cytosolic free calcium concentration in HepG2 cells which results in CAMKK-AMPK signaling pathway.
In conclusion, eugenol plays a significant role in reducing hepatic lipid accumulation by modulating the AMPK-SREBP signaling pathway. These results broaden our understanding of eugenol’s anti-fatty liver activity. Eugenol itself or eugenol-containing plants may represent a promising dietary supplement to treat HS and early stage of liver fibrosis.
Acknowledgment
This work was supported by the Kyung Hee University in 2013.
REFERENCES
- 1) Angulo P. Nonalcoholic fatty liver disease. N. Engl. J. Med., 346, 1221–1231 (2002).
- 2) Chalasani N, Younossi Z, Lavine JE, Diehl AM, Brunt EM, Cusi K, Charlton M, Sanyal AJ. The diagnosis and management of non-alcoholic fatty liver disease: practice Guideline by the American Association for the Study of Liver Diseases, American College of Gastroenterology, and the American Gastroenterological Association. Hepatology, 55, 2005–2023 (2012).
- 3) Musso G, Gambino R, Cassader M, Pagano G. Meta-analysis: natural history of non-alcoholic fatty liver disease (NAFLD) and diagnostic accuracy of non-invasive tests for liver disease severity. Ann. Med., 43, 617–649 (2011).
- 4) Kamatou GP, Vermaak I, Viljoen AM. Eugenol—from the remote Maluku Islands to the international market place: a review of a remarkable and versatile molecule. Molecules, 17, 6953–6981 (2012).
- 5) Nam H, Kim MM. Eugenol with antioxidant activity inhibits MMP-9 related to metastasis in human fibrosarcoma cells. Food Chem. Toxicol., 55, 106–112 (2013).
- 6) Tung YT, Chua MT, Wang SY, Chang ST. Anti-inflammation activities of essential oil and its constituents from indigenous cinnamon (Cinnamomum osmophloeum) twigs. Bioresour. Technol., 99, 3908–3913 (2008).
- 7) Dai JP, Zhao XF, Zeng J, Wan QY, Yang JC, Li WZ, Chen XX, Wang GF, Li KS. Drug screening for autophagy inhibitors based on the dissociation of Beclin1-Bcl2 complex using BiFC technique and mechanism of eugenol on anti-influenza A virus activity. PLoS ONE, 8, e61026 (2013).
- 8) Jaganathan SK, Supriyanto E. Antiproliferative and molecular mechanism of eugenol-induced apoptosis in cancer cells. Molecules, 17, 6290–6304 (2012).
- 9) Jaganathan SK, Mazumdar A, Mondhe D, Mandal M. Apoptotic effect of eugenol in human colon cancer cell lines. Cell Biol. Int., 35, 607–615 (2011).
- 10) Aggarwal BB, Kunnumakkara AB, Harikumar KB, Tharakan ST, Sung B, Anand P. Potential of spice-derived phytochemicals for cancer prevention. Planta Med., 74, 1560–1569 (2008).
- 11) Wei Y, Wang D, Topczewski F, Pagliassotti MJ. Saturated fatty acids induce endoplasmic reticulum stress and apoptosis independently of ceramide in liver cell. Am. J. Physiol. Endocrinol. Metab., 291, E275–E281 (2006).
- 12) Seglen PO. Preparation of rat liver cells. 3. Enzymatic requirements for tissue dispersion. Exp. Cell Res., 82, 391–398 (1973).
- 13) Kleiner DE, Brunt EM, Van Natta M, Behling C, Contos MJ, Cummings OW, Ferrell LD, Liu YC, Torbenson MS, Unalp-Arida A, Yeh M, McCullough AJ, Sanyal AJ, Nonalcoholic Steatohepatitis Clinical Research Network. Design and validation of a histological scoring system for nonalcoholic fatty liver disease. Hepatology, 41, 1313–1321 (2005).
- 14) Park KG, Min AK, Koh EH, Kim HS, Kim MO, Park HS, Kim YD, Yoon TS, Jang BK, Hwang JS, Kim JB, Choi HS, Park JY, Lee IK, Lee KU. Alpha-lipoic acid decrease hepatic lipogenesis through adenosine monophosphate-activated protein kinase (AMPK)-dependent and AMPK-independent pathway. Hepatology, 48, 1477–1486 (2008).
- 15) Browning JD, Horton JD. Molecular mediators of hepatic steatosis and liver injury. J. Clin. Invest., 114, 147–152 (2004).
- 16) Malaguarmera M, Di Rosa M, Nicoletti F, Malaguarmera L. Molecular mechanisms involved in NAFLD progression. J. Mol. Med., 87, 679–695 (2009).
- 17) Marcos A, Fisher RA, Ham JM, Olzinski AT, Shiffman ML, Sanyal AJ, Luketic VA, Sterling RK, Olbrisch ME, Posner MP. Selection and outcome of living donors for adult to adult right lobe transplantation. Transplantation, 69, 2410–2415 (2000).
- 18) Lee JY, Kim KM, Lee SG, Yu E, Lim YS, Lee HC, Chung YH, Lee YS, Suh DJ. Prevalence and risk factors of non-alcoholic fatty liver disease in potential living liver donors in Korea: a review of 589 consecutive liver biopsies in a single center. J. Hepatol., 47, 239–244 (2007).
- 19) Younossi Z, Stepanova M, Afendy M, Fang Y, Younossi Y, Mir H, Srishord M. “The changing face of chronic liver disease (CLD) in the United States: the rising epidemic of non-alcoholic fatty liver disease (NAFLD). Presented at The International Liver Congress.”: ‹http://www1.easl.eu/easl2011/program/Orals/204.htm›.
- 20) Morita Y, Ueno T, Sasaki N, Tateishi Y, Nagata E, Kage M, Sata M. Nateglinide is useful for nonalcoholic steatohepatitis (NASH) patients with type 2 diabetes. Hepatogastroenterology, 52, 1338–1343 (2005).
- 21) Cecchini M, Sassi F, Lauer JA, Lee YY, Guajardo-Barron V, Chisholm D. Tackling of unhealthy diets, physical inactivity, and obesity: health effects and cost-effectiveness. Lancet, 376, 1775–1784 (2010).
- 22) Barceloux DG. Medical Toxicology of Natural Substances. Foods, Fungi, Medicinal Herbs, Plants and Venomous Animals. Wiley, Hoboken, NJ, U.S.A. (2008).
- 23) Yogalakshmi B, Viswanathan P, Anuradha CV. Investigation of anti-oxidant, anti-inflammatory and DNA-protective properties of eugenol in thioacetamide-induced liver injury in rats. Toxicology, 268, 204–212 (2010).
- 24) You M, Matsumoto M, Pacold CM, Cho WK, Crabb DW. The role of AMP-activated protein kinase in the action of ethanol in the liver. Gastroenterology, 127, 1798–1808 (2004).
- 25) Xu ZJ, Fan JG, Ding XD, Qiao L, Wang GL. Characterization of high-fat, dietinduced, non-alcoholic steatohepatitis with fibrosis in rats. Dig. Dis. Sci., 55, 931–940 (2010).
- 26) Li L, Chen J, Ni Y, Feng X, Zhao Z, Wang P, Sun J, Yu H, Yan Z, Liu D, Nilius B, Zhu Z. TRPV1 activation prevents nonalcoholic fatty liver through UCP2 upregulation in mice. Pflugers Arch., 463, 727–732 (2012).

