Abstract
Methods to improve the bioactive component content of cultivated licorice have become the bottleneck of industrial licorice extraction for pharmaceutical use. To evaluate the effects of genotype, environment and their interaction on major bioactive components, we analyzed the five bioactive components: liquiritin (LQ), liquiritigenin (LQG), glycyrrhizin (GL), isoliquiritin (ILQ) and isoliquiritigenin (ILQG) of four diverse licorice varieties grown in four distinct environments in northern China during 2010–11. Analysis of variance showed that environmental and genotypic effects were significant (p<0.01) for all five bioactive components. Additionally, their interaction was significant (p<0.05) for GL in the 2-year study period. LQ and ILQ were mainly affected by genetic factors and have great potential for genetic improvement, whereas LQG and ILQG were mainly affected by environmental factors. GL was similarly affected by environmental and genetic factors. Biplot of the principal component analysis showed that for quality breeding, G2 (WNT-1) and G3 (JX-1) are two relatively preferable genotypes, and E2 (Chifeng) location is suitable for accumulation of the bioactive components of these two genotypes. Stepwise regression analysis showed that sunshine and rainfall are the dominant environmental factors for licorice bioactive component accumulation; increased duration of sunshine is advantageous to GL accumulation whereas declining rainfall is conducive to LQG and ILQG accumulation. These results provide a theoretical basis for initiating licorice breeding programs with increased bioactive components and improved quality.
Licorice (Glycyrrhiza uralensis FISCH.) belongs to the family Leguminosae, and has been used as a popular herbal medicine for thousands of years in China.1,2) Biological activities of licorice have been attributed to triterpene saponins, various types of flavonoids, such as glycyrrhizin (GL), liquiritin (LQ), liquiritigenin (LQG), isoliquiritin (ILQ) and isoliquiritigenin (ILQG), and other bioactive components, which exhibit anti-inflammatory, anti-viral, anti-allergenic, anti-ulcer and anti-oxidative properties, and are also believed to have chemo-preventive activity against cancer and AIDS.3–5)
Licorice is one of the most important industrial materials for pharmaceuticals,6) and the total amount of import and export in China reached 13960 t in 2011.7) More than 90% of total licorice production in 2005 was Glycyrrhiza uralensis.5) Due to the low content of bioactive components in cultivated populations, licorice is mainly extracted from wild variety despite its limited yield, which has restricted the extent of industrial extraction. With increasing demands for licorice worldwide, wild licorice is unable to meet the global needs.8) Hence, methods to improve the quality of cultivated licorice have become the bottleneck of industrial licorice extraction. Furthermore, high quality i.e., high content of bioactive components is a desirable attribute for medicinal use.9) Therefore, to improve the quality of licorice, breeding programs are focused on how to increase the content of bioactive components.
Plant quantitative traits, such as bioactive components, are largely dependent on two aspects: genetic background and environmental conditions.10,11) High variability is known to exist in most bioactive components among the different licorice genotypes,3,12,13) and even among different plants growing in the same location.9,14) Meanwhile, environmental factors such as moisture,15,16) sunlight,1,16) mineral nutrition,17) etc. significantly influence the distribution and quality of licorice. However, little information is available on how genotype and environment (at the specific location) affect the bioactive components of licorice. In addition, geographic-climate factors appear to affect the glycyrrhizin content,18) but their effects on other bioactive components has not yet been investigated.
Therefore, the objectives of this study were to (1) Evaluate the main producing areas for genotypic and environmental factors, and their interaction effects on five major bioactive components of licorice populations in northern China; (2) Examine the contribution of geographic-climate factors towards the contents of five major bioactive components of different genotypes. For this study, four different genotypic populations of licorice were transplanted in four different locations using complete randomized block design with three replications during 2010–2011. Contents of five major bioactive components, including GL, LQ, LQG, ILQ and ILQG were determined by HPLC (Fig. 1). The present work determined the relative contribution of genotypic (population) and environmental (location) effects on five major bioactive components in licorice populations collected from four distinct growth environments.
MATERIALS AND METHODS
Plant MaterialsA total of four one-year-old seedlings of licorice populations were collected from the main producing areas in northern China, which includes three provinces (Table 1). All samples were identified as seedlings of Glycyrrhizia uralensis FISCH. by Prof. Wenquan Wang (Institute of Medicinal Plant Development, Chinese Academy of Medical Science & Peking Union Medical College). Voucher specimens of these seedlings were deposited at the herbarium of Beijing University of Chinese Medicine.
Table 1. Description of the Accessions Assayed
| Population | Collection location | Longitude/E | Latitude/N | Root color |
|---|
| KYQ-1 | Baicheng, Jilin | 122.70 | 45.73 | Reddish brown |
| WNT-1 | Chifeng, Inner Mongolia | 118.91 | 42.61 | Brownish red |
| JX-1 | Hangjinqi, Inner Mongolia | 108.72 | 40.56 | Reddish brown |
| JT-1 | Jiuquan, Gansu | 98.86 | 40.14 | Claybank |
In order to study the effects of genotype, environment and their interactions on five bioactive components of licorice, a two-year field examination was conducted using complete randomized block design with three replications during 2010–2011.
Seedlings were transplanted in spring 2010 in the experimental fields in Baicheng (BC), Chifeng (CF), Hangjinqi (HJQ) and Jiuquan (JQ). Each experimental plot area measured 12 m2. Seedlings of each population were grown in eight rows with a 25 cm distance between lines and 15 cm within lines. All the fields were hand-weeded but no pesticides, fungicides, or fertilizers were used. The meteorological conditions of different experimental fields are listed in Table 2.
Table 2. Description of Meteorological Factors during Main Growth Period in Four Different Locations from May (Planting) to October (Harvest), in 2010 and 2011
| Environment | X1 (h) | X2 (℃) | X3 (℃) | X4 (℃) | X5 (℃) | X6 (mm) | X7 (%) |
|---|
| 2010 | BC | 1327.6 | 18.3 | 23.9 | 12.1 | 24.5 | 338.8 | 59.1 |
| CF | 1688.4 | 17.8 | 24.2 | 11.3 | 24.3 | 294.7 | 55.7 |
| HJQ | 1543.7 | 19.1 | 27.6 | 13.0 | 28.8 | 284.3 | 50.3 |
| JQ | 1941.3 | 19.4 | 26.8 | 12.4 | 27.0 | 94.2 | 48.4 |
| 2011 | BC | 1259.9 | 18.1 | 23.8 | 12.2 | 24.2 | 370.6 | 59.8 |
| CF | 1737.7 | 17.3 | 22.2 | 11.0 | 23.9 | 284.5 | 54.7 |
| HJQ | 1539.1 | 18.5 | 24.0 | 12.0 | 25.2 | 160.4 | 45.9 |
| JQ | 2069.0 | 19.2 | 25.3 | 11.8 | 27.1 | 74.0 | 41.9 |
The data were downloaded from “China Meteorological Data Sharing Service System”; X1, sunshine duration; X2, annual mean temperature; X3, mean temperature in July; X4, min. temperature; X5, max. temperature; X6, annual rainfall; X7, relative humidity.
Twenty licorice roots in the middle of each replicate for each genotype at each location and year were harvested from October to November. The roots were cut into slices after removing dirt, dried in a forced air oven at 50°C for over three days, and then crushed to obtain a powder mixture with the grain size of 40–60 meshes.
The content of five bioactive components (Fig. 1), including GL, LQ, LQG, ILQ and ILQG in the root powder mixtures were analyzed by HPLC according to a previously published method,19) with minor modifications.
Dried samples (200 mg) were extracted in 70% EtOH (50 mL) with ultrasonic cleaner (40 kHz, 250 W) at 30°C for 60 min. The extracting solution was passed through a millipore filter (0.45 µm). About 5 mL solution was used for HPLC analysis. The HPLC system consisted of an 2498 ultraviolet detector, 1525 solvent delivery pump (Waters Inc., U.S.A.), Diamonsi (R) diamond C18 reversed-phase chromatography column (250 mm×6 mm, 5 µm, Dimma Inc., China). The mobile phase consisted of HPLC grade CH3CN (A) and water containing 0.05% H3PO4 (B). A gradient profile was used as follows: 0 min, 20%A; 8 min, 20%A; 30 min, 38% A; 42 min, 50% A; and 45 min, 95% A. The flow rate was 1.0 mL/min. GL, LQ and LQG were detected under 237 nm, and ILQ and ILQG were detected under 365 nm (Fig. 1).
Statistical AnalysesDescriptive statistics (i.e., mean, maximum, minimum and coefficient of variation) were used in order to compare genetic variations between populations, and the means of results were compared by Duncan’s multiple range tests. Histograms were used to compare the differences between genotypes and locations.
Normal distribution and homogeneity of variances in the dataset were performed using SPSS 16.0 for Windows (SPSS Inc., U.S.A.). The mixed linear model was used for the ANOVA, and for estimating the variance components of genotype and environment, and their interactions for each of the five bioactive components and four different growth locations over two years. Correlation was analyzed using a two-tailed Pearson’s correlation test. The p<0.05 and p<0.01 denoted statistical significance.
Multivariate relationships between genotypes, environments, and five bioactive components were explored by the Principal Component Analysis (PCA). PCA was performed on the correlation matrix of the variables, which equals the covariance matrix after subtracting the mean of the data. Only the first two PCs were retained for the rotation according to the eigenvalue-one criterion. Each genotype and location was defined by the scores of genotypes and locations in the two PCs, respectively. In the bivariate plots the centre is the overall mean of the data and is designated as 0, since the data were normalized to the mean. Genotypes and environments close to the centre show relatively minor interactions. If a genotype has the same direction as a certain environment in the bivariate plot, it is considered to be specially suited for that environment.20)
To explore the effect of geographic-climate factors on bioactive components traits, five bioactive components and nine geographic-climate factors in two years were analyzed by stepwise regression analysis (SRA) with SPSS 16.0. Geographic-climate factors were independent variables (i.e., X1, sunshine duration; X2, mean annual temperature; X3, mean temperature in July; X4, min. temperature; X5, max. temperature; X6, annual rainfall; X7, relative humidity; X8, longitude; X9, latitude), and five bioactive components were dependent variables (i.e., Y1, LQ; Y2, LQG; Y3, GL; Y4, ILQ; Y5, ILQG).
RESULTS AND DISCUSSION
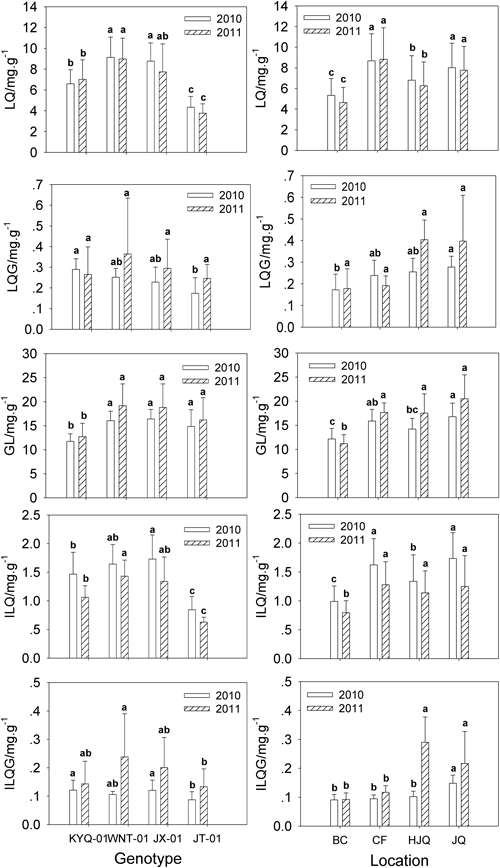
Variations in Bioactive ComponentsMeans and coefficients of variation (CVs) are helpful indicators to select phenotypic variants of interest for breeding purposes.10) Means of LQG, GL and ILQG were slightly higher in 2011 as compared to 2010; while for LQ and ILQ, they had decreased. Furthermore, the CVs ranged from 19.19–51.31% over the two-year period (Table 3). Duncan’s multiple range tests showed that the four genotypes and four locations were significantly different (p<0.05) in most bioactive components traits, with the exception of LQG in 2011 over the two-year period (Fig. 2).
Table 3. Summary of Descriptive Statistics for Bioactive Components (mg/g) in the Two-Year Period
| Traits | Two-year-old (2010) | Three-year-old (2011) |
|---|
| Min | Max | Mean±S.D. | CV (%) | Min | Max | Mean±S.D. | CV (%) |
|---|
| LQ | 3.28 | 11.43 | 7.21±2.43 | 33.71 | 2.66 | 10.95 | 6.02±2.60 | 43.14 |
| LQG | 0.09 | 0.34 | 0.24±0.07 | 29.67 | 0.12 | 0.49 | 0.30±0.13 | 43.42 |
| GL | 9.50 | 18.92 | 14.77±2.83 | 19.19 | 9.40 | 27.98 | 18.14±5.96 | 32.84 |
| ILQ | 0.61 | 2.11 | 1.42±0.47 | 33.43 | 0.51 | 1.60 | 1.02±0.33 | 32.90 |
| ILQG | 0.07 | 0.17 | 0.11±0.03 | 25.71 | 0.07 | 0.41 | 0.18±0.09 | 51.31 |
CV=coefficient of variation.
Genetic or environmental factors causing variations in glycyrrhizin content were reported in the past three years. Kojoma et al.9) reported a 10.2-fold variation in glycyrrhizin content among five-year-old licorice plants grown under the same conditions. Wei et al.21) also reported content variation in glycyrrhizin among 165 wild and 1013 cultivated licorice plants growing in different locations, wherein average content was 4.43±1.32% and 1.51±0.49% in wild and cultivated plants, respectively.
Our results indicated that there is selection potential for several high bioactive components breeding materials in cultivated licorice populations since abundant variations also existed in the present study.
ANOVA of Genotypic and Environmental EffectsSeveral studies have examined the effects of genetic and environmental factors on bioactive components of licorice,18,22,23) but there is no definite information explaining the estimated contribution of these factors on the five bioactive components of licorice.
In our study, the availability of data for the same genotype grown in four different environments allowed the variation in contents of the five bioactive components to be partitioned between genotype, environment, genotype×environment (G×E), and error (Table 4). The analysis of the variance showed that the effects of environment and genotype were significant (p<0.01) for all five bioactive components. Additionally, their interaction was significant (p<0.05) for GL in the two-year period (Table 4). However, the distribution of variance among components was not similar. The genotypic effect accounted for nearly half of the total variance for LQ (56.1% in 2010 and 47.0% in 2011) and ILQ (46.0% in 2010 and 50.3% in 2011). The environmental effect was higher for LQG (21.0% in 2010 and 36.5% in 2011) and ILQG (56.2% in 2010 and 44.2% in 2011). However, genotypic and environmental effects for GL were similar (Table 4).
Table 4. Summary of Combined ANOVA on Five Bioactive Components among Four Selected Licorice Genotypes at Four Locations, over Two Years and with Three Replications (% of Total Variance)
| SOV | Two-year-old (2010) | Three-year-old (2011) |
|---|
| LQ | LQG | GL | ILQ | ILQG | LQ | LQG | GL | ILQ | ILQG |
|---|
| E | 24.7** | 21.0** | 33.5** | 31.9** | 56.2** | 31.7** | 36.5** | 43.2** | 19.0** | 44.2** |
| G | 56.1** | 23.9** | 36.2** | 46.0** | 20.2** | 47.0** | 6.3** | 34.9** | 50.3** | 12.9** |
| G×E | 3.1 | 19.0 | 11.7* | 3.6 | 12.2** | 5.4 | 30.8** | 8.5* | 10.9* | 14.9 |
| Error | 7.58 | 32.07 | 11.21 | 8.25 | 8.33 | 8.29 | 11.40 | 9.93 | 11.16 | 18.39 |
E=environment; G=genotype; G×E=interaction between genotype and environment. * p<0.05, ** p<0.01.
It is difficult to select for bioactive components with low genotypic effects in plant breeding programs.24) Hence, in the present study it is unlikely that the contents of the five bioactive components in licorice, with the possible exceptions of LQ and ILQ, could be substantially increase by breeding.
Interrelationships between Different Bioactive ComponentsPearson’s correlation coefficients between the five bioactive component traits over the two-year period showed a positive correlation among all the traits. GL had significant and positive correlation with the other traits (with LQ, r=0.209*, ILQ, r=0.211*; LQG, r=0.548** and ILQG, r=0.554**, respectively). Likewise, LQ and ILQ, and LQG and ILQG showed significant positive correlation with each other (r=0.927**, 0.759**, respectively) (Table 5).
Table 5. Pearson’s Correlation Coefficients of the Five Bioactive Components Traits of Licorice over the Two-Year Period
| Traits | LQ | LQG | GL | ILQ | ILQG |
|---|
| LQ | 1.000 | | | | |
| LQG | 0.072 | 1.000 | | | |
| GL | 0.209* | 0.548** | 1.000 | | |
| ILQ | 0.927** | 0.144 | 0.211* | 1.000 | |
| ILQG | 0.124 | 0.759** | 0.554** | 0.147 | 1.000 |
This result is in agreement with the study by Kojoma et al.9) and Guo et al.,19) which reported that the glycyrrhizin content was positively correlated with liquiritin content in the taproots. Our results also indicate that selecting high-glycyrrhizin genotypes will be useful for increasing LQ, ILQ, LQG and ILQG contents.
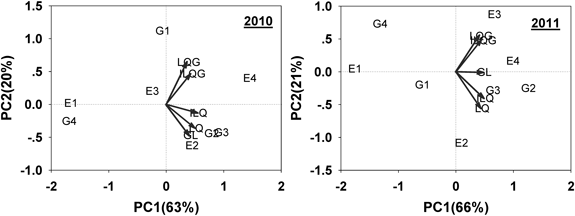
PCA Analyses of Genotype and Environment with Bioactive ComponentsIn order to characterize genotypes and environments with the five bioactive components, a PCA was conducted (Fig. 3). The factor loading of the PCs shows the correlation with the variables (Fig. 4). PC1 had a close correlation with all five bioactive components, whereas PC2 showed a close negative correlation with LQ, GL and ILQ and a positive correlation with LQG and ILQG in the two years.
Results of the PCA are summarized in Fig. 3. G2 (WNT-1) and G3 (JX-1) were characterized through LQ, GL and ILQ content, while E4 (JQ) through LQG and ILQG content in the two-year period. Additionally, E2 (CF) and E3 (HJQ) were also characterized through LQ, GL, ILQ and LQG, ILQG in 2010 and 2011, respectively. Furthermore, G2 (WNT-1) and G3 (JX-1) were identified to be specially adapted to E2 (CF) as their scores in the bivariate plot were in the same direction as the environment.
Interrelationships between Bioactive Components and Geographic-Climate FactorsStepwise regression analysis (SRA) of five bioactive components traits and nine geographic-climate factors with statistically significant correlations are shown in Table 6. Majority of the bioactive components, except LQ in 2010 and ILQ in 2011, showed strong correlations with partial geographic-climate factors or their combination. To specifically show the relationship between two independent variables, correlation coefficient (R) in Table 6 decomposed into partial correlation coefficient as shown in Table 7. Over the two-year period, sunshine duration (X1) had the greatest effect on bioactive components traits (the second column in Table 7), followed by annual rainfall (X6), min. temperature (X4) and relative humidity (X7). Among the different bioactive components studied, GL and ILQ were mainly influenced by sunshine duration, whereas LQG and ILQG were mainly influenced by annual rainfall.
Table 6. Stepwise Regression Analysis of Geographic-Climate Factors and Bioactive Components Traits of Licorice Population in 2010 and 2011
| Two-year-old (2010) | Three-year-old (2011) |
|---|
| Regression equation | Correlation coefficient R | Regression equation | Correlation coefficient R |
|---|
| Y2=0.9722−0.0174X9 | 0.5630* | Y1=53.9431−3.2785X4−0.0761X8 | 0.6138* |
| Y3=2.3101+0.0077X1 | 0.6235** | Y2=0.9662−0.0002X1−0.0013X6 | 0.7038** |
| Y4=−0.5918+0.0012X1 | 0.6007** | Y3=42.5944+0.0058X1−0.8408X9 | 0.7444** |
| Y5=0.1704−0.0002X6 | 0.7888** | Y5=3.648+0.0051X6−0.0908X7 | 0.7831** |
X1, sunshine duration; X2, mean annual temperature; X3, mean temperature in July; X4, min. temperature; X5, max. temperature; X6, annual rainfall; X7, relative humidity; X8, longitude; X9, latitude; Y1, liquiritin, LQ; Y2, liquiritigenin, LQG; Y3, glycyrrhizin, GL; Y4, isoliquiritin, ILQ; Y5, isoliquiritigenin, ILQG. Only those correlation coefficients that were significant are shown. * p<0.05, ** p<0.01.
Table 7. Partial Correlation Coefficients of Climate Factors and Bioactive Components Traits of Licorice Population in 2010 and 2011
| Sunshine | Temperature condition | Water condition | Geographical factors |
|---|
| X1 | X2 | X3 | X4 | X5 | X6 | X7 | X8 | X9 |
|---|
| Y1 | — | — | — | −0.5895b* | — | — | — | −0.3266b | — |
| Y2 | −0.3409b | — | — | — | — | −0.6434b** | — | — | −0.5630a* |
| Y3 | 0.6235a**0.3381b | — | — | — | — | — | — | — | −0.3611b |
| Y4 | 0.6007a** | — | — | — | — | — | — | — | — |
| Y5 | — | — | — | — | — | −0.7888a**0.5521b* | −0.5938b* | — | — |
X1, sunshine duration; X2, mean annual temperature; X3, mean temperature in July; X4, min. temperature; X5, max. temperature; X6, annual rainfall; X7, relative humidity; X8, longitude; X9, latitude; Y1, liquiritin, LQ; Y2, liquiritigenin, LQG; Y3, glycyrrhizin, GL; Y4, isoliquiritin, ILQ; Y5, isoliquiritigenin, ILQG. Partial correlation coefficient from correlation coefficient decomposition in Table 6. Superscripts a and b represent partial correlation coefficients in 2010 and 2011, respectively. * p<0.05, ** p<0.01.
In northern China, latitude and longitude as comprehensive geographical factors, have a relatively large impact on plant quantitative traits, since variations in longitude and latitude mainly reflect changes in precipitation, and sunshine and temperatures, respectively.18) With the increase in longitude (X8), precipitation increased, and LQ accumulation declined in 2011. However, with the increase in latitude (X9), duration of sunshine and temperature were reduced, and GL and LQG accumulation showed a downward trend in 2010 and 2011, respectively. Unfortunately, the correlation is not significant between geographical factors and bioactive components traits, except with LQG in 2011, because of the interactional complexity among precipitation, sunshine and temperatures etc. reflected by longitude and latitude. However, there is no doubt that increased duration of sunshine is advantageous to GL accumulation, while declining rainfall is conducive to LQG and ILQG accumulation in the present study.
Acknowledgment
The work was financially supported by National Science and Technology Major Projects for “Major New Drugs Innovation and Development” (2009ZX09308-002) and Special Fund for TCM supported by State Administration of Traditional Chinese Medicine of China (201107009-03). We also would like to thank M.A Meng-yan Cai (The College of Applied Science and Technology, Hainan University, China) for English proof of the manuscript.
Conflict of Interest
The authors declare no conflict of interest.
REFERENCES
- 1) Hou JL, Li WD, Zheng QY, Wang WQ, Xiao B, Xing D. Effect of low light intensity on growth and accumulation of secondary metabolites in roots of Glycyrrhiza uralensis ISCH Biochem. Syst. Ecol., 38, 160–168 (2010).
- 2) Shen S, Chang Z, Liu J, Sun X, Hu X, Liu H. Separation of glycyrrhizic acid and liquiritin from Glycyrrhiza uralensis FISCH. extract by three liquid-phase extraction systems. Separ. Purif. Tech., 53, 216–223 (2007).
- 3) Tao W, Duan J, Zhao R, Li X, Yan H, Li J, Guo S, Yang N, Tang Y. Comparison of three officinal Chinese pharmacopoeia species of Glycyrrhiza based on separation and quantification of triterpene saponins and chemometrics analysis. Food Chem., 141, 1681–1689 (2013).
- 4) Wang J, Zhang J, Gao WY, Wang Q, Yin SS, Liu H, Man SL. Identification of triterpenoids and flavonoids, step-wise aeration treatment as well as antioxidant capacity of Glycyrrhiza uralensis FISCH. Cell. Ind. Crops Prod., 49, 675–681 (2013).
- 5) Zhang Q, Ye M. Chemical analysis of the Chinese herbal medicine Gan-Cao (licorice). J. Chromatogr. A, 1216, 1954–1969 (2009).
- 6) Chinese Pharmacopeia Commission. Pharmacopeia of People’s Republic of China, Vol. 1, Chemical Industry Press, Beijing, p. 81 (2010)
- 7) Huo W, Ren F. Analysis of import trade for Chinese licorice in 2011. Modern Chinese Medicine, 14, 50–52 (2012).
- 8) Liu JN, Wu LJ, Wei SL, Xiao X, Su CX, Jiang P, Song ZB, Wang T, Yu ZL. Effects of arbuscular mycorrhizal fungi on the growth, nutrient uptake and glycyrrhizin production of licorice (Glycyrrhiza uralensis FISCH.). Plant Growth Regul., 52, 29–39 (2007).
- 9) Kojoma M, Hayashi S, Shibata T, Yamamoto Y, Sekizaki H. Variation of glycyrrhizin and liquiritin contents within a population of 5-year-old licorice (Glycyrrhiza uralensis) plants cultivated under the same conditions. Biol. Pharm. Bull., 34, 1334–1337 (2011).
- 10) Baghalian K, Sheshtamand MS, Jamshidi AH. Genetic variation and heritability of agro-morphological and phytochemical traits in Iranian saffron (Crocus sativus L.) populations. Ind. Crops Prod., 31, 401–406 (2010).
- 11) Benzioni A, Mills D, Boven MV, Cokelaere M. Effect of genotype and environment on the concentration of simmondsin and its derivatives in jojoba seeds and foliage. Ind. Crops Prod., 21, 241–249 (2005).
- 12) Hayashi H, Inoue K, Ozaki K, Watanabe H. Comparative analysis of ten strains of Glycyrrhiza uralensis cultivated in Japan. Biol. Pharm. Bull., 28, 1113–1116 (2005).
- 13) Hayashi H, Fujii I, Iinuma M, Shibano M, Ozaki K, Watanabe H. Characterization of a glycyrrhizin-deficient strain of Glycyrrhiza uralensis. Biol. Pharm. Bull., 36, 1448–1453 (2013).
- 14) Niu XY, Liu CS, Cui HR. Research on the variation of glycyrrhizin content in different Glycyrrhiza uralensis FISCH. samples from a single farm. Li shizhen Medicine and Mater. Medica Res., 20, 2121–2122 (2009).
- 15) Li WD, Hou JL, Wang WQ, Tang XM, Liu CL, Xing D. Effect of water deficit on biomass production and accumulation of secondary metabolites in roots of Glycyrrhiza uralensis. Russ. J. Plant Physiol., 58, 538–542 (2011).
- 16) Lin SQ, Lin L. Ecological factors and licorice quality. Chin. J. Ecol., 11, 17–20 (1992).
- 17) Wang D, Pang YX, Wang WQ, Wan CY, Hou JL, Yu FL, Wang QL, Liu FB, Zhang X-D. Effect of molybdenum on secondary metabolic process of glycyrrhizic acid in Glycyrrhiza uralensis FISCH. Biochem. Syst. Ecol., 50, 93–100 (2013).
- 18) Wei SL. Studies on geographical variation and provenance selection of Glycyrrhiza uralensis FISCH. Doctor thesis, Northeast Forestry University, Harbin, China (2003).
- 19) Guo ZZ, Wu YL, Wang RF, Wang WQ, Liu Y, Zhang XQ, Gao SR, Zhang Y, Wei SL. Distribution patterns of the contents of five active components in taproot and stolon of Glycyrrhiza uralensis. Biol. Pharm. Bull., 37, 1253–1258 (2014).
- 20) Hoffmann CM, Huijbregts T, van Swaaij N, Jansen R. Impact of different environments in Europe on yield and quality of sugar beet genotypes. Eur. J. Agron., 30, 17–26 (2009).
- 21) Wei SL, Wang WQ, Wang JY, Sun ZR, Liu CS, Wang H, Yang ZG, Wu BC. Preliminary study in glycyrrhizin content and its influencing factors of wild and cultivated in different region of China. Chin. J. Chin. Mater. Med, 37, 1341–1345 (2012).
- 22) Lu SP, Sun Q, Wang JH, Sun BQ. Researches on influence factors and improvement of Radix Glycyrrhizae quality. Chin. Tradit. Herbal Drugs, 36, 1261–1263 (2005).
- 23) Zhou YQ, Yu H, Zhang YL, Sun SQ, Chen SL, Zhao RH, Zhou Q, Noda I. Evaluation on intrinsic quality of licorice influenced by environmental factors by using FTIR combined with 2D-IR correlation spectroscopy. J. Mol. Struct., 974, 127–131 (2010).
- 24) Lee SJ, Yan WK, Ahn JK, Chung IM. Effects of year, site, genotype and their interacrions on various soybean isoflavones. Field Crops Res., 81, 181–192 (2003).