Abstract
Autophagy has been an emerging field in the treatment of hepatic carcinoma since anticancer therapies were shown to ignite autophagy in vitro and in vivo. Here we report that ginsenoside Rg3 and Rh2, major components of red ginseng, induce apoptotic cell death in a stereoisomer-specific fashion. The 20(S)-forms of Rg3 and Rh2, but not their respective 20(R)-forms, promoted cell death in a dose-dependent manner accompanied by downregulation of Bcl2 and upregulation of Fas, resulting in apoptosis of HepG2 cells with poly ADP ribose polymerase cleavage. The LD50 value [45 µM for Rg3(S), less than 10 µM for Rh2(S)] and gross morphological electron microscopic observation revealed more severe cellular damage in cells treated with Rh2(S) than in those treated with Rg3(S). Both Rg3(S) and Rh2(S) also induced autophagy when undergoing induced apoptosis. Inhibition of autophagy with lysosomotrophic agents significantly potentiated the cellular damage, implying a favorable switch of the cell fate to tumor cell death. Blocking intracellular calcium with 1,2-bis(2-aminophenoxy)ethane-N,N,N′,N′-tetraacetic acid tetrakis(acetoxymethyl ester) (BAPTA-AM) restored the cell death induced by both Rg3(S) and Rh2(S). Our results suggest that the 20(S)-forms of Rg3 and Rh2 in red ginseng possess more potent antitumor activity with autophagy than their 20(R)-forms via calcium-dependent apoptosis.
Autophagy is an evolutionarily conserved intracellular degradation process that delivers cytoplasmic constituents to lysosomes via double-membrane vesicles termed autophagosomes. It contributes to the turnover of long-lived proteins and organelles to maintain cell homeostasis, and those up-regulated under cellular stress conditions such as nutrient depletion, hypoxia and anticancer treatments.1) In cancer cells, it is known that autophagy can lead to autophagic cell death, or can promote cancer cell survival via protective mechanism. Indeed, this double-edged role of autophagy often determines the fate of the cell as it is the balance between cell death and survival. However, the role of autophagy in cancer chemotherapy is still controversial.2,3)
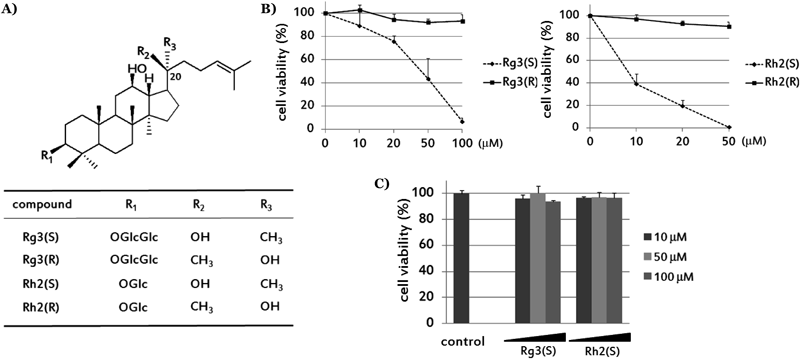
Red ginseng is the steam-processed form of Panax ginseng roots, and has been widely used in Asian countries as a tonic medicine. Its major bioactive components, ginsenosides, are saponins with dammarane skeletons that have diverse biological activity including antiinflammatory, anti-allergic, anti-cancer, anti-viral, anti-diabetic, anti-obesity, and antihypertension effects4–6) in spite of their low bioavailabilities, which are mainly due to their metabolism in the gastrointestinal tract. Ginsenoside has a hydrophobic triterpenoidal backbone to which hydrophilic sugar moieties are attached at the carbon-3, −6, and −20 positions. It is well known that the structural differences of ginsenosides, with respect to the numbers and positions of sugar molecules, hydroxyl groups in dammarane skeleton, and stereoisomerism at C-20, influence the biological activity of each ginsenoside.7–9) Among them, protopanaxadiol type ginsenoside Rg3 and Rh2, are reported to have cell growth inhibitory effects in various cancer cells.10,11) They possess one or two sugar units at C-3 and exist as stereoisomers depending on the position of the hydroxyl group at the C-20 position like other ginsenosides (Fig. 1A).
Although stereospecificity is important in the recognition of substrate molecules by tertiary-structural binding sites in drug action, only a few reports focus on the differences in biological activity of the epimers of ginsenoside.12–14) In this study, we compared cytotoxic and autophagy-inducing activities between 20(S)- and 20(R)-epimers of ginsenoside Rg3 and Rh2 in hepatocellular carcinoma HepG2 cells.
MATERIALS AND METHODS
Cell CultureHuman hepatocellular carcinoma cell line HepG2 was purchased from the Korean Cell Line Bank (KCLB, Korea). Cells were grown in Dulbecco’s modified Eagle’s medium (DMEM)/high glucose medium (Sigma, St. Louis, MO, U.S.A.) supplemented with 10% heat-inactivated fetal bovine serum (FBS) (Hyclone, Logan, UT, U.S.A.) along with penicillin (100 units/mL) and streptomycin (100 µg/mL) (Sigma) at 37°C in a humidified atmosphere of 5% CO2.
Male Sprague-Dawley (SD) rats were obtained from Koatech Co., Ltd. (Yongin, Korea) with body weight of 200–250 g. Primary rat hepatocytes were isolated from SD male rats using the collagenase perfusion technique. The freshly isolated hepatocytes were suspended in DMEM/high glucose medium containing 10% FBS, 1 µM dexamethasone (Sigma), 0.1 µM insulin (Sigma), 100 U/mL penicillin and 100 µg/mL streptomycin. Cells were inoculated on rat tail collagen-coated 35 mm×10 mm style culture dishes (Corning, NY, U.S.A.) at a density of 2×10⁵ cells/mL and maintained in a humidified incubator containing 5% CO2 gas at 37°C until cell attachment.
Measurement of Cell ViabilityThe cell growth inhibitory activities on HepG2 cells and rat primary hepatocyte were determined by the 3-(4,5-dimethylthiazol-2-yl)-2,5-diphenyltetrazolium bromide (MTT) colorimetric assay. Cells were treated with vehicle control dimethyl sulfoxide (DMSO) or compounds for 24 h with or without autophagy inhibitor, chloroquine (20 µM chloroquine diphosphate salt, ≥98%, Sigma-Aldrich) then added in solution with MTT (0.5 mg/mL; Sigma-Aldrich) to each well. After incubation for 4 h at 37°C the supernatant was aspirated, and the MTT-formazan crystals formed by the metabolically viable cells were dissolved in DMSO. The absorbance was measured by enzyme-linked immunosorbent assay (ELISA) at a wavelength of 540 nm. To investigate the anti-proliferative effect, the cells were incubated for 24 h in the various concentrations of Rg3 and Rh2 treated with or without 20 µM chloroquine (chloroquine diphosphate salt, ≥98%, Sigma-Aldrich) and 10 µM 1,2-bis(2-aminophenoxy)ethane-N,N,N′,N′-tetraacetic acid tetrakis(acetoxymethyl ester) (BAPTA-AM), ≥95%, Sigma-Aldrich).
Transmission Electron Microscopy (TEM)Cells were treated with 50 µM Rg3 and 20 µM Rh2 for 24 h and collected by trypsinization, fixed with Karnovsky’s fixation reagent primarily, and postfixed in 2% cacodylate-buffered osmium tetroxide. Cells were then stained with 0.5% uranyl acetate, embedded, sectioned, and analyzed using a JEM-1010 transmission electron microscope (JEOL, Tokyo, Japan).
Fluorescence MicroscopyIn order to detect acidic autophagic vacuoles, we used the autofluorescent marker monodansylcadaverine (MDC). After incubation with 25 µM Rg3 and Rh2 for 24 h, cells were labeled with 50 µM MDC at 37°C for 30 min, washed 3 times with PBS and mounted. Images were obtained at 400× magnification at the excitation wavelength 330–385 nm with an emission filter at 420 nm.
Western BlotCells were lysed with sodium dodecyl sulfate (SDS) lysis buffer containing a protease inhibitor cocktail. The lysates were centrifuged and supernatants collected. Proteins were separated in 8–15% SDS-polyacrylamide gel and transferred to a polyvinylidene difluoride (PVDF) membrane. Membrane was blocked in TBS containing 0.1% Tween 20 (TBST) and 5% nonfat dry milk for 1 h at room temperature and then incubated overnight with primary antibodies in TBST containing 1% nonfat dry milk at 4°C. Membranes were then washed with TBST and incubated with goat anti-rabbit (donkey anti-goat for UCP-2 detection) peroxidase conjugated immunoglobulin G (IgG) secondary antibody for 2 h, and immune complexes were detected by enhanced chemiluminescence. Primary antibodies used in Western blot were goat anti-UCP-2 (Santa Cruz) and rabbit anti-LC3B (Sigma-Aldrich), anti-cleaved PARP (Cell Signaling), anti-Bcl-2, anti-Fas, anti-HO-1, anti-TFEB, anti-ATPIF-1 (Santa Cruz), anti-OPA-1 (Novus Biologicals) and β-actin (Abfrontier). The intensities of bands were quantified by ImageQuant TL (GE Healthcare) software.
Cells were incubated in 20 µM of Rh2 and 50 µM of Rg3 for 8–16 h, then harvested. Ammonium chloride (NH4Cl 10 mM), a lysosomotropic agent, was added to cultural medium to block the proteolysis of LC3 II.
Flow CytometryTo analyze the cell cycle distribution and the mode of dell death, cells were plated in 6-well plates and treated with 50 µM Rg3(S) and 20 µM Rh2(S) with and without 20 µM chloroquine for 24 h. For cell cycle analysis, cells were harvested, washed with phosphate buffered saline (PBS), and fixed in 80% EtOH at 4°C overnight. They were then washed with PBS and resuspended in 500 µL of propidium iodide (PI) staining solution containing 40 µg/mL PI and 20 µg/mL RNase A in PBS, incubated at room temperature for 30 min in the dark, and then analyzed with FACSCaliburTM flow cytometer (BD Science, U.S.A.). For quantitative determination of apoptosis and necrosis, harvested cells were washed with PBS, diluted in annexin V binding buffer containing annexin V and PI, incubated for 15 min in the dark, and analyzed with flow cytometer. Data from 10000 cells per sample were used with CellQuest Pro (BD Science) software.
StatisticsStatistical significance of all data was determined by t-test, with values of p<0.05 considered statistically significant. All experiments were performed in triplicate.
RESULTS
20(S)-Ginsenoside Rg3 and Rh2 Induce Cytotoxic Effect and Impairement of Mitochondrial Architecture in HepG2It is already known that Rg3(S) and Rh2(S) have higher cytotoxic potency in HepG2 cells than 20(R)-epimers.10,15) In microscopic and MTT assay data as shown in Figs. 1B and 2B, we confirmed that Rg3(S) and Rh2(S) induced cell death in a dose-dependent manner in serum-free media but Rg3(R) and Rh2(R) induced little cell death under the same conditions. Moreover, Rh2(S), which has a more hydrophobic structure, showed more cytotoxicity (LD50<10 µM) than Rg3(S) (LD50<50 µM).
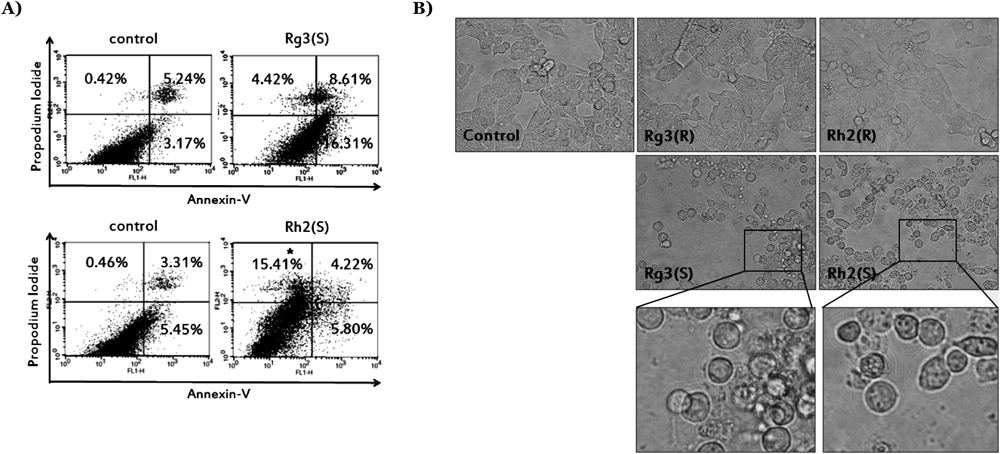
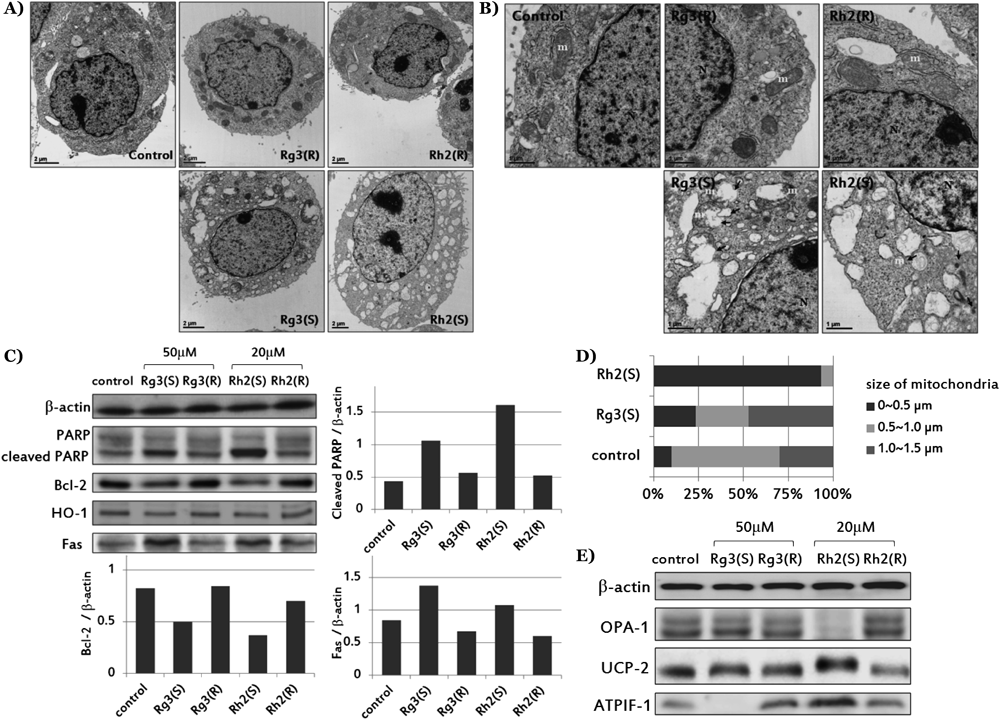
To determine whether the reduced viability of cells treated with Rg3(S) and Rh2(S) resulted from apoptotic or necrotic death, we performed annexin V/PI staining analysis. In flow cytometric analysis data (Fig. 2A), Rg3(S) increased the percentage of the annexin V-positive/ PI-negative cells while Rh2(S) increased annexin V-negative/PI-positive region. Thus, Rg3(S) induces apoptotic cell death, while more necrotic death occurs after Rh2(S) treatment. Furthermore, we assessed apoptosis-related gene expression induced by ginsenosides treatment using an immunoblotting method. As shown in Fig. 3C, cleaved PARP and Fas levels were increased by Rg3(S) and Rh2(S) and the anti-apoptotic protein Bcl-2 was decreased only in 20(S) epimer-treated cells. An oxidative stress response protein, heme oxygenase-1 (HO-1), was not affected by any compound.
In magnified transmission electron microscopy (TEM) image (Figs. 3A, B), swelling and ruptured mitochondria by autophagosome were observed in Rg3(S)-treated cell while small size fragmented mitochondria was observed by Rh2(S) (Fig. 3D). Differences between the effects of Rg3(S) and Rh2(S) with respect to mitochondrial protein expression were detected by Western blotting (Fig. 3E). The mitochondrial fusion protein, optic atrophy 1 (OPA-1) was markedly decreased by Rh2(S), but mitochondrial uncoupling protein (UCP-2) and ATPase inhibitory factor (ATPIF-1) levels were increased. The amount of ATPIF-1 was notably deficient in Rg3(S)-treated cells.
To investigate whether Rg3(S) and Rh2(S) induce cytotoxicity on normal liver cell, we treated 10–100 µM Rg3(S) and Rh2(S) in rat primary hepatocyte for 24 h. Result from MTT data showed that Rg3(S) and Rh2(S) had no significant cytotoxic effects in normal hepatocyte.
20(S)-Ginsenoside Rg3 and Rh2 Trigger Autophagy in HepG2In order to determine whether the ginsenosides Rg3 and Rh2 cause autophagy in HepG2 cells, cells were labeled with MDC, an auto-fluorescent marker for acidic autophagosomes. Cells treated with Rg3(S) showed remarkable increases in autophagic vacuole production, similar to the levels induced by the autophagy-inducing positive control tamoxifen. However, only a slight increase in MDC-labeled dots was observed in cells treated with Rh3(R) and Rh2(R) (Fig. 4A).
We used Western blotting to examine the expressions of LC3 II (Fig. 4B). During autophagy, the LC3 precursor (LC I) is cleaved and lipidated to LC3 II, an important component in autophagosome formation.16) Because LC3 II is continuously degraded during autophagy, we also treated ginsenoside with lysosomal inhibitor (NH4Cl) to confirm the autophagic flux. In cells treated with Rg3(S) and Rh2(S), expression of LC3 II was up-regulated than control in both circumstances with or without lysosomal inhibitor. But no significant increase of LC II was detected in 20(R) epimer-treated groups.
Under TEM, significant accumulation of autophagic lysosomal compartments was found in cells treated with Rg3(S) and Rh2(S) (Fig. 3A) accompanied by the characteristics of mitochondrial damage. In another immunoblotting result (Fig. 4C), a time dependent increase of TFEB, a master gene for lysosomal biogenesis, was also observed for each compound (8 h-treatment for Rg3(S) while 16 h-treatment for Rh2(S)). This result is consistent with TEM data.
Protective Autophagy of 20(S)-Ginsenoside Rg3 and Rh2Since autophagy could result in both survival and death of the cancer cells, we investigated how Rg3(S) and Rh2(S)-induced autophagy contributes to its antitumor effect in HepG2 cells. Cells were incubated with the autophagy inhibitor chloroquine, which blocks lysosomal function and prevents completion of autophagy, in addition to ginsenoside treatment. Our data showed that cell death rate induced by ginsenoside was markedly increased in the presence of chloroquine both in Rg3(S) and Rh2(S)-treated cells. However, no significant change in viability was observed in cells treated with their 20(R)-epimers and chloroquine or in cells treated with chloroquine alone (Fig. 5A).
In flow cytometry data using PI-staining (supplemental data), co-treatment with cytotoxic ginsenoside Rg3(S), Rh2(S) and chloroquine induced a switch of cells to the sub-G1 phase, which paralleled the MTT data. Increases of poly(ADP-ribose)polymerase (PARP) cleavage, and degradation of the death receptor Fas by chloroquine co-treatment (Fig. 5B), hallmarks of cell death, were also observed. We also predicted that Fas protein might be most easily cleaved after the N24 residue by calpain (Fig. 6A), a Ca2+-dependent cysteine protease, using the ‘GPS-Calpain Cleavage Detector (CCD)’ computational program.17) These results together suggest that the inhibition of autophagy enhanced cell death after Rg3(S) and Rh2(S) treatment, and it likely occurs through a Ca2+-mediated mechanism.
Additionally, we found that the Rg3(S), Rh2(S)-derived cytotoxic effects, which were fortified by autophagy inhibition, were restored when the Ca2+-chelator BAPTA-AM was added into the media (Fig. 6B). These results suggest that cytotoxicity and autophagy are induced simultaneously by Rg3(S) and Rh2(S) treatment, and that the autophagy phenomenon has a protective effect on HepG2 cancer cells through a Ca2+-mediated mechanism.
DISCUSSION
Hepatocellular carcinoma (HCC) is the most frequent type of liver cancer worldwide, can lead to a high rate of lethality. Surgical resection and liver transplantation have been recognized as selective strategies for HCC treatment but conventional methods of chemotherapy often have failed.18) Because of the high cost and recurrence rate of the disease, the development of an effective and newly cytotoxic and adjuvant chemotherapy agent is needed.
Here, we show that 20(S)-epimers of ginsenoside Rg3 and Rh2 are strong inducers of autophagy and apoptosis in HepG2 cell via mitochondrial and Ca2+-related pathways. However, their 20(R)-epimers have much less or no activity as it was seen that the two epimers of ginsenoside Rg3 and Rh2 exhibited different modes for inducing cytotoxicity and autophagy.
It was previously reported that stereochemistry is a key factor in the absorption of ginsenoside since 20(S) and 20(R)-epimers exhibit different membrane permeability and different responses to the drug transporter, P-glycoprotein.13) Because the C-20 hydroxyl group is closer to the C-12 hydroxyl group in the 20(S)-ginsenoside structure compared with the 20(R)-form, it might be suggested that different stereoselective interactions with lipid membranes may affect the biological activity of 20(S)- and 20(R)- ginsenosides.9) Furthermore, Jeong et al. demonstrated that Rg3(S) may have stronger interactions with the receptor region in Ca2+ and K+ ion channels than Rg3(R), because Rg3(S) has more tight hydrophobic packing near the chiral center than Rg3(R) in terms of tertiary structure and activity.14)
Besides the disparity of simple cell survival rate and molecular signaling on apoptosis and autophagy, only 20(S)-epimers of ginsenoside Rg3 and Rh2 led HepG2 cells to mitochondrial dysfunction. Damaged mitochondria could be easily found in Rg3(S) and Rh2(S)-treated groups in TEM images, but the expression patterns of mitochondria-related molecules (ATPIF-1, UCP-2 and OPA-1) after Rg3(S) and Rh2(S) treatment were not identical (Figs. 3D, E). Mitochondrial fragmentation induced by decreased fusion and increased fission is a representative phenomenon in apoptosis,19) and mitochondrial fission is known to be a positive regulator of mitochondrial autophagy.20) From results of Rh2(S)-treatment cells, features of mitochondrial fragmentation and autophagy were observed simultaneously, which may be represent a bias towards mitochondrial fission. It can also be deduced that normal mitochondrial fusion was impaired and ATP-synthesis in mitochondria was blocked by UCP-2 activation. This triggered a compensatory mechanism for mitochondrial ATP deficiency, like the enforcement of ATPIF-1 activity or the switch of ATP synthesis from mitochondrial synthesis to glycolysis in the cytosol.21–23)
There have been a considerable number of reports on common regulators and complex cross-talk mechanisms between apoptosis and autophagy, which can be initiated by cellular stresses and can determine the fate of cancer cells in opposing ways, cell survival or cell death. In our data, Rg3(S) and Rh2(S) synergistically decreased cell viability when the autophagic flux was inhibited by treatment with chloroquine (Fig. 5A). In other words, Rg3(S) and Rh2(S) suppress the growth of the cells, but also protect HepG2 cells from the cytotoxic activity of the compounds by simultaneously inducing protective autophagy. Due to this process, PARP cleavage expression was increased and the death receptor Fas protein was degraded (protein was down-sized about 2–3 kDa) by autophagy inhibition (Fig. 5B). Like many receptors, Fas is suspected to be internalized and degraded by endosomes, and this post-translational modification mediated by some apoptosis-inducible agents.24) Therefore, we tried to predict the cleavage site of Fas protein by the Ca2+-dependent cysteine protease, calpain, using the GPS-calpain cleavage detector (CCD) program and found that the most cleavable position is after 24N (Fig. 6A). Considering that the average molecular weight of an amino acid is 110 Da, the differential expected protein size after degradation by calpain is about 2.3 kDa, which is compatible with our immunoblotting data. Moreover, mitochondrial Ca2+ accumulation was demonstrated to be significant for the phosphorylation of mitochondrial proteins including UCP-2, a putative target of kinases.25) Mobility shifts occurring in Western blot data, which were accompanied by enforced expression of UCP-2 in Rh2(S)-treated cells (Fig. 3D), can also be explained by Ca2+-dependent phosphorylation.26) From these results, we could surmise Ca2+ ion in cytosol and mitochondria of HepG2 cell might be a key regulator between Rg3(S), Rh2(S)-derived apoptosis and autophagy, and this assumption was concurrent with the data using the Ca2+ ion chelator BAPTA-AM and autophagy inhibitor chloroquine (Fig. 6B).
Several studies suggested that cancer therapy strategies including cytotoxic chemotherapeutic agents and radiation induce autophagy in cancer cells and increase the survival of cancer cells. As a result, co-treatment of autophagy inhibitors with cancer therapies would be beneficial.27) Therefore, with respect to the usage of protopanaxadiol ginsenoside Rg3 and Rh2 as biologically active agents against HepG2 liver cancer cells, 20(S)-epimers are a more powerful choice than their 20(R)-forms, and co-treatment of autophagy inhibitors with Rg3(S) and Rh2(S) would be a more effective chemotherapy regimen because of their stereoselective cytotoxicity and protective autophagy-inducing effect.
Acknowledgment
This research was supported by the 2011 Grant from the Korean Society of Ginseng, the National Research Foundation of Korea through the Basic Science Research Program (Grant No. 2010-0023855), and BK21 Plus Program in 2014.
Conflict of Interest
The authors declare no conflict of interest.
Supplementary Materials
The online version of this article contains supplementary materials.
REFERENCES
- 1) Mizushima N. Autophagy: process and function. Genes Dev., 21, 2861–2873 (2007).
- 2) Steeves MA, Dorsey FC, Cleveland JL. Targeting the autophagy pathway for cancer chemoprevention. Curr. Opin. Cell Biol., 22, 218–225 (2010).
- 3) Chen N, Karantza-Wadsworth V. Role and regulation of autophagy in cancer. Biochim. Biophys. Acta —Mol. Cell Res., 1793, 1516–1523 (2009).
- 4) Choi KS, Song H, Kim EH, Choi JH, Hong H, Han YM, Hahm KB. Inhibition of hydrogen sulfide-induced angiogenesis and inflammation in vascular endothelial cells: Potential mechanisms of gastric cancer prevention by Korean red ginseng. J. Ginseng Res., 36, 135–145 (2012).
- 5) Lee DH, Cho HJ, Kang HY, Rhee MH, Park HJ. Total saponin from Korean red ginseng inhibits thromboxane A2 production associated microsomal enzyme activity in platelets. J. Ginseng Res., 36, 40–46 (2012).
- 6) Seo EY, Kim WK. Red ginseng extract reduced metastasis of colon cancer cells in vitro and in vivo. J. Ginseng Res., 35, 315–324 (2011).
- 7) Wang W, Zhao Y, Rayburn ER, Hill DL, Wang H, Zhang R. In vitro anti-cancer activity and structure–activity relationships of natural products isolated from fruits of Panax ginseng. Cancer Chemother. Pharmacol., 59, 589–601 (2007).
- 8) Popovich DG, Kitts DD. Structure–function relationship exists for ginsenosides in reducing cell proliferation and inducing apoptosis in the human leukemia (THP-1) cell line. Arch. Biochem. Biophys., 406, 1–8 (2002).
- 9) Qi L-W, Wang C-Z, Yua C-S. American ginseng: Potential structure–function relationship in cancer chemoprevention. Biochem. Pharmacol., 80, 947–954 (2010).
- 10) Park JA, Lee KY, Oh YJ, Kim KW, Lee SK. Activation of caspase-3 protease via a Bcl-2-insensitive pathway during the process of ginsenoside Rh2-induced apoptosis. Cancer Lett., 121, 73–81 (1997).
- 11) Dong H, Bai LP, Wong VKW, Zhou H, Wang JR, Liu Y, Jiang ZH, Liu L. The in vitro structure–related anti-cancer activity of ginsenosides and their derivatives. Molecules, 16, 10619–10630 (2011).
- 12) Lee JH, Ahn JY, Shin TJ, Choi SH, Lee BH, Hwang SH, Kang J, Kim HJ, Park CW, Nah SY. Effects of minor ginsenosides, ginsenoside metabolites, and ginsenoside epimers on the growth of Caenorhabditis elegans. J. Ginseng Res., 35, 375–383 (2011).
- 13) Zhang J, Zhou F, Niu F, Lu M, Wu X, Sun J, Wang G. Stereoselective regulations of P-glycoprotein by ginsenoside Rh2 epimers and the potential mechanisms from the view of pharmacokinetics. PLoS ONE, 7, e35768 (2012).
- 14) Jeong SM, Lee JH, Kim JH, Lee BH, Yoon IS, Lee JH, Kim DH, Rhim H, Kim Y, Nah SY. Stereospecificity of ginsenoside Rg3 action on ion channels. Mol. Cells, 18, 383–389 (2004).
- 15) Jiang JW, Chen XM, Chen XH, Zheng SS. Ginsenoside Rg3 inhibit hepatocellular carcinoma growth via intrinsic apoptotic pathway. World J. Gastroenterol., 17, 3605–3613 (2011).
- 16) Mizushima N, Yoshimori T. How to interpret LC3 immunoblotting. Autophagy, 3, 542–545 (2007).
- 17) Liu Z, Cao J, Gao X, Ma Q, Ren J, Xue Y. GPS-CCD: A novel computational program for the prediction of calpain cleavage sites. PLoS ONE, 6, e19001 (2011).
- 18) Carr BI. Hepatocellular carcinoma: current management and future trends. Gastroenterology, 127 (Suppl. 1), S218–S224 (2004).
- 19) Lee YJ, Jeong SY, Karbowski M, Smith CL, Youle RJ. Roles of mammalian mitochondrial fission and fusion mediators Fis1, Drp1, and Opa1 in apoptosis. Mol. Biol. Cell, 15, 5001–5011 (2004).
- 20) Twig G, Hyde B, Shirihai OS. Mitochondrial fusion, fission and autophagy as a quality control axis: The bioenergetic view. Biochim. Biophys. Acta, 1777, 1092–1097 (2008).
- 21) Chen L, Gong Q, Stice JP, Knowlton AA. Mitochondrial OPA 1, apoptosis, and heart failure. Cardiovasc. Res., 84, 91–99 (2009).
- 22) Baffy G, Derdak Z, Robson SC. Mitochondrial recoupling: a novel therapeutic strategy for cancer? Br. J. Cancer, 105, 469–474 (2011).
- 23) Faccenda D, Campanella M. Molecular regulation of the mitochondrial F1F0-ATPsynthase: physiological and pathological significance of the inhibitory factor 1 (IF1). Int. J. Cell Biol., 2012, ID367934 (2012).
- 24) Tollefson AE, Hermiston TW, Lichtenstein DL, Colle CF, Tripp RA, Dimitrov T, Toth K, Wells CE, Doherty PC, Wold WSM. Forced degradation of Fas inhibits apoptosis in adenovirus-infected cells. Nature, 392, 726–730 (1998).
- 25) Graier WF, Malli R, Kostner GM. Mitochondrial protein phosphorylation: instigator or target of lipotoxicity? Trends Endocrinol. Metab., 20, 186–193 (2009).
- 26) Lee CR, Park YH, Kim YR, Peterkofsky A, Seok YJ. Phosphorylation-dependent mobility shift of proteins on SDS-PAGE is due to decreased binding of SDS. Bull. Korean Chem. Soc., 34, 2063–2066 (2013).
- 27) Amaravadi RK, Thompson CB. The roles of therapy-induced autophagy and necrosis in cancer treatment. Clin. Cancer Res., 13, 7271–7279 (2007).