Abstract
Cell culture processes that produce therapeutic antibodies with high productivity (titer) and low aggregate content reduce the risk of adverse effects and expense to patients. To elucidate the mechanism of aggregate formation, we compared trastuzumab samples produced from two contrasting cell lines: cell line A, which exhibits high titer and low aggregate content, and cell line B, which exhibits low titer and high aggregate content. Cell line B produced significantly fewer (approximately 1/3) antibodies compared with cell line A and contained higher (approximately 3-fold) percentages of aggregates. The aggregates of antibodies found in the protein A-purified samples of cell line B were associated mostly with noncovalent interactions. Cell line B exhibited a low content of monomers/dimers of light chains in the medium and within cells. Because light chains are essential for the correct folding of heavy chains and secretion of mature antibodies, the characteristics of cell line B may be attributed to low levels of light chain production. In addition, protein A-purified antibodies from cell line B (but not those from cell line A) contained fragments that are expected to expose the hydrophobic CH3 domain, which may serve as nuclei for aggregation.
Therapeutic monoclonal antibodies (mAbs) have been widely used because of their high antigenic specificity, long serum half-life, and low incidence of undesirable side effects. The global market for therapeutic mAbs is growing annually.1)
Because large doses of therapeutic mAbs are usually required to achieve clinical success, mAb production processes with high productivity (titer) are required to reduce the expense to patients. The quality of therapeutic mAbs expressed is also critical because mAbs produced from Chinese hamster ovary (CHO) cells are heterogeneous, owing to aggregation2,3) and various post-translational modifications.4,5) This aggregation and modification of antibodies may lead to a reduction in biological activity and/or an increase in undesirable side effects under certain circumstances. The content of aggregated species is one of the most critical sources of heterogeneity because protein aggregates may induce immunogenic responses and result in adverse events following administration.6,7) Therefore, the aggregate content of mAbs must be precisely controlled. Because protein aggregates are heterogeneous, they are classified on the basis of characteristics such as size, solubility, covalence, reversibility, structure (native/denatured), and formation mechanisms.2,8–11) Aggregate formation varies depending on cell line characteristics, physical properties of mAbs, medium compositions, and culture conditions.2,12–14) Because a serious concern has recently been raised that visible and subvisible particles, in addition to soluble aggregates, may potentially induce immunogenicity15–17) elucidating the mechanism of aggregate formation is becoming increasingly important.
We created 28 individual cell lines producing trastuzumab (trade names: Herclon and Herceptin) and measured various properties [heavy and light chain mRNA levels, protein disulfide isomerase (PDI)/heavy chain binding protein (BiP) mRNA levels, intracellular heavy and light chain content, and aggregate contents] that are considered to be closely related to titer/aggregate content.18) Our results suggest that correct and efficient assembly and/or folding of an antibody molecule in the endoplasmic reticulum (ER) are important for high titer and low aggregate contents. No obvious relationships were observed, however, between LC/HC mRNA levels and mAb titers (an indicator of quantity of produced protein) and between LC/HC mRNA levels and high molecular weight species content (HMWS(%), an indicator of quality of produced protein). To identify the characteristics of cell lines that produce mAb with qualities suitable for large-scale production, we investigated whether the characteristics of antibody samples and cells differed between different cell lines.
Accordingly, cell line A (high titer and high quality) and cell line B (low titer and low quality) were selected from the 28 cell lines, and each cell line was cultured three times. Size-exclusion chromatographic (SEC) and electrophoretic analyses of samples obtained from these cultures revealed a significant difference between the two cell lines and large variability among the three mAb batches produced by cell line B. These differences and variability in productivity (titer) and quality (aggregates) were found to be due to differences and variation in light chain (LC) production.
MATERIALS AND METHODS
Cell Culture and Antibody ProductionTwo single clonal cell lines (designated as A and B) were selected from the 28 cell lines that had been created by transfecting cells of the CHO cell line with vectors expressing heavy and light chains. Each of the two cell lines was inoculated at a density of 0.3×10⁶ cells/mL into three separate 2-L glass bioreactors (Able Co., Tokyo, Japan) with working volumes of 800 mL. Basal and feed-culture media (serum free) were prepared in-house. The cultures were stirred at 85 rpm at a temperature of 37°C, and under a 5% CO2 atmosphere for 14 d. On day 3 and thereafter, daily feeding (at a volume equivalent to 3% of the media that remained in the reactor) of the feed medium was initiated. Sampling for analysis was performed daily. The number of total cell and viable cells was determined using a Vi-Cell XR (Beckman Coulter, Fullerton, CA, U.S.A.). A portion of each sample was stored at −20°C and used for analytical testing until the analyses were completed. At the end of day 14, the culture supernatant was collected and stored at −20°C until further analysis. The cells were washed twice with phosphate-buffered saline using a centrifugal separator, and the samples for Western blot analyses were then stored at −80°C.
The titer of the antibody in media was determined using a Protein A column (4.6×50 mm; Applied Biosystems, Foster City, CA, U.S.A.) at an ambient temperature (25°C). The column was washed with 100% mobile phase A [20 mM sodium phosphate and 300 mM NaCl (pH 7.0)] after sample injection at a flow rate of 3 mL/min and was eluted with 100% mobile phase B [20 mM sodium phosphate and 300 mM NaCl (pH 2.8)]. Antibodies were detected at 214 nm using an UV detector, and their titers were determined using a calibration curve calculated using standard samples.
Purification of AntibodiesAntibodies in culture media were purified using protein A affinity chromatography. The culture medium was loaded onto a Protein A (MabSelect SuRe) column (1×5 cm; GE Healthcare Life Sciences, Piscataway, NJ, U.S.A.) equilibrated with washing solution (10 mM sodium phosphate, pH 6.0) to selectively adsorb the antibody to protein A. After the column was washed with five column volume of washing solution, the adsorbed antibody was eluted with buffer containing 10 mM sodium citrate (pH 3.4), and the eluent was adjusted to pH 5.5 with 1.5 M Tris. This solution was exchanged with formulation buffer [10 mM glutamate (pH 5.5) containing 262 mM sorbitol] and concentrated using an Amicon Ultra 10K (Millipore, Billerica, MA, U.S.A.) centrifugal filter unit. The antibody concentration of each sample was determined by absorbance at 280 nm on the basis of the extinction coefficient 1.48 (mg/mL)−1 cm−1, which was estimated as described.19)
Size-Exclusion Chromatography (Regular-SEC)Regular SEC (SEC without lithium dodecyl sulfate) was performed using two TSKgel G3000SWXL columns (7.8 mm i.d.×30 cm; Tosoh, Tokyo, Japan) connected in tandem and preceded by a guard column. The mobile phase consisted of 50 mM sodium phosphate, 500 mM NaCl, and 5% (v/v) ethanol (pH 7.0), and the isolation conditions were as follows: flow rate, 0.5 mL/min; column temperature, 25°C; injected protein, 20 µg; and detection wavelength, 215 nm. The analysis of each sample was repeated three times. The protein A-purified antibody samples were diluted with the formulation buffer. Relative molecular mass (Mr) of each peak was estimated by gel filtration standard (Product No. 151–1901, Bio-Rad Laboratories, Hercules, CA, U.S.A.).
SEC with Lithium Dodecyl Sulfate (LDS-SEC)LDS-SEC was performed using two columns [TSKgel G3000SWXL column (7.8 mm i.d.×30 cm; Tosoh) and TSKgel G4000SWXL column (7.8 mm i.d.×30 cm; Tosoh)] connected in tandem and preceded by a guard column. The mobile phase consisted of 50 mM sodium phosphate, 150 mM NaCl, and 0.1% w/v LDS (pH 7.0), and the isolation conditions were as follows: flow rate, 0.5 mL/min; column temperature, 25°C; injected protein, 20 µg; and detection wavelength, 215 nm. The analysis of each sample was repeated three times. The protein A-purified antibody samples were diluted with the formulation buffer supplemented with LDS before the analyses, and the final LDS concentration in each sample was adjusted to be similar to that of the mobile phase. Mr of each peak was estimated by gel filtration standard (Product No. 151–1901, Bio-Rad Laboratories).
Quantification of Free Sulfhydryl GroupsThe protein A-purified antibody samples were diluted with the formulation buffer to a concentration of 8.9 mg/mL. A 200-µL aliquot of each sample was mixed with 500 µL of denaturation buffer [50 mM phosphate (pH 6.8) containing 150 mM NaCl, 7 M guanidine HCl, and 1 mM sodium ethylenediamine-N,N,N′,N′-tetraacetic acid, disodium salt, dehydrate] and incubated for 60 min at 37°C. The denatured samples were each treated with 15 µL of 4,4′-dithiodipyridine solution (50 mM in methanol), and the absorbance of each sample at 343 nm was measured using a U-3310 spectrophotometer (Hitachi Tokyo, Japan). To obtain a calibration curve, N-acetyl-L-cysteine solutions were prepared at final concentrations from 0 µM to 30 µM and were treated with the same procedure as samples. The analysis of each sample was repeated three times.
Western BlottingFor sample preparation, frozen cells (1×10⁷) were thawed and solubilized using the Qproteome Mammalian Protein kit (Qiagen, Venlo, the Netherlands), according to the manufacturer’s protocol. For reducing conditions, 10 µL NuPAGE LDS sample buffer (4×; Invitrogen, Foster City, CA, U.S.A.), 4 µL reducing agent (10×; Invitrogen), and 17.8 µL of purified water were added to 8.2 µL of the sample (equal to 8.2×10³ cells). For non-reducing conditions, the reducing agent was omitted, and 4 µL of 25 µM N-ethylmaleimide solution was added instead.
Culture media and purified antibodies were diluted to protein concentrations of 0.2 mg/mL with the formulation buffer and treated by the same procedures as frozen cells. The final antibody concentration was 3 µg/mL.
Sodium dodecyl sulfate-polyacrylamide gel electrophoresis (SDS-PAGE) and transfer were carried out as follows. Samples were heated at 65°C for 10 min before loading onto a NuPAGE 4%–12% Bis-Tris gel (1.0 mm×17 well, Invitrogen), followed by separation with NuPAGE MOPS SDS running buffer (×20, Invitrogen) with (for reducing conditions) or without (non-reducing conditions) NuPAGE antioxidant (Invitrogen) at 200 V for 45 min. Separated proteins were transferred to nitrocellulose membranes by electroblotting using iBlot Transfer Stacks, Regular (Invitrogen), according to the manufacturer’s protocol.
Detection and quantification were carried out as follows. The LC and HC polypeptides of trastuzumab were detected using anti-human κ light chain rabbit antibody (Product No. K1255, Sigma-Aldrich, St. Louis, MO, U.S.A.) and anti-human γ-chain-specific rabbit antibody (Product No. I9764, Sigma-Aldrich), respectively. Antigen–antibody conjugates were detected using the Novex ECL Chemiluminescent Substrate Reagent Kit (Invitrogen) containing secondary antibody. Immunoreactive signals were detected using an LAS-1000 plus Luminoimage Analyzer (FUJIFILM, Tokyo, Japan). Comparison of the relative intensities of peaks was performed using MultiGauge, version 2.2 (FUJIFILM). Mr of each peak was estimated by the MagicMark XP Western Standard (Invitrogen) using MultiGauge. The molecular weight of the antibody was calculated assuming an antibody molecule having two oligosaccharide chains of the most major G0F1 but without C-terminal lysine residues (to be reported elsewhere). Molecular weights of antibody fragments were also calculated assuming G0F1.
Cation-Exchange (CEX) ChromatographyCEX was performed by modification of the chromatofocusing method20) using a ProPacWCX-10 column (4.0 mm i.d.×25 cm; Dionex, Sunnyvale, CA, U.S.A.). Mobile phase A consisted of 10 mM NaH2PO4 containing 60 mM NaCl. Mobile phase B consisted of 10 mM Na2HPO4 containing 60 mM NaCl. The column was equilibrated with composition of 80% of mobile phase A and 20% of mobile phase B. After a 5-min isocratic run at 20% of mobile phase B, the ratio of eluting solvent B was linearly increased to 75% from 5 to 55 min. Other conditions were as follows: flow rate, 0.8 mL/min; column temperature, 37°C; injected protein, 25 µg; and detection wavelength, 214 nm. The analysis of each sample was repeated three times.
Liquid Chromatography-Mass Spectrometry (LC-MS)Tandem LC-MS was used for identifying the antibody and post-translational modification in samples. To prepare the samples for analysis, PNGase F (final concentration, 19.2 units/µL; New England Biolabs., Beverly, MA, U.S.A.) was added to the purified antibodies, and the mixture was incubated overnight at 37°C. Reverse-phase separation was performed using an ACQUITY UPLC system (Waters) equipped with a MassPREP Micro desalting column (4.0 mm i.d.×2.5 cm; Waters). The column was equilibrated with 95% mobile phase A (0.1% formic acid in purified water) and 5% mobile phase B (0.1% formic acid in acetonitrile) and was maintained at 80°C throughout the run. After 5 µg of protein sample was injected into the column, elution was initiated with the equilibration mixture (5% B) at a flow rate of 0.5 mL/min for 0.5 min. At this point, the flow rate was slowed down to 0.2 mL/min, and the elution was completed with a linear gradient of 5%–90% mobile phase B for 10 min.
MS analyses were performed using a Xevo TQ mass spectrometer (Waters). The analytical conditions were as follows: ESI source; positive ion mode; capillary voltage, 2.5 kV; drying gas flow rate, 1000 L/h; vaporizing temperature, 350°C; cone gas flow rate, 50 L/h; and ion source temperature, 120°C. Deconvolution of the electrospray ionization mass spectra was performed using BiopharmaLynx software (Waters) with previously described conditions.21) The percentage of each peak of each purified antibody sample was determined using the BiopharmaLynx software.
Analysis of Hydrophobic Surface AreaThe protein A-purified antibody was diluted with the formulation buffer to a concentration of 1.565 mg/mL, and the fluorescence of a sample (2320 µL) of the solution was determined using a Fluorolog-3 Spectrofluorometer (Horiba Jobin Yvon, Longjumeau, France) with amicroLAB 500 series diluter dispenser (autotitration injector, Hamilton, Reno, NV, U.S.A.). After incubating the sample at 25°C for 5 min, absorbance was determined using an excitation wavelength of 373 nm, an emission wavelength of 480 nm, and a slit width of 2.2 nm. Formulation buffer (20 µL) containing 2.08 mM 1-anilinonaphthalene-8-sulfonate (ANS) was slowly added to the sample solution with stirring, and the fluorescence intensity was determined after holding at 25°C for 2 min. These procedures were automatically repeated nine times.
Statistical AnalysesStatistical analyses were performed using SPSS (IBM Corporation, Armonk, NY, U.S.A.). The Student’s t-test was used when no significant difference was observed in dispersion between the two groups (if the result of the F-test was p>0.05), and the Welch’s t-test was used when a significant difference was observed. Tukey’s honestly significant difference test for multiple comparisons was used when no significant difference was observed in dispersion among the three groups, and the Games–Howell test for multiple comparisons was used when a significant difference was observed. A p value of <0.05 was considered significant.
RESULTS AND DISCUSSION
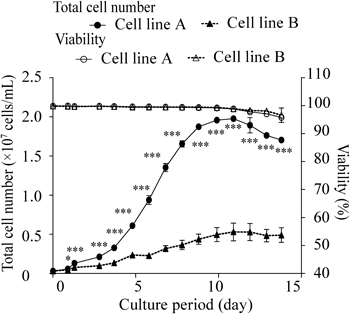
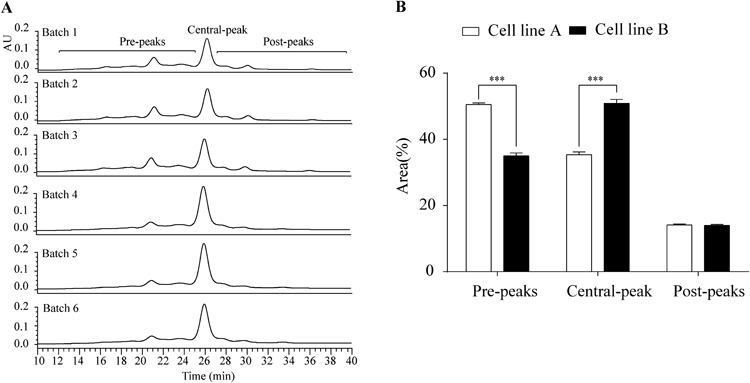
Characterization of Antibody AggregatesCell line B exhibited markedly lower (by approximately 1/3) mAb titer and cell proliferation activity than cell line A (Fig. 1, Table 1). The titer difference between cells was attributed mainly to differences in cell proliferation (cell growth) because the titer ratio of cell lines A to B (2.8) is close to the ratio of the maximum viable cell densities of cell lines A to B (3.7), in other words, because the specific antibody production rate did not differ between the two cell lines (39.3 vs. 43.9 pg/cell/d; Table 1). A marked relative standard deviation in antibody titer and proliferation of cells was observed among the three batches of cell line B (Table 1). All three purified mAb samples from cell line B (batches 4–6) exhibited higher quantities (approximately 3 times on average) of HMWS than those from cell line A (batches 1–3; refer to regular-SEC chromatograms in Fig. 2A and relative area values in Fig. 2B). However, the difference in HMWS(%) between the two cell lines was insignificant (Fig. 2B) owing to the large variance observed in cell line B (note HMWS peaks at 27.4 min, indicated with an arrow, Fig. 2A). In addition to the quantitative difference, a qualitative difference was observed between the HMWS elution patterns of the two cell lines (Fig. 2A); a definite peak was observed at a void volume for cell line A only, whereas the peaks observed at 25.0 min and 27.4 min were much larger for cell line B than those for cell line A. These observations suggest that there are several different HMWS and that their distribution is different between the two cell lines.
Table 1. Characterization of Cell Lines
| Cell line | Batch | Titer (g/L) | Maximum viable cell density (×106 cells/mL) (Proliferation) | Specific antibody production rate (pg/cell/d)a) |
|---|
| Cell line A | Batch 1 | 4.37 | 19.64 | 40.86 |
| Batch 2 | 4.00 | 19.77 | 37.72 |
| Batch 3 | 4.21 | 19.16 | 39.30 |
| Average±S.D. | 4.2±0.2 | 19.5±0.3 | 39.3±1.6 |
| RSDb) | 4.5% | 1.7% | 4.0% |
| Cell line B | Batch 4 | 1.70 | 6.02 | 45.80 |
| Batch 5 | 1.69 | 6.04 | 44.70 |
| Batch 6 | 1.17 | 3.95 | 41.19 |
| Average±S.D. | 1.5±0.3 | 5.3±1.2 | 43.9±2.4 |
| RSDb) | 19.7% | 22.5% | 5.5% |
a) Product concentration was plotted against the integral viable cell density from days 0 to 10, and specific antibody production rate was determined as the slope calculated by a least-square method. b) Abbreviation used: RSD, relative standard deviation.
One criterion for classifying protein aggregates is the type of bond (covalent vs. noncovalent). To compare the percentage of noncovalent and covalent HMWS between the two cell lines, protein A-purified antibody samples obtained from each cell line were analyzed by LDS-SEC (Fig. 2C), in which noncovalent aggregates were dissociated into their components. In contrast to the higher aggregate content of cell line B in the regular-SEC analysis, significantly lower HMWS(%) was observed in cell line B compared with cell line A in the LDS-SEC analysis (Fig. 2B). By comparing corresponding HMWS(%) values obtained in the regular-SEC (Fig. 2A) and LDS-SEC analyses (Fig. 2C), the contents of noncovalent aggregates in HMWS were estimated (Table 2). The majority of HMWS in the protein A-purified antibody samples from cell line B (sample group B) consisted of noncovalent aggregates (86.1%±3.0%; Table 2). In contrast, HMWS in the protein A-purified antibody samples from cell line A (sample group A) predominantly comprised covalent aggregates, with a noncovalent aggregate content of only 32.0%±8.9% of HMWS. Because the inclusion of LDS in the SEC eluant and samples resulted in reduced HMWS(%) and a concomitant marked increase in the main species(%) and LMWS(%) in cell line B, noncovalent aggregates observed in cell line B were found to include full-sized monomer antibodies and LMWS such as antibody fragments. The major HMWS peak (at 27.4 min) in the regular-SEC analysis (Fig. 2A) was found to correspond to mAb dimers (to be reported elsewhere). In contrast, cell line B exhibited significantly higher LMWS(%) than cell line A in the LDS-SEC analysis (Fig. 2D). These results suggest that the major noncovalent aggregates (corresponding to dimers) are classified into two types: one consisting of two antibody monomers and the other of antibody monomer and LMWS. The association of two antibody monomers may be driven by the hydrophobic surfaces of the partially misfolded monomer generated in the ER that experience ER stress. One candidate of LMWS is des-Fab (an antibody molecule in which one of the Fab domains is missing22)) with a relative molecular mass (Mr) of approximately 1×10⁵. The retention time of the peak observed at 32 min in LDS-SEC (Fig. 2C, annotated with an asterisk) corresponds to an Mr of 1.1×10⁵. The des-Fab was actually observed by Western blotting analyses as described below.
Although the majority of HMWS observed in protein A-purified mAb from cell line A was covalently associated, HMWS observed at the void volume of regular-SEC (Fig. 2A) were noncovalently associated, with their peaks disappearing in the presence of LDS (Fig. 2C). Therefore, the observed HMWS were inferred to be heterogeneous with respect to size, mode of association, and components, and their distribution varied depending on the cell line.
Determination of the Free SH Group in an Antibody MoleculeCovalent protein aggregates result from the formation of disulfide bonds, dityrosine residues, or thioether bonds.2,23–25) Because the fraction of covalent aggregates in HMWS from cell line A was much higher than that from cell line B, we evaluated the number of free SH groups per antibody molecule under denaturing conditions to determine whether the difference in percentages of covalent aggregates between the two sample groups was due to the difference in the number of free SH groups. However, this possibility was excluded because the number of free SH groups per antibody molecule (0.47±0.01 mol/mol) in sample group A was significantly lower (p<0.001) than that (0.51±0.01 mol/mol) in sample group B. The presence of dityrosine residues or thioether bonds could not be confirmed by peptide mapping using LC-MS (data not shown), and the identity of the intermolecular covalent bonds in the covalent aggregates could not be determined in the present experiments.
Analyses of LCs and HCs in Purified Antibodies, Cells, and Culture MediaThe noncovalent association/aggregation of proteins is due to factors such as deviation from the correctly folded native structure, wide hydrophobic surface area of protein molecules, and reduced repulsive forces between protein molecules (i.e., lowered colloidal stability26)). LCs are critical for the proper folding of HCs in ER, and the amount of free LCs in culture media is related to its productivity.27–32) Although the production of LCs is reportedly related to the quality (aggregate content) of mAb,33,34) the analyses in these study were conducted under conditions in which the productivity was intentionally lowered. Because these conditions have little relevance to those in which therapeutic mAbs are actually produced, it is important to analyze the effects of LCs on quality under conditions in which the cell selection process is actually performed.
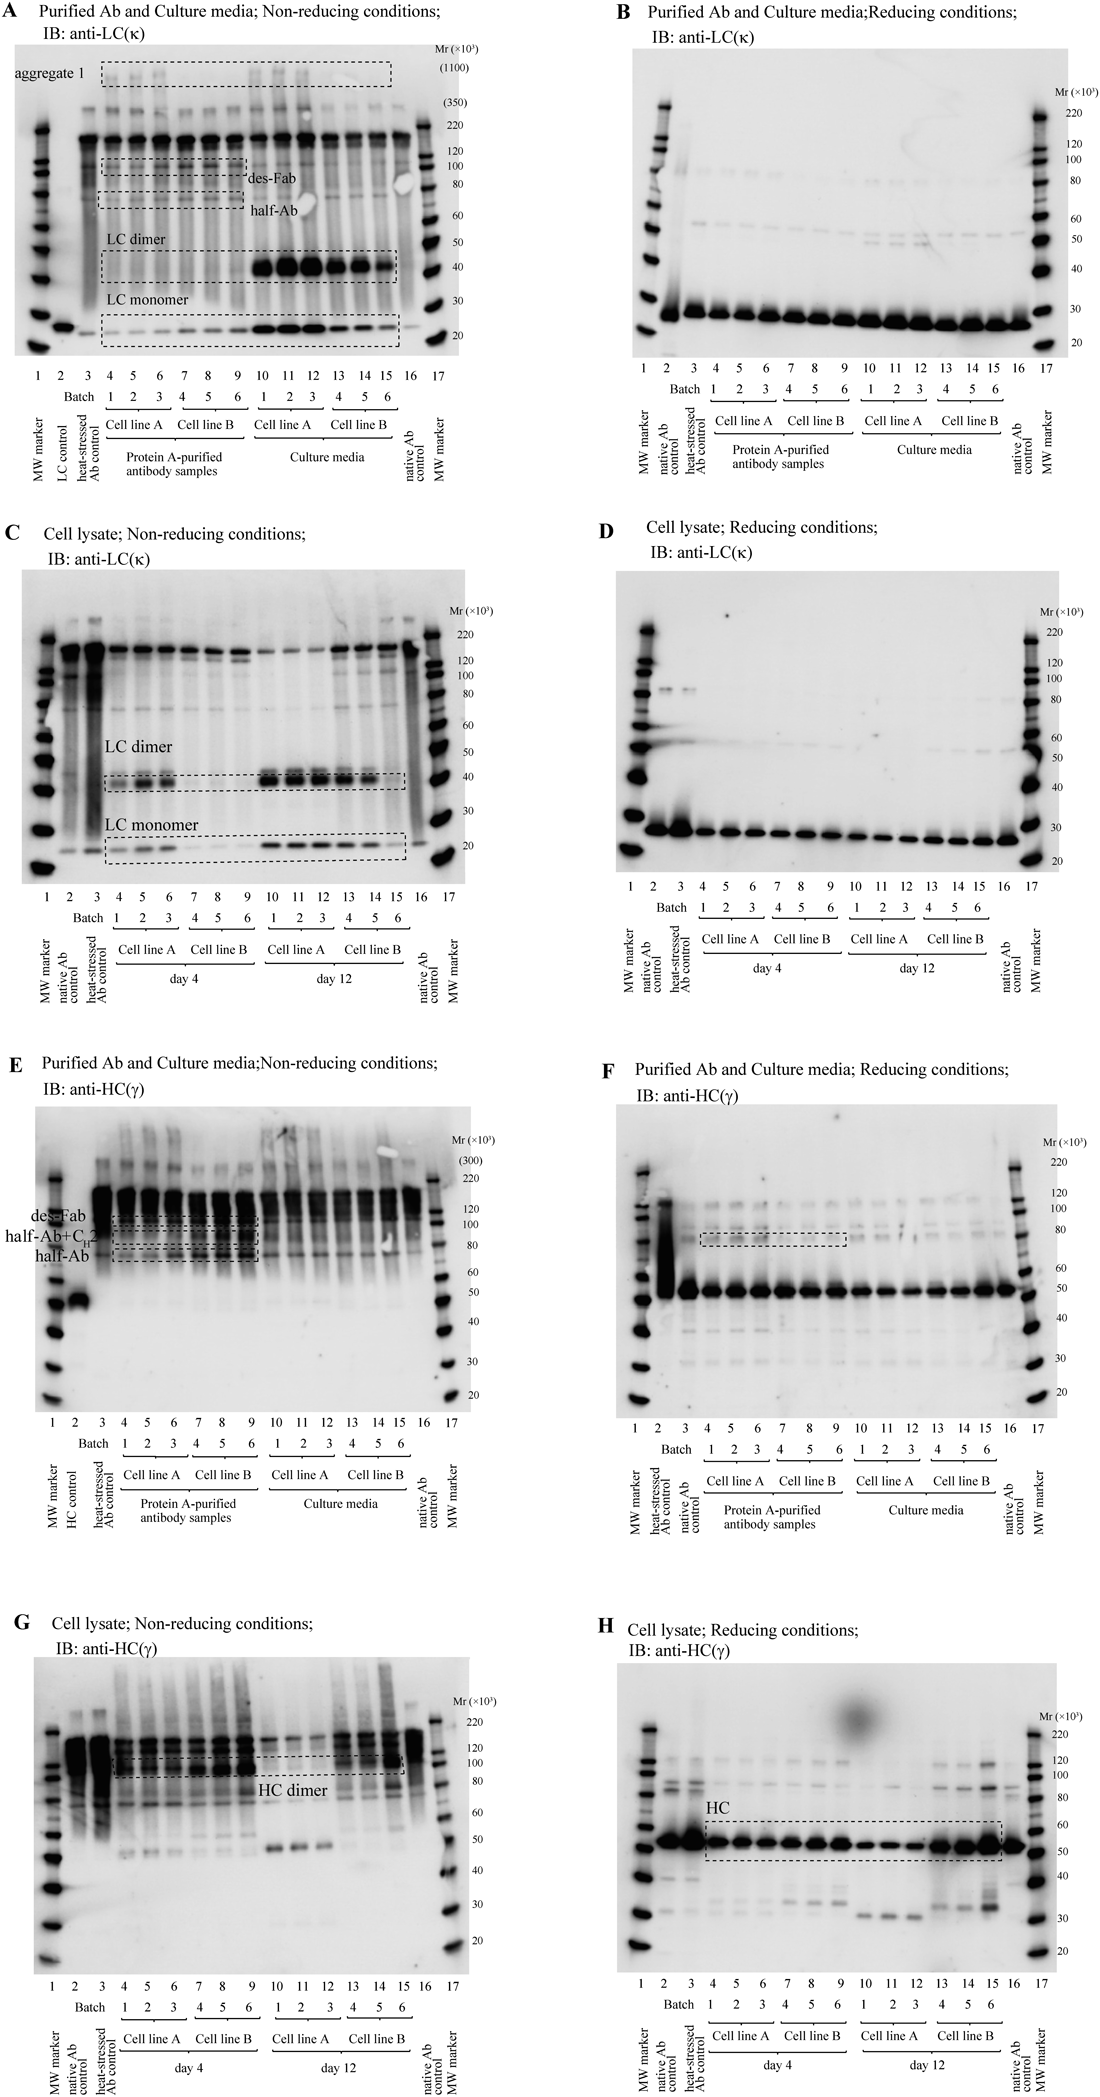
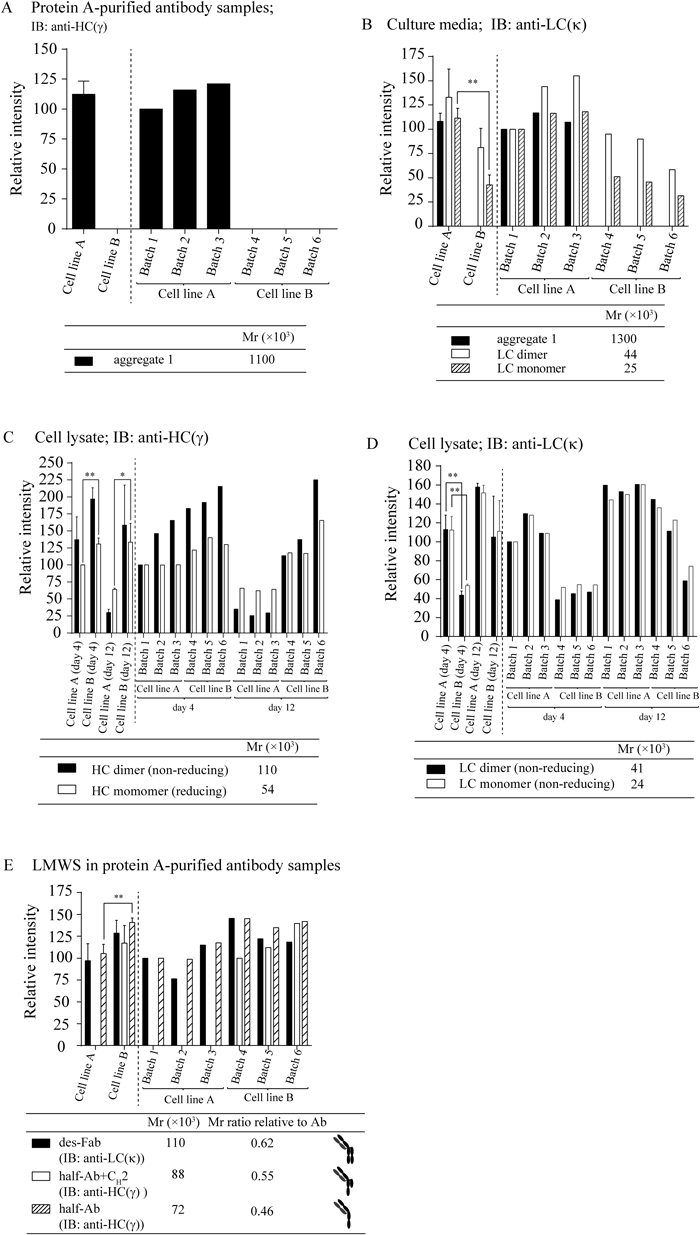
To determine whether the production level of LCs in host cells is involved in the differences in aggregate formation observed between the cell lines and whether the LC production is involved in the variability of mAb production occasionally observed even when the same cell line is used, protein A-purified mAb samples, culture media, and cell lysates were subjected to Western blotting (Figs. 3A–H). Western blotting analysis of cell lysate was performed at two time points: day 4 (in a growth phase with little antibody production) and day 12 (in a stationary phase with constantly high antibody production), and the intensity of each band was compared between cell lines A and B (Figs. 4A–E).
The comparison of cell line B with cell line A revealed that the amounts of LC dimers and monomers secreted into the media by cell line B were lower than those by cell line A (Figs. 3A, 4B) and that the amounts of LC dimers and monomers retained in cell line B were also lower than those in cell line A (Figs. 3C, 4D). In agreement with the lower production of LCs in cell line B than cell line A, cell line B accumulated higher amount of HC dimers (Figs. 3G, 4C) and HC monomers (Figs. 3H, 4C) than cell line A. When HCs are produced in ER in the absence of sufficient amounts of LCs, HCs remains in ER as a tight complex (in an unfolded state) with an HC-binding protein and are not secreted from ER.27,29,32) The accumulated HCs in ER are considered to induce ER stress. Moreover, we have found that the mRNA levels of PDI and BiP positively associate with HMWS(%) and that these mRNA levels in cell line B were higher than those of cell line A.18) Therefore, the difference between the two cell lines in quality and productivity (titer) may be ascribed to the difference in their productivity of LCs. In agreement with this interpretation, batch 6 (cell line B) with the highest HMWS content (Fig. 2B) and the lowest titer (Table 1) exhibited the lowest amount of LC dimers and monomers in culture media (Figs. 3A, 4B) and in cell lysates (Figs. 3C, 4D) under non-reducing conditions. Moreover, batch 6 exhibited the highest amount of accumulated HC dimers among all batches (Figs. 3G, 4C).
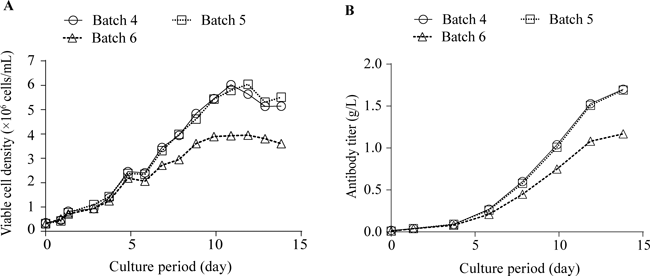
Taken together, our results suggest that the low antibody titer and high aggregate content of cell line B are due to the low production rate of LC in the cells and that some of the misfolded antibody molecules are secreted into the medium, leading to aggregate formation. Because accumulated HC dimers in cell line B on day 4 exhibited higher levels (Figs. 3G, 4C) and the mRNA levels of BiP and PDI in the cell line B in the growth phase are higher than those of the cell line A in our previous study,18) cell line B was inferred to induce ER stress at an early stage of cell culture. This ER stress, in turn, may suppress cell proliferation (cell growth). The marked variations in titer and cell proliferation observed among the three batches of cell line B support our hypothesis (Figs. 5A, B), although the cause and mechanisms remain unclear. These results confirm the importance of LCs in the assembly/folding of antibody molecules and, in turn, in their titer and quality.
Previously, we suggested the presence of des-Fab (Mr 1.1×10⁵) in the protein A-purified antibody. The bands corresponding to the des-Fab were observed in Figs. 3A (anti-kappa) and 3E (anti-gamma). Figure 3E also exhibits bands with Mr 7.2 and 8.8×10⁴ whose intensities are higher in cell line B than in cell line A. Their Mr values indicate that these two bands correspond to the half-antibody (comprising one HC and one LC) and the half-antibody with a covalently bonded CH2 domain (referred to half-antibody+CH2 in this report). The half-antibody was also observed in Figure 3A with higher intensities in cell line B than in cell line A. Because the two HCs associate via the CH3 domain through hydrophobic and charged interactions,35–38) in addition to the disulfide bonds in the hinge domain, exposure of the CH3 domain in the half-antibody and in the half-antibody+CH2 will enhance the association of these LMWS with other antibody molecules and serve as nuclei for aggregation. The half-antibody+CH2 (with observed Mr 88×103) may be produced by the cleavage of Asn328–Lys329 (leading to the production of a fragment with calculated molecular weight of 87×103) or Asn364–Gln365 (leading to the production of a fragment with calculated molecular weight of 91×103), which are located in the CH2 and CH3 domains, respectively, because Asn–Xaa peptide bonds are known to be susceptible to nonenzymatic cleavage.39) The cleavage of the Asp–Pro bond in the CH2 domain and the aggregation of the cleavage product have been reported.40) But the cleavage of the Asp274–Pro275 in the present antibody would not produce the fragment under non-reducing conditions due to the presence of the intra-domain disulfide bond in the CH2 domain.
In section of characterization of antibody aggregates, we described that the content of covalent aggregates was higher in cell line A than in cell line B as revealed by LDS-SEC (Fig. 2B, Table 2). This finding was confirmed by Western blotting analyses: (1) protein A-purified samples from cell line A, but not from cell line B, exhibit a HMW band of Mr extrapolated as 1.1×10⁶ under non-reducing conditions (Fig. 3A); (2) protein A-purified samples from cell line A exhibit a stronger band, than from cell line B, at an Mr of approximately 8.1×10⁴ observed by SDS-PAGE under reducing conditions (Fig. 3F), indicating the presence of a covalently bonded species that is not linked by disulfide bonds.
Table 2. Differences in the Percentages of High Molecular Weight Species (HMWS), Main Peak, and Low Molecular Weight Species (LMWS) between Regular-Size Exclusion Chromatographic (SEC) and Lithium Dodecyl Sulfate (LDS)-SEC Analysis and Fraction of Noncovalent Aggregates in High Molecular Weight Species (HMWS)
| Cell line | Batch | ∆HMWS (%) | ∆Main (%) | ∆LMWS (%) | Fraction (%) of noncovalent aggregates |
|---|
| Cell line A | Batch 1 | −1.44 | 0.55 | 0.89 | 41.60 |
| Batch 2 | −0.86 | 0.17 | 0.69 | 30.42 |
| Batch 3 | −0.64 | −0.26 | 0.91 | 23.92 |
| Average±S.D. | −1.0±0.4 | 0.2±0.4 | 0.8±0.1 | 32.0±8.9 |
| Cell line B | Batch 4 | −4.36 | 2.82 | 1.54 | 84.58 |
| Batch 5 | −4.62 | 3.17 | 1.45 | 84.24 |
| Batch 6 | −11.18 | 9.79 | 1.39 | 89.61 |
| Average±S.D. | −6.7±3.9 | 5.3±3.9 | 1.5±0.1 | 86.1±3.0 |
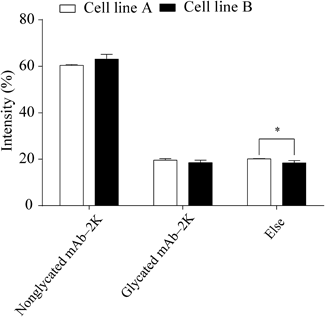
The self-association of molecules is affected by electrostatic repulsion between them,41) and many different charge variants are present within antibody molecules.42) To determine whether the high HMWS content in cell line B was due to weaker electrostatic repulsion between the antibody molecules secreted from the cells, we analyzed the cation-exchange (CEX) chromatographic behavior, deamidation, glycation rate of lysine residues, and sialic acid content of the protein A-purified antibodies secreted from the two cell lines. The charge variants separated by CEX chromatography (Figs. 6A, B), deamidation (data not shown), glycation rate of lysine residues (Fig. 7), and sialic acid content (to be reported elsewhere) did not account for the high aggregate content of cell line B.
Evaluation of the Hydrophobic Surface Area of Antibody MoleculesThe hydrophobic surface area of protein A-purified antibody molecules, a potential site of self-association, was analyzed fluorometrically using a surface hydrophobicity probe ANS.43) The fluorescence intensities, which reflect hydrophobic surface areas, were significantly lower for sample group B than for sample group A, regardless of the ANS:antibody ratio (Fig. 8). This observation suggests that the hydrophobic surface of the antibody from cell line B is masked by self-aggregation. This interpretation is in agreement with the observation that HMWS from cell line B is dissociated in the presence of LDS (Table 2).
CONCLUSION
In this study, we compared the key properties of mAb molecules (monomeric) and mAb aggregates produced by cell lines A and B with contrasting titers and qualities of secreted mAbs. We attribute the higher aggregate content and lower titer in cell line B to the lower production levels of LCs and more extensive subsequent accumulation of HC dimers/monomers in cell line B. The major mechanisms of aggregate formation were also different between the two cell lines. The aggregates from cell line A were predominantly formed by covalent interaction, whereas those from cell line B were predominantly formed by hydrophobic interactions. In addition, we found, for the first time, the presence of half-antibody+CH2 in the protein A-purified sample, which may serve as nuclei for aggregation. We hope that the present findings will be useful for improving manufacturing processes of mAbs.
Acknowledgments
We thank Risa Ogawa and Keina Yamaguchi for their help with establishing the cell lines, Mareto Hosono, Kazumi Fuju, and Kazue Sasaki for their help with sample preparation, and Jun Fukuda for helping with the molecular weight measurement of aggregates.
Conflict of Interest
Yoichi Ishii, Yasufumi Imamoto, Rie Yamamoto, and Masayoshi Tsukahara are employees of Kyowa Hakko Kirin Co., Ltd. Kaori Wakamatsu has no conflict of interest.
REFERENCES
- 1) Elvin JG, Couston RG, van der Walle CF. Therapeutic antibodies: market considerations, disease targets and bioprocessing. Int. J. Pharm., 440, 83–98 (2013).
- 2) Cromwell ME, Hilario E, Jacobson F. Protein aggregation and bioprocessing. AAPS J., 8, E572–E579 (2006).
- 3) Pan H, Chen K, Pulisic M, Apostol I, Huang G. Quantitation of soluble aggregates in recombinant monoclonal antibody cell culture by pH-gradient protein A chromatography. Anal. Biochem., 388, 273–278 (2009).
- 4) Harris RJ. Heterogeneity of recombinant antibodies: linking structure to function. Dev. Biol. (Basel), 122, 117–127 (2005).
- 5) Wang W, Singh S, Zeng DL, King K, Nema S. Antibody structure, instability, and formulation. J. Pharm. Sci., 96, 1–26 (2007).
- 6) Berkowitz SA, Engen JR, Mazzeo JR, Jones GB. Analytical tools for characterizing biopharmaceuticals and the implications for biosimilars. Nat. Rev. Drug Discov., 11, 527–540 (2012).
- 7) Tovey MG, Legrand J, Lallemand C. Overcoming immunogenicity associated with the use of biopharmaceuticals. Expert Rev. Clin. Pharmacol., 4, 623–631 (2011).
- 8) Philo JS, Arakawa T. Mechanisms of protein aggregation. Curr. Pharm. Biotechnol., 10, 348–351 (2009).
- 9) Seshadri S, Oberg KA, Uversky VN. Mechanisms and consequences of protein aggregation: the role of folding intermediates. Curr. Protein Pept. Sci., 10, 456–463 (2009).
- 10) Wang W. Protein aggregation and its inhibition in biopharmaceutics. Int. J. Pharm., 289, 1–30 (2005).
- 11) Wang W, Nema S, Teagarden D. Protein aggregation—pathways and influencing factors. Int. J. Pharm., 390, 89–99 (2010).
- 12) Gomez N, Subramanian J, Ouyang J, Nguyen MD, Hutchinson M, Sharma VK, Lin AA, Yuk IH. Culture temperature modulates aggregation of recombinant antibody in cho cells. Biotechnol. Bioeng., 109, 125–136 (2012).
- 13) Lee CJ, Seth G, Tsukuda J, Hamilton RW. A clone screening method using mRNA levels to determine specific productivity and product quality for monoclonal antibodies. Biotechnol. Bioeng., 102, 1107–1118 (2009).
- 14) Takuma S, Hirashima C, Piret JM. Dependence on glucose limitation of the pCO2 influences on CHO cell growth, metabolism and IgG production. Biotechnol. Bioeng., 97, 1479–1488 (2007).
- 15) Carpenter J, Cherney B, Lubinecki A, Ma S, Marszal E, Mire-Sluis A, Nikolai T, Novak J, Ragheb J, Simak J. Meeting report on protein particles and immunogenicity of therapeutic proteins: filling in the gaps in risk evaluation and mitigation. Biologicals, 38, 602–611 (2010).
- 16) Cordoba-Rodriguez RV. Aggregates in MAbs and Recombinant Therapeutic Proteins: A Regulatory Perspective. Biopharm. Int., 21, 44–53 (2008).
- 17) Wang W, Singh SK, Li N, Toler MR, King KR, Nema S. Immunogenicity of protein aggregates—concerns and realities. Int. J. Pharm., 431, 1–11 (2012).
- 18) Ishii Y, Murakami J, Sasaki K, Tsukahara M, Wakamatsu K. Efficient folding/assembly in Chinese hamster ovary cells is critical for high quality (low aggregate content) of secreted trastuzumab as well as for high production: stepwise multivariate regression analyses. J. Biosci. Bioeng., 118, 223–230 (2014).
- 19) Pace CN, Schmid FX. How to determine the molar absorbance coefficient of a protein. Protein structure. (Creighton TE ed.), Oxford University Press, New York, pp. 253–259 (1997).
- 20) Rozhkova A. Quantitative analysis of monoclonal antibodies by cation-exchange chromatofocusing. J. Chromatogr. A, 1216, 5989–5994 (2009).
- 21) Gadgil HS, Pipes GD, Dillon TM, Treuheit MJ, Bondarenko PV. Improving mass accuracy of high performance liquid chromatography/electrospray ionization time-of-flight mass spectrometry of intact antibodies. J. Am. Soc. Mass Spectrom., 17, 867–872 (2006).
- 22) Cordoba AJ, Shyong BJ, Breen D, Harris RJ. Non-enzymatic hinge region fragmentation of antibodies in solution. J. Chromatogr. B Analyt. Technol. Biomed. Life Sci., 818, 115–121 (2005).
- 23) Andya JD, Hsu CC, Shire SJ. Mechanisms of aggregate formation and carbohydrate excipient stabilization of lyophilized humanized monoclonal antibody formulations. AAPS PharmSci, 5, 21–31 (2003).
- 24) Cohen SL, Price C, Vlasak J. β-Elimination and peptide bond hydrolysis: two distinct mechanisms of human IgG1 hinge fragmentation upon storage. J. Am. Chem. Soc., 129, 6976–6977 (2007).
- 25) Malencik DA, Anderson SR. Dityrosine as a product of oxidative stress and fluorescent probe. Amino Acids, 25, 233–247 (2003).
- 26) Chi EY, Krishnan S, Randolph TW, Carpenter JF. Physical stability of proteins in aqueous solution: mechanism and driving forces in nonnative protein aggregation. Pharm. Res., 20, 1325–1336 (2003).
- 27) Davies S, James D. Engineering mammalian cells for recombinant monoclonal antibody production. Cell line development. (Al-Rubeai M ed.) Vol. 6, Chap. 8, the Springer, the Netherlands, pp. 153–173 (2009).
- 28) Dick LW Jr, Qiu D, Mahon D, Adamo M, Cheng KC. C-Terminal lysine variants in fully human monoclonal antibodies: investigation of test methods and possible causes. Biotechnol. Bioeng., 100, 1132–1143 (2008).
- 29) Dinnis DM, James DC. Engineering mammalian cell factories for improved recombinant monoclonal antibody production: lessons from nature? Biotechnol. Bioeng., 91, 180–189 (2005).
- 30) Jiang Z, Huang Y, Sharfstein ST. Regulation of recombinant monoclonal antibody production in chinese hamster ovary cells: a comparative study of gene copy number, mRNA level, and protein expression. Biotechnol. Prog., 22, 313–318 (2006).
- 31) Schlatter S, Stansfield SH, Dinnis DM, Racher AJ, Birch JR, James DC. On the optimal ratio of heavy to light chain genes for efficient recombinant antibody production by CHO cells. Biotechnol. Prog., 21, 122–133 (2005).
- 32) Strutzenberger K, Borth N, Kunert R, Steinfellner W, Katinger H. Changes during subclone development and ageing of human antibody-producing recombinant CHO cells. J. Biotechnol., 69, 215–226 (1999).
- 33) Bhoskar P, Belongia B, Smith R, Yoon S, Carter T, Xu J. Free light chain content in culture media reflects recombinant monoclonal antibody productivity and quality. Biotechnol. Prog., 29, 1131–1139 (2013).
- 34) Ho SC, Koh EY, van Beers M, Mueller M, Wan C, Teo G, Song Z, Tong YW, Bardor M, Yang Y. Control of IgG LC : HC ratio in stably transfected CHO cells and study of the impact on expression, aggregation, glycosylation and conformational stability. J. Biotechnol., 165, 157–166 (2013).
- 35) Brinda KV, Kannan N, Vishveshwara S. Analysis of homodimeric protein interfaces by graph-spectral methods. Protein Eng., 15, 265–277 (2002).
- 36) Dall’Acqua W, Simon AL, Mulkerrin MG, Carter P. Contribution of domain interface residues to the stability of antibody CH3 domain homodimers. Biochemistry, 37, 9266–9273 (1998).
- 37) Diaz MAAA, Padlan EA, Santos AD. Effects of engineering charged amino acids in the CH3 domains on antibody heavy chain dimerization. Philipin Science Letter, 4, 48–55 (2011).
- 38) Huber R, Deisenhofer J, Colman PM, Matsushima M, Palm W. Crystallographic structure studies of an IgG molecule and an Fc fragment. Nature, 264, 415–420 (1976).
- 39) Vlasak J, Ionescu R. Fragmentation of monoclonal antibodies. MAbs, 3, 253–263 (2011).
- 40) Kameoka D, Ueda T, Imoto T. Effect of the conformational stability of the CH2 domain on the aggregation and peptide cleavage of a humanized IgG. Appl. Biochem. Biotechnol., 164, 642–654 (2011).
- 41) Goswami S, Wang W, Arakawa T, Ohtake S. Developments and challenges for mab-based therapeutics. Antibodies, 2, 452–500 (2013).
- 42) Vlasak J, Ionescu R. Heterogeneity of monoclonal antibodies revealed by charge-sensitive methods. Curr. Pharm. Biotechnol., 9, 468–481 (2008).
- 43) Rispens T, Lakemond CM, Derksen NI, Aalberse RC. Detection of conformational changes in immunoglobulin G using isothermal titration calorimetry with low-molecular-weight probes. Anal. Biochem., 380, 303–309 (2008).