Abstract
Numerous people die of paraquat (PQ) poisoning every year in the world. Although several studies regarding paraquat (PQ) poisoning have been conducted, the metabolic changes in plasma remain unknown. In this study, the metabolomics of 15 PQ poisoned patients with plasma PQ concentrations in excess of 0.1 µg/mL and 16 healthy volunteers were investigated. The plasma samples were evaluated through the use of gas chromatography-mass spectrometry (GC/MS) and analyzed by partial least-squares discriminant analysis (PLS-DA). Based on the metabolomics data, a support vector machine (SVM) discrimination model was developed. The results showed the plasma levels of urea, glucose oxime and L-phenylalanine decreased and cholesterol increased in PQ poisoned patients in comparison to healthy volunteers. The SVM discrimination model was developed, and performed with a high degree of accuracy, to distinguish PQ poisoned patients from healthy volunteers. In conclusion, metabolic pathways including the urea cycle, and amino acid, glucose, and cholesterol metabolism were impaired after PQ poisoning. An SVM discrimination model, based on metabolomics data, was established and may become a new powerful tool for the diagnosis of PQ poisoning.
Paraquat (PQ) is a quick acting, non-selective quartenary nitrogen herbicide, which is widely used in the world for weed control. Although paraquat is safe for routine agricultural use, PQ is exceedingly toxic to human. For the human population the toxic dose is very low and acute ingestion of 7–8 mL is lethal.1) Worldwide, thousands of people died of PQ poisoning every year. In Korea, PQ accounts for the highest number of fatal poisonings and is responsible for more than with 500 deaths per year.2)
Suicides and murder account for the large majority of PQ poisonings, because it is fatal and widely available at low cost.3) Due to the number of fatalities resulting from PQ poisoning in developing countries, the study of the PQ has been a hot topic for medical researchers. To date, various studies about PQ poisoning have been conducted. Some studies have evaluated the detection and toxicokinetics of PQ in humans,4–8) while others have evaluated the effects of the treatment such as early hemoperfusion in PQ poisoned patients.9–11)
The study on toxic mechanism revealed that PQ is concentrated inside the cells of multiple organs where it undergoes redox cycling. Consequently, a superoxide radical is produced which can cause direct cellular damage or react further to form other reactive oxygen species (ROS).12,13) As PQ interferes with electron transfer, a process involved in various biochemical reactions in the body, the metabolism of biotransformation and mass balance were be disturbed. However few studies have focused on the metabolic changes in PQ poisoned patients. This reported study investigated plasma metabolomics of 15 PQ poisoned patients with acute PQ intoxication by gas chromatography-mass spectrometer (GC-MS). The metabolomics data was analyzed and a discrimination model established using Support Vector Machine (SVM) algorithm, a popular artificial technique based on statistical learning theory and the theory of Vapnik–Chervonenkis dimension. The SVM model can efficiently achieve a non-linear classification by mapping inputs data into high-dimensional feature spaces. It has been shown to perform well in multiple areas of biological data analysis.14) In this study, we applied SVM to discriminate the PQ poisoned patients.
MATERIALS AND METHODS
Chemicals and ReagentsPQ (purity >98%), N-methyl-N-(trimethylsilyl) trifluoroacetamide (MSTFA) and trimethylchlorosilane (TMCS) were purchased from Sigma-Aldrich Company (St. Louis, MO, U.S.A.). Methyl-hydroxylamine hydrochloride and pyridine were purchased from Aladdin Industrial, Inc. (Shanghai, China). LC-grade acetonitrile and n-heptane were purchased from Merck Company (Darmstadt, Germany).
InstrumentsAn Agilent 1260 Infinity HPLC system equipped with an online degasser, a quaternary pump, an autosampler, a thermostated column compartment, a diode-array UV detector (DAD-UA) and controlled by ChemStation (Agilent Technologies, Atlanta, GA, U.S.A.). In addition, an Agilent 6890N gas chromatography-5975B mass spectrometer (Agilent Technologies, Atlanta, GA, U.S.A.), centrifuge (Beckman Coulter Inc., 21R, U.S.A.), and analytical balance (Mettler-Toledo International Inc., Zurich, Switzerland) were used.
SubjectsThere were 15 patients (aged from 18–64 years, 10 male, 5 female) with a history of direct contact with PQ poisoning were involved in the study. The plasma samples were collected prior to receiving any treatment such as hemoperfusion (HP) or hematodialysis (HD). A total of 16 healthy volunteers (aged from 21–61 years, 10 male, 6 female) who had no history of direct contact with PQ poisoning were chosen as control. The body mass index (BMI) were calculated and analyzed. There are no statistical differences (p>0.05) for BMI between PQ-poisoned patients (23±2.3 kg/m2) and healthy volunteers (23±2.9 kg/m2).
The study was approved by the Medical Ethics Committee of The First Affliated Hospital of Wenzhou Medical University and conducted in accordance with the Declaration of Helsinki. All individual information of PQ poisoned patients was securely protected and only available to the investigators. All data was analyzed anonymously.
HPLC Determination of PQ ConcentrationBefore GC-MS was analyzed, the plasma samples collected from PQ poisoned patients and healthy volunteers were determined by HPLC method. PQ was extracted from a 200 µL plasma sample by the addition of 100 µL trichloroacetic acid–methanol (9 : 1, v/v) to precipitate protein. The samples were separated on an Agilent Zorbax HC-C18 (2.1 mm×150 mm, 5 µm) column, detected at 258 nm wavelength by DAD-UA. The mobile phase is composed of a solution of 4% acetonitrile and 96% water which contained 20 mM sodium dihydrogen phosphate and 0.4 mM sodium heptanesulfonate with the pH was adjusted to 2.3. The precision, accuracy and stability of this HPLC method were validated at three quality-control samples in five replicates. The calibration curves were constructed in the range of 0.05–10 µg/mL to calculate the PQ concentrations. The plasma PQ concentrations of PQ poisoned patients higher than 0.1 µg/mL were exclusively involved in this study.
GC-MS Determination of PQ PoisoningPlasma Sample PreparationA sample of 100 µL of plasma was extracted with 250 µL ice-acetonitrile followed by centrifugation at 12000 rpm for 10 min. A volume of 250 µL of the supernatant was then transferred to new vials and evaporated to dryness under a stream of nitrogen (N2). For derivatization, 50 µL sample of methoxyamine (15 µg/µL) in pyridine was added to the residues and the mixture was incubated at 70°C for 1 h. Next, 50 µL of MSTFA with 1% TMCS was added to the sample and vortex mixed. After silyation for 1 h, 150 µL heptane was added.
GC-MS AcquisitionOne microliter of each derivatized sample was splitlessly injected by an Agilent 7985B auto sampler into an Agilent 6890N gas chromatography-5975B mass spectrometer equipped with a 30 m×0.25 mm i.d. fused-silica capillary column with a chemically bonded 0.25 µm DB 5 MS stationary phase (Agilent Technologies). The injector temperature was at 270°C, the gas flow rate through the column was 1 mL/min, the column temperature was held at 85°C for 5 min, then increased by 10°C/min to 300°C and held there for 5 min. The column effluent was introduced into the ion source of an Agilent mass spectrometer. The ion source temperature was at 230°C. To minimize cross-contamination between runs, the needle on the injector was washed six times with heptane prior to each injection. Ions were generated at electron impact (EI) energy of 70 eV, and 20scans/s was recorded over the mass range of 30–600 m/z. The solvent delay was 5 min.
Data Processing and Multivariate Pattern RecognitionThe components recognized were then subjected to the NIST library searching. The component was identified with match factor larger than 80%.15) Subsequently, the endogenous metabolites were selected to construct the plasma metabolomics profile of each sample. Other metabolites from reagents and drugs were excluded.
The normalized values were imported as variables into SIMCA-P+ 12.0 software (Umetrics, Umea, Sweden) and then mean-centered and pareto-scaled prior to multivariate data analysis. A supervised multivariate approach, termed partial least-squares discriminate analysis (PLS-DA), were used to visually discriminate between the PQ poisoned patients group and the healthy volunteers group. Data was visualized using the scores plot of the two principal components (PC1 and PC2), in which each point represented an individual spectrum of a sample. The metabolites associated with the group separations were indicated by the corresponding loading plots, in which each point stood for a metabolite,16) and were used to identify which metabolite contributed to the separation of the samples on the scores plot.17,18)
The quality of the PLS-DA models was indicated by three parameters (R2X, R2Y, and Q2Y), which were calculated by the default leave-one-out procedure. R2X and R2Y were used to quantify the goodness of fit and Q2Y was employed to assess the predictability of the model.19–21)
SVM DiscriminationSVM is a supervised machine learning algorithm, which can be used to solve nonlinear classification and regression problems. SVM allows the mapping of the sample vectors into a nonlinear, high dimensional feature space, in which the samples can be separated by an optimal hyperplane.22,23) The greater the distance between these parallel hyperplanes, the smaller generalization error of the classifier will be.
Let (xi; yi) be a set of target data to be trained, where i=1, 2, ... , n, xi∈Rd is an input vector, yi is corresponding desired output, a constant denoting the class to which that point xi belongs. In this study, the healthy volunteers defined as 1 and PQ poisoned patients defined as 2, n is the number of training data, and d denotes the number of dimensions of input data that is the metabolites in plasma.
The similarity function between pairs of samples is called a kernel. In SVM, a kernel function implicitly maps samples to a feature space given by a feature mapping.24) The Gaussian radial basis function kernel (RBF) is a popular kernel function used in SVM classification. It can be expressed as:
Here
g is a kernel parameter. As the SVM model based on the RBF kernel, two parameters,
c and
g, should be carefully tuned to the problem at hand. If the factor
c is too large, a large penalty will be assigned to non-separable points which leads to store too many support vectors and thus over fit. On the other hand, if
c is too small, an under fitting can occur. The
g parameter specifies the radius of the RBF, which also exerting a strong impact on model performance.
25) We used the genetic algorithm to optimize the SVM parameters,
c and
g, which uses random mutation, crossover and selection procedures to generate better models or solutions from an originally random starting sample. The 10-fold cross-validation procedure was carried out for the training set during the optimization of SVM parameters,
c and
g. The SVM model of PQ was developed by LibSVM package in MATLAB 2011a.
Statistical AnalysisStatistical analysis was carried out using the SPSS software (Version16.0, SPSS). In order to detect significant differences between the two groups, Independent samples test-test was applied to compare the mean concentration of all metabolites. A p-value of <0.05 was considered statistically significant.
RESULTS AND DISCUSSION
PQ Concentrations of SubjectsThere was no interfering endogenous substance observed at the retention time of the PQ. The calibration curve had a good linear regressions in the range 0.05–10 µg/mL (R>0.9992) and RSD of precision, accuracy and stability were all less than 15%. The developed HPLC method was applied in order to determine PQ concentration. The results showed the plasma PQ concentrations of the 15 PQ poisoned patients were all higher than 0.1 µg/mL. In addition, there was no PQ detected in plasma of healthy volunteers.
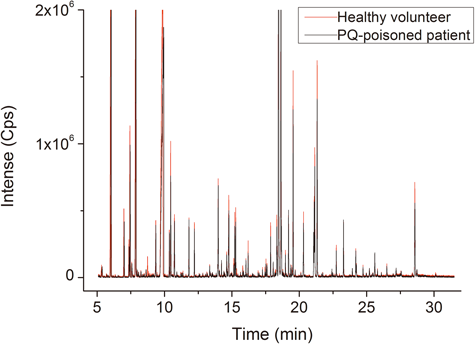
Analytical Characteristics of Global Profiling MethodsRepresentative GC-MS spectra of the plasma samples obtained from PQ poisoned patients are shown in Fig. 1. The mass spectra of the metabolites were identified according to the NIST mass spectrometry database. Compared with the healthy volunteers, the alterations of the plasma profiles of the PQ poisoned patients were apparent in the GC-MS spectra by visual examination.
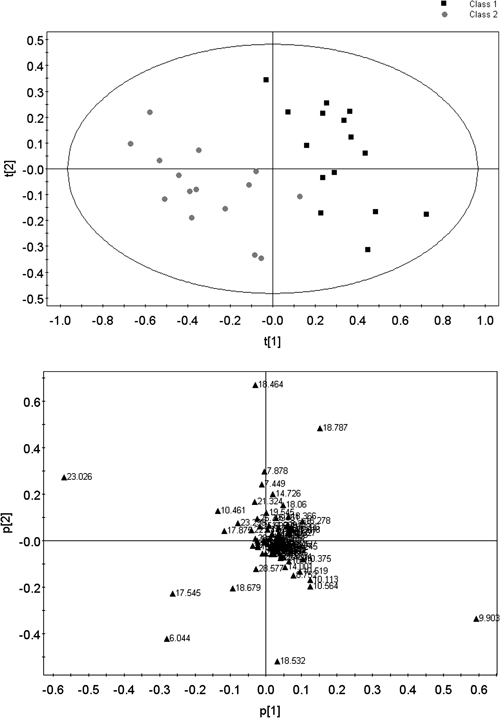
In order to evaluate the metabolic profile changes of PQ poisoned patients, we compared the GC-MS spectrum of PLS-DA (R2X=0.238, R2Y=0.835, Q2Y=0.508) of each plasma samples from PQ poisoned patients (n=15) and the healthy volunteers (n=16) (Fig. 2). The PLS-DA scores plot of the first and second principal components (t[1] and t[2]) showed that PQ poisoned patients were clearly separated from healthy volunteers in the direction of t[1] (Fig. 2A), which demonstrated that spectral characteristics of the two groups were markedly different. The loading plot of the first two principal components showed that urea, 1 h-indole-2-carboxylic acid, ethane, glucose oxime, cholesterol, 2,5-diacetyl-terephthalic acid and L-phenylalanine were among the major contributors to the separation (Fig. 2B).
Changes in Metabolite ProfilesThe changes of metabolites between two groups are shown in Table 1, and identified by two methods to study potential biomarkers. One method to study potential biomarkers involved the use of variable importance in the projection (VIP) which was acquired from the PLS-DA model with a threshold of 1.0; The second method to study potential biomarkers incorporated the use of p-values which were calculated from two-tailed Student’s t-test. Compared to the healthy volunteers, the level of 1 h-indole-2-carboxylic acid, ethane and cholesterol in the plasma of PQ poisoned patients increased, whereas the level of urea, glucose oxime, 2,5-diacetyl-terephthalic acid and L-phenylalanine decreased.
Table 1. Metabolites in Plasma of PQ Poisoned Patients and Healthy Volunteers
| No. | RT | Metabolite | VIPa) | p | PQ vs. Healthy | Metabolic pathways |
|---|
| 1 | 9.903 | Urea | 4.72 | 0.001 | ↓** | Urea cycle |
| 2 | 23.026 | 1H-Indole-2-carboxylic acid | 4.37 | 0.008 | ↑** | Amino acid metabolism |
| 3 | 6.044 | Butanoic acid | 2.78 | 0.021 | ↑* | Amino acid metabolism |
| 4 | 17.545 | L-Ornithine | 2.26 | — | — | — |
| 5 | 18.787 | Ribitol | 1.54 | — | — | — |
| 6 | 18.366 | Glucose oxime | 1.53 | 0.023 | ↓* | Glucose metabolism |
| 7 | 18.679 | L-Tyrosine | 1.47 | — | — | — |
| 8 | 8.263 | Butanoic acid | 1.38 | — | — | — |
| 9 | 14.726 | 1-Methyl-2-pyrrolidinone | 1.29 | — | — | — |
| 10 | 28.577 | Cholesterol | 1.23 | 0.032 | ↑* | Cholesterolmetabolism |
| 11 | 18.06 | 2,5-Diacetyl-terephthalic acid | 1.15 | 0.000 | ↓** | Amino acid metabolism |
| 12 | 10.461 | Glycerol | 1.05 | — | — | — |
| 13 | 15.278 | L-Phenylalanine | 1.02 | 0.000 | ↓** | Amino acid metabolism |
| 14 | 18.532 | D-Glucose | 1.01 | — | — | — |
a) Variable importance in the projection (VIP) was acquired from the PLS-DA model with a threshold of 1.0. Marks indicate the direction of the change, i.e., ↓ for decrease, ↑ for increase, — for no change. * p<0.05 and ** p<0.01, as indicated by the statistical analysis t-test.
According to results acquired from the PLS-DA model, the interfered metabolism of the urea cycle was the major change. During a urea cycle, there are four biochemical reactions which produce some intermediates such as L-ornithine, citrulline, L-argininosuccinate, and L-arginine. The first of two biochemical steps reacted in mitochondria, and last two biochemical steps were in cytoplasm. As there was no intermediates, such as L-ornithine (Table 1), increased in PQ poisoned patient when the level of urea was decreased, we can infer that the interference might occur in mitochondria. Due to the biochemical reaction in mitochondria is energy-consuming, it needs energy from ATP.
Other substances that are abnormally increased or decreased, like glucose oxime and cholesterol, indicate there was energy metabolism dysfunction after PQ poisoning. Each of these metabolic changes also made it easier to distinguish PQ poisoned patients from healthy subjects.
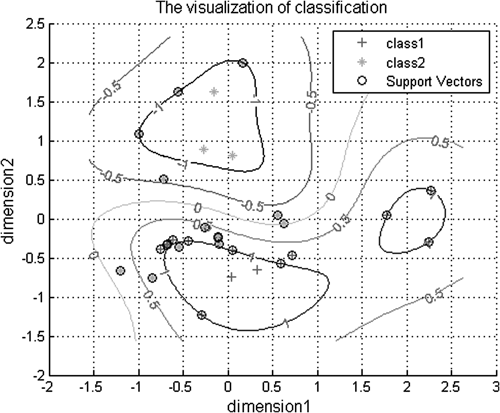
SVM Model of DiscriminationAccording to retention time (RT) and mass spectra data, there was a total of 119 peaks detected in plasma samples by GS-MS method within 30 min. The PQ poisoned patients and healthy subjects were all represented as a 119-dimensional feature vector and the corresponding outcome is coded as either 1 (healthy control) or 2 (PQ poisoned patient). The data was then normalized by scaling them into the interval of [−2, 2.5] according to parameter premnmx. The 119-dimensional feature vector was employed into SVM model and the optimization results showed that the SVM model has classification accuracy of 100% for the training set based on c=64 and g=0.125. In the case of the dimensionality of training data sets being reduced to two dimensions, the classification accuracy of the SVM model still has a classification accuracy of 93.5484% for the training set based on c=1024 and g=512. The visualization of the two-dimension SVM model was showed in Fig. 3.
Figure 3 indicates the developed SVM model can be applied to distinguish the PQ poisoned patients from healthy person. This concept is very useful in clinical practice. In the absence of a clear history of PQ contact, PQ poisoning is difficult diagnose because the clinical manifestations of PQ poisoning were not specific. In the future, the SVM distinguished method might serve as a new candidate of powerful tools for diagnosis of PQ poisoned patients.
CONCLUSION
A GC-MS based metabolomics approach was applied to assess the metabolite changes in human plasma following PQ poisoning. We observed impaired metabolic pathways including urea cycle, amino acid metabolism, glucose metabolism and cholesterol metabolism in the PQ poisoned group. An SVM discrimination model was established based on the metabolomics data, which performed with high classification accuracy and could be a new powerful tool for diagnosis of PQ poisoning.
Acknowledgments
This work was supported by fund of the key construction academic subject (medical innovation) of Zhejiang Province (11-CX26), National Natural Science Foundation of China, No. 81401558; Zhejiang Provincial Natural Science Foundation of China, No. LY14H230001; Science and Technology Committee of Shanghai Municipality, China, No. KF1405.
Conflict of Interest
The authors declare no conflict of interest.
REFERENCES
- 1) Yoshioka T, Sugimoto T, Kinoshita N, Shimazu T, Hiraide A, Kuwagata Y. Effects of concentration reduction and partial replacement of paraquat by diquat on human toxicity: a clinical survey. Hum. Exp. Toxicol., 11, 241–245 (1992).
- 2) Koo JR, Kim JC, Yoon JW, Kim GH, Jeon RW, Kim HJ, Chae DW, Noh JW. Failure of continuous venovenous hemofiltration to prevent death in paraquat poisoning. Am. J. Kidney Dis., 39, 55–59 (2002).
- 3) Yoon SC. Clinical outcome of paraquat poisoning. Korean J. Intern. Med., 24, 93–94 (2009).
- 4) Zou Y, Shi Y, Bai Y, Tang J, Chen Y, Wang L. An improved approach for extraction and high-performance liquid chromatography analysis of paraquat in human plasma. J. Chromatogr. B Analyt. Technol. Biomed. Life Sci., 879, 1809–1812 (2011).
- 5) Brunetto MR, Morales AR, Gallignani M, Burguera JL, Burguera M. Determination of paraquat in human blood plasma using reversed-phase ion-pair high-performance liquid chromatography with direct sample injection. Talanta, 59, 913–921 (2003).
- 6) Moreira PN, de Pinho PG, Baltazar MT, Bastos ML, Carvalho F, Dinis-Oliveira RJ. Quantification of paraquat in postmortem samples by gas chromatography-ion trap mass spectrometry and review of the literature. Biomed. Chromatogr., 26, 338–349 (2012).
- 7) Lohmann J, Pott G, Zidek W, Bertram HP. Plasma fibronectin in man after a severe paraquat intoxication. Arch. Toxicol. Suppl., 5, 295–297 (1982).
- 8) Houzé P, Baud FJ, Mouy R, Bismuth C, Bourdon R, Scherrmann JM. Toxicokinetics of paraquat in humans. Hum. Exp. Toxicol., 9, 5–12 (1990).
- 9) Liu P, He YZ, Zhang XG, Li G, Wang HC, Lu XX, Zhang CG, Meng QY. Studying the therapeutic effects of hemoperfusion with continuous venovenous hemofiltration on the patients with acute paraquat poisoning. Zhonghua Lao Dong Wei Sheng Zhi Ye Bing Za Zhi, 29, 266–269 (2011).
- 10) Lai DP, Chen GQ. Hemoperfusion for treatment of one case of acute paraquat poisoning. Zhonghua Lao Dong Wei Sheng Zhi Ye Bing Za Zhi, 28, 306 (2010).
- 11) Wu WP, Lai MN, Lin CH, Li YF, Lin CY, Wu MJ. Addition of immunosuppressive treatment to hemoperfusion is associated with improved survival after paraquat poisoning: a nationwide study. PLoS ONE, 9, e87568 (2014).
- 12) Jimenez Del Rio M, Velez-Pardo C. Paraquat induces apoptosis in human lymphocytes: protective and rescue effects of glucose, cannabinoids and insulin-like growth factor-1. Growth Factors, 26, 49–60 (2008).
- 13) Chang X, Lu W, Dou T, Wang X, Lou D, Sun X, Zhou Z. Paraquat inhibits cell viability via enhanced oxidative stress and apoptosis in human neural progenitor cells. Chem. Biol. Interact., 206, 248–255 (2013).
- 14) Muthukrishnan S, Puri M, Lefevre C. Support vector machine (SVM) based multiclass prediction with basic statistical analysis of plasminogen activators. BMC Res. Notes, 7, 1–10 (2014).
- 15) Waterman D, Horsfield B, Leistner F, Hall K, Smith S. Quantification of polycyclic aromatic hydrocarbons in the NIST standard reference material (SRM1649A) urban dust using thermal desorption GC/MS. Anal. Chem., 72, 3563–3567 (2000).
- 16) Guan M, Xie L, Diao C, Wang N, Hu W, Zheng Y, Jin L, Yan Z, Gao H. Systemic perturbations of key metabolites in diabetic rats during the evolution of diabetes studied by urine metabonomics. PLoS ONE, 8, e60409 (2013).
- 17) Craig A, Cloarec O, Holmes E, Nicholson JK, Lindon JC. Scaling and normalization effects in NMR spectroscopic metabonomic data sets. Anal. Chem., 78, 2262–2267 (2006).
- 18) Sublette ME, Galfalvy HC, Fuchs D, Lapidus M, Grunebaum MF, Oquendo MA, Mann JJ, Postolache TT. Plasma kynurenine levels are elevated in suicide attempters with major depressive disorder. Brain Behav. Immun., 25, 1272–1278 (2011).
- 19) Gowda GA, Zhang S, Gu H, Asiago V, Shanaiah N, Raftery D. Metabolomics-based methods for early disease diagnostics. Expert Rev. Mol. Diagn., 8, 617–633 (2008).
- 20) Hamilton M. A rating scale for depression. J. Neurol. Neurosurg. Psychiatry, 23, 56–62 (1960).
- 21) Montgomery SA, Asberg M. A new depression scale designed to be sensitive to change. Br. J. Psychiatry, 134, 382–389 (1979).
- 22) Meng J, Shi L, Luan Y. Plant microRNA–target interaction identification model based on the integration of prediction tools and support vector machine. PLoS ONE, 9, e103181 (2014).
- 23) Liu ZB, Wang ZB, Zhao WJ. Automatic classification method of star spectra data based on manifold-based discriminant anaysis and support vector machine. Guang Pu Xue Yu Guang Pu Fen Xi, 34, 263–266 (2014).
- 24) Tachibana RO, Oosugi N, Okanoya K. Semi-automatic classification of birdsong elements using a linear support vector machine. PLoS ONE, 9, e92584 (2014).
- 25) Yu X, Yu Y, Zeng Q. Support vector machine classification of streptavidin-binding aptamers. PLoS ONE, 9, e99964 (2014).