Abstract
The accumulation of amyloid β1–42 peptide (Aβ1–42) in retina is implicated in the development of retinal ganglion cell apoptosis and diabetic retinopathy. In this study we demonstrate that spontaneous diabetes mellitus Otsuka Long-Evans Tokushima Fatty (OLETF) rats can be used as an animal model in studies to identify the expression of Aβ in diabetic retinas. In addition, we investigated the relation between glucose level and Aβ production in the retinas of OLETF rats. In the retinas of Long-Evans Tokushima Otsuka (LETO) rats used as normal controls and OLETF rats, no expression of neprilysin (NEP), which degrades Aβ, was detected, and the expression levels of genes associated with Aβ production (amyloid precursor protein, β site APP cleaving enzyme, and presenilin) and Aβ1–42 levels in the retinas of 60-week-old OLETF rats with diabetes mellitus were significantly higher than in 60-week-old LETO rat retinas. Furthermore, the increase in the expression levels of genes associated with Aβ production was enhanced by administration of glucose (3.0 g/kg; OGT test), and close relations between the retinal Aβ1–42 level and plasma blood glucose and HbA1c were observed. In conclusion, we have found that Aβ accumulates easily in the retinas of LETO and OLETF rats due to the absence of NEP. In addition, we determined that the accumulation of Aβ1–42 in the retinas of OLETF rats is promoted by high plasma glucose levels. Therefore OLETF rats may be a suitable model for studies to identify the expression of Aβ in diabetic retinas.
Amyloid β peptides (Aβ) vary in length from 39 to 43 amino acid residues, and are produced by the sequential proteolytic processing of the amyloid precursor protein (APP) by β-secretase (β site APP cleaving enzyme, called BACE1)1) and γ-secretase (a presenilin complex, PS1 and PS2).2) BACE1 is a membrane-bound aspartic protease that is the rate-limiting enzyme in Aβ production from APP. APP can be cleaved by α-secretase within the Aβ domain to generate non-amyloidogenic soluble APPα. The disintegrin and metalloprotease domain protease 10 (ADAM10) is the major protease involved in the α-cleavage of APP.3–5) Under physiological conditions, Aβ is degraded by peptidases such as neprilysin (NEP),6) damage-induced neuronal endopeptidase (DINE)7) and endothelin converting enzyme (ECE)8) immediately after production.9) On the other hand, Hara et al.10,11) have recently reported that Aβ is associated with the development of diabetic retinopathy in humans. Furthermore, Ning et al.12) have reported that enhanced Aβ levels in the retina cause neurodegeneration in a double mutant transgenic mouse model of Alzheimer’s disease. However, the factors and mechanisms for the enhancement and accumulation of Aβ in the retina in diabetes mellitus remain obscure.
In studies to identify the relationship between the retinopathy and diabetic mellitus, the selection of the experimental animal is very important. Animal models used to investigate diabetes mellitus include streptozotocin-induced diabetic rats and galactose fed rats as models for insulin-dependent diabetes mellitus.13–17) Hyperglycemia is present in streptozotocin-induced diabetic rats, which represents an insulin-dependent diabetes mellitus model, while hyperglycemia is not present in galactose fed rats. The general pathophysiology of these models differs from that of non-insulin-dependent diabetes mellitus in humans.
The Otsuka Long-Evans Tokushima Fatty (OLETF) rat is an established model of human diabetes mellitus developed via a metabolic syndrome.18) Nearly 100% of male OLETF rats develop spontaneous diabetic syndrome. Hyperglycemia and hyperinsulinemia are exhibited in the early phases of the disease as a result of islet cell hyperplasia and peripheral insulin resistance, and OLETF rats are used as a model of human type 2 diabetes mellitus.18–22) With continued aging, the rats eventually develop hypoinsulinemia as a result of the deterioration of islet beta cells,21,22) and plasma insulin levels in OLETF rats over 60 weeks of age are lower than in Long-Evans Tokushima Otsuka (LETO) rats of the corresponding age used as normal controls.23,24) On the other hand, GK (Goto–Kakizaki) rats and high-fat diet-induced obese rats were also known the a model for type 2 diabetes mellitus.25) The general pathophysiology of GK rats is similar, GK rats develop type 2 diabetes mellitus without metabolic syndrome. The high-fat diet-induced obese rat is suitable animal model to for studies related to elucidate the relationships of metabolic syndrome and type 2 diabetes mellitus. However, the degree of hyperglycemia and insulin resistance in high-fat diet-induced obese rats is lower than that in OLETF rats, and it is difficult to observe the onset of ocular diabetic complications.26–28) Miyamura et al.26) have demonstrated the usefulness of the OLETF rat as the model of diabetic retinal disease. In the retinal capillaries of 56-week-old OLETF rats, basement membranes are significantly thicker, and the ratio of the pericyte area to the capillary cross-section area is significantly lower than in controls. The endothelial cell cytoplasm degenerates, and the vascular corrosion cast of a 56-week-old OLETF rat shows caliber irregularity, narrowing, tortuosity and loop formations of the capillaries. Furthermore, electroretinograms (ERG) are similar to those seen in diabetic patients.27,28) The changes in the biological characteristics of OLETF rats show them to be a useful animal model for the study of ocular diabetic complications in humans, and OLETF rats may provide a better model than streptozotocin-induced diabetic rats, galactose fed rats, GK rats or high-fat diet-induced obese rats for studies to clarify the expression of Aβ in the diabetic retina. In this study, we demonstrate that spontaneous diabetes mellitus OLETF rats can be used as a model animal to identify the expression of Aβ in diabetic retinas. In addition, we investigated the relationship between glucose level and Aβ production in the retinas of OLETF rats.
MATERIALS AND METHODS
AnimalsMale Wistar, Sprague-Dawley (SD), Dark Agouti (DA), Lewis, LETO and OLETF rats were used in this study. Wistar and SD rats were obtained from Kiwa Laboratory Animals Co., Ltd. (Wakayama, Japan). DA and Lewis rats were provided by Shimizu Laboratory Supplies Co., Ltd. (Kyoto, Japan). LETO and OLETF rats were obtained from Otsuka Pharmaceutical Co., Ltd. (Tokyo, Japan). All rats were housed under standard conditions (12 h/d fluorescent light (07:00–19:00), 25°C room temperature) with free access to a commercial diet (CE-2, Clea Japan Inc., Tokyo, Japan) and water. All procedures were performed in accordance with the guidelines of the Kinki University Faculty of Pharmacy Committee for the Care and Use of Laboratory Animals and the Association for Research in Vision and Ophthalmology resolution on the use of animals in research.
RNA PreparationTotal RNAs were extracted from the retinas of Wistar, SD, DA, Lewis, LETO and OLETF rats by the acid guanidium thiocyanate–phenol–chloroform extraction method29) using Trizol reagent (Life Technologies Inc., Rockville, U.S.A.). The purity and concentrations of RNA were determined spectrophotometrically. The OD260/OD280 values of all RNAs used were greater than 1.8, which indicates low protein contamination and high RNA purity.
Semi-quantitative Reverse Transcriptase-PCR (RT-PCR)The RT reaction was performed using an RNA PCR Kit (AMV Ver 3.0, TaKaRa Bio Inc., Shiga, Japan). One microgram of total RNA was mixed with 3 µL of 10 mM Tris–HCl buffer (pH 8.3) containing 5 mM MgCl2 and 50 mM KCl. The following components were then added to give a final volume of 10 µL: 1 unit/µL RNase inhibitor, 10 mM deoxynucleotide triphosphate, 2.5 units/µL reverse transcriptase, and 0.125 µM oligo dT-adaptor primer. The RT reaction was performed at 42°C for 15 min, followed by 5 min at 95°C. The PCR reactions were performed by adding 10 µL of cDNA to 40 µL of the reaction mixture containing 3.125 mM MgCl2, 12.5 mM Tris–HCl, pH 8.3, 1.563 units of Taq DNA polymerase and 25 pmol NEP-, DINE-, ECE-1, or glyceraldehyde-3-phosophate dehydrogenase (GAPDH)-specific primers. The specific primers were: 5′-GAG ACC TCG TTG ACT GGT GGA CTC A-3′ and 5′-TGA GTT CTT GCG GCA ATG AAA GGC A-3′ for NEP; 5′-AAT TCC TCA AAC TGG GAC ACG CTA CC-3′ and 5′-TGT CTG TCA AGA AGA TCC GAC AGG AGG-3′ for DINE; 5′-AGA ACA TAG CCA GCG AGA TCA TCC TG-3′ and 5′-TGC TGT ACC ATG CAC TCG GTC TGC TG-3′ for ECE-1; and 5′-GGT GCT GAG TAT GTC GTG GAG TCT AC-3′ and 5′-CAT GTA GGC CAT GAG GTC CAC CAC C-3′ for GAPDH. The conditions for PCR were: 94°C for 2 min, 50 cycles of 94°C for 30 s (denaturing), 75°C for 45 s (annealing), and 72°C for 1 min (extension), and a final extension at 72°C for 10 min. The PCR products were separated in 1.5% agarose gels, visualized by staining with ethidium bromide, and then photographed with an ImageMaster-CL (Amersham Biosciences Corp., Piscataway, NJ, U.S.A.).
Quantitative Real-Time RT-PCRThe composition and conditions of the RT reaction were the same as those described for the semi-quantitative RT-PCR method. The PCR reactions were performed using LightCycler FastStart DNA Master SYBR Green I according to the manufacturer’s instructions (Roche Diagnostics Applied Science, Mannheim, Germany). Briefly, 2 µL of cDNA was mixed with 2 µL of reaction mixture, LightCycler FastStart DNA Master SYBR Green I Reaction Mix, containing FastStart Taq DNA Polymerase, reaction buffer, MgCl2, SYBR Green I dye, and deoxynucleotide triphosphate mix. The following components were then added to give a final volume of 20 µL: 10 pmol specific primers for APP, ADAM10, BACE1, PS1, PS2 or glyceraldehyde-3-phosophate dehydrogenase (GAPDH). The primers used are summarized in Table 1, and the conditions for PCR are shown in Table 2.30–32) The quantities of PCR products were measured fluorometrically in a real-time manner using a LightCycler DX 400 (Roche Diagnostics Applied Science). After the completion of the PCR reactions, dissociation curves of the PCR products were generated using the LightCycler Software Version 4.0 program to detect nonspecific amplification, including primer-dimers, and to ascertain the quality of the amplification data. The differences in the threshold cycles for GAPDH and other groups (APP, ADAM10, BACE1, PS1 and PS2) were used to calculate the levels of mRNA expression in these rats.33)
Table 1. Sequences of Primers Used for Quantitative RT-PCR Analysis
| Primer | Sequence (5′→3′) |
|---|
| APP | FOR | GGATGCGGAGTTCGGACATG |
| REV | GTTCTGCATCTGCTCAAAG |
| ADAM10 | FOR | GCACCTGTGCCAGCTCTGAT |
| REV | TCCGACCATTGAACTGCTTGT |
| BACE1 | FOR | CATTGCTGCCATCACTGAAT |
| REV | CAGTGCCTCAGTCTGGTTGA |
| PS1 | FOR | CATTCACAGAAGACACCGAGA |
| REV | TCCAGATCAGGAGTGCAACC |
| PS2 | FOR | CTTCACCGAGGACACACCCT |
| REV | GACAGCCAGGAACAGTGTGG |
| GAPDH | FOR | ACGGCACAGTCAAGGCTGAGA |
| REV | CGCTCCTGGAAGATGGTGAT |
Table 2. Parameters Used for Quantitative RT-PCR Analysis
| Primer | Hot start (10 min) | Denaturation (10 s) | Annealing (10 s) | Extension (5 s) |
|---|
| APP | 95°C | 95°C | 63°C | 72°C |
| ADAM10 | 95°C | 95°C | 63°C | 72°C |
| BACE1 | 95°C | 95°C | 63°C | 72°C |
| PS1 | 95°C | 95°C | 63°C | 72°C |
| PS2 | 95°C | 95°C | 63°C | 72°C |
| GAPDH | 95°C | 95°C | 60°C | 72°C |
Wistar, SD, DA, Lewis, LETO and OLETF rats were euthanized by injection of a lethal dose of pentobarbital sodium, and the eyes were removed. The isolated retinas were homogenized in 130 µL 0.01 mol/L phosphate buffered saline (PBS), and sonicated with an ultrasonic cell disrupter (W-113MKII, HONDA ELECTRONICS Co., Ltd., Aichi, Japan) to further break the cell membranes. The homogenates were centrifuged at 5000×g for 5 min at 4°C, and the supernatant was used to measurement of NEP protein. The NEP levels were measured using an enzyme-linked immunosorbent assay (ELISA) Kit for Neprilysin according to the manufacturer’s instructions (Uscn Life Science Inc., Wuhan, China). Briefly, antibodies specific for rat NEP were pre-coated onto microplates; standards and samples were pipetted into the wells; and the microplates were incubated at 37°C for 2 h. After that, the biotin-antibody was added to each well, and were incubated at 37°C for 1 h. The wells were then washed to remove unbound materials, after which horse-radish peroxidase (HRP)-conjugated antibody solutions and, finally, substrates were added to the wells. The enzyme reactions yielded blue products that turned yellow when the stop solution was added. The absorbance at 450 nm was measured with a microplate reader (BIO-RAD, CA, U.S.A.). The detection range for NEP was 7.8–500 pg/mL, and NEP levels below this range are shown as not detected (N.D.) in this study.
Measurement of Aβ1–42 LevelsWistar, SD, DA, Lewis, LETO and OLETF rats were euthanized by injection of a lethal dose of pentobarbital sodium, and the eyes were removed. The isolated retinas were homogenized in 100–500 µL iethylamine solution (0.2% diethylamine and 50 mM NaCl), and centrifuged at 100000×g for 1 h at 4°C. The pellets were dissolved in guanidine hydrochloride (Gu-HCl) solution (5 M Gu-HCl in 50 mM Tris-buffered saline, pH 8), and used for the measurement of soluble and insoluble amyloid β1–42 (Aβ1–42).34,35) The Aβ1–42 levels were measured using a Rat β Amyloid (42) ELISA Kit according to the manufacturer’s instructions (Wako Pure Chemical Industries, Ltd., Osaka, Japan). Briefly, monoclonal antibodies specific for rat Aβ1–42 were pre-coated onto microplates; standards and samples were pipetted into the wells; and the microplates were incubated at 4°C for 15 h. The wells were then washed to remove unbound materials, after which HRP-conjugated antibody solutions and, finally, substrates were added to the wells. The enzyme reactions yielded blue products that turned yellow when the stop solution was added. The absorbance at 450 nm was measured with a microplate reader (BIO-RAD). The detection range for Aβ1–42 was 0.1–20 pmol/mL, and Aβ1–42 levels below this range are shown as N.D. in this study.
Western Blot AnalysisThe eyes of the LETO and OLETF rats at 60 weeks of age were removed, and the retinas were isolated. The retinas were homogenized in 500 µL saline on ice, and centrifuged at 200×g for 10 min at 4°C. The resultant supernatants were suspended in buffer comprising 1.25 mM Tris–HCl, pH 6.8, 0.4% sodium dodecyl sulfate (SDS), 0.2% glycerol, 0.1% 2-mercaptoethanol and 0.004% bromophenol blue, and boiled for 3 min. A sample of total protein (10 µg) was separated in a 15% polyacrylamide SDS gel, and the proteins were then transferred to polyvinylidene difluoride membranes (BIO-RAD) using a semi-dry transfer cell (Trans-Blot SD Semi-Dry Electrophoretic Transfer Cell, BIO-RAD). The transfer buffer used in the system contained 25 mM Tris–HCl, 191 mM glycine, 20% methanol, and 0.0375% SDS. After transfer, nonspecific sites on the membranes were blocked with 5% non-fat dry milk in Tris-buffer (20 mM Tris–HCl, and 500 mM NaCl, pH 7.5), and the blots were probed with 0.06 mg/L rabbit anti-rat amyloid β polyclonal antibody (ROCKLAND Immunochemicals Inc., PA, U.S.A.) or with 0.07 mg/L rabbit anti-rat GAPDH polyclonal antibody (IMGENEX, CA, U.S.A.) for 2 h at room temperature. After washing with Tris-buffer containing 0.05% Tween 20, the membranes were incubated with secondary alkaline-phosphatase conjugated anti-rabbit immunoglobulin G (IgG) (1 : 7000 dilution, Promega, WI, U.S.A.) for 2 h at room temperature, washed with Tris-buffer containing 0.1% Tween 20, and incubated with a stabilized substrate for alkaline phosphatase (Promega).33,35) The anti-rat amyloid β polyclonal antibody detects the APP protein, which appears as a band at 40–50 kDa (a secondary Aβ produces no detectable signal). The band level was calculated by NIH image, and expressed as the rate in the band level for APP and GAPDH (APP/GAPDH).
Measurement of ProteinProtein levels in the retinas of Wistar, SD, DA, Lewis, LETO and OLETF rats were determined according to the method of Bradford36) using a Bio-Rad Protein Assay Kit (BIO-RAD) with bovine serum albumin as the standard.
Blood Test for Diabetes MellitusRats were fasted for 15 h, after which blood was drawn from a tail vein at a.m. 9:00 without anesthesia, and plasma glucose (Glu), triglycerides (TG), total cholesterol (Cho), insulin and HbA1c levels were measured. The Glu levels were measured using a Glucose Assay Kit according to the manufacturer’s instructions (BioVision, Inc, CA, U.S.A.), and TG levels were determined using an Accutrend GCT (Roche Diagnostics). Cho levels were measured by the cholesterol oxidase method and the Phosphotungstate-magnesium salt method using a Cholesterol E-Test Kit (Wako Pure Chemical Industries, Ltd.). Insulin levels were analyzed using an ELISA Insulin Kit according to the manufacturer’s instructions (Morinaga Institute of Biological Science Inc., Kanagawa, Japan). Briefly, monoclonal antibodies specific for rat insulin were pre-coated onto microplates, standards and samples were pipetted into the wells, and the microplates were incubated at 4°C for 2 h. After washing to remove unbound materials, rat insulin antibodies were added to the wells at room temperature for 30 min. After washing, the substrates were added. The enzyme reactions yielded blue products that turned yellow when the stop solutions were added. The absorbance was measured with a microplate reader (BIO-RAD) at 450 nm. HbA1c levels were determined by HLC-723GHbV (Tosoh Corp., Tokyo, Japan), which is a fully automated HPLC analyzer that uses a non-porous cation-exchange polymer that can separate the stable and labile Schiff fractions of HbA1c, and shows no interference by carbamylated hemoglobin. Blood samples were collected into ethylenediaminetetraacetic acid (EDTA) containing tubes from a tail vein. The eluted hemoglobin fractions are monitored at 415 nm as well as at 500 nm as a reference wavelength, and the analysis time was 2.2 min per sample. All analyses were performed according to the manufacturer’s instructions.
Oral Glucose Tolerance Test (OGT Test)LETO and OLETF rats were fasted for 15 h, and each rat was administered an oral dose (3.0 g/kg) of glucose. Blood samples were taken from the tail veins at 0 (just before glucose administration), 30, 60, 120 and 180 min, and Glu levels were determined by the Glucose Assay Kit according to the manufacturer’s instructions (BioVision, Inc., CA, U.S.A.). The rats were euthanized under deep ether anesthesia 180 min after glucose administration, and the eyes were removed for measurement of mRNA.
In Vitro Stimulation by Medium Containing High GlucoseSeven-week-old rats were euthanized with pentobarbital sodium [120 mg/kg intraperitoneally (i.p.)], and the eyes were removed, and then the retinas were isolated. The removed retinas were treated with Dulbecco’s modified Eagle’s medium (DMEM) containing 5.6 mM (normal condition) or 20 mM glucose (high glucose treatment) under humidified air containing 5% CO2 at 37°C for 24 h. The glucose levels (5.6, 20 mM) was detected following the plasma glucose levels in LETO and OLETF rats.
Statistical AnalysisAll values are represented as mean±standard error of the mean (S.E.M.). Unpaired Student’s or Aspin–Welch’s t-tests were used for statistical analysis, and multiple groups were evaluated by one-way ANOVA followed by Dunnett’s multiple comparison. p values less than 0.05 were considered significant. The number of experiments performed is given in the figure legends.
RESULTS
Expression of Aβ1–42 Levels in the Retinas of Various RatsFigure 1 shows the accumulation of Aβ1–42 in the retinas of Wistar, SD, DA, Lewis, LETO and OLETF rats at 7 weeks of age. The expression of NEP, DINE and ECE-1 mRNA or protein was observed in Wistar, SD, DA, Lewis rats, while Aβ1–42 levels were below the detection range of the ELISA method used in this study. On the other hand, while the expressions of DINE and ECE-1 were detected in the retinas of LETO and OLETF rats, no NEP expression could be confirmed by the RT-PCR method (50 cycles) and ELISA method, and Aβ1–42 accumulation in the retina was observed. Figure 2 shows the expressions of the APP, ADAM10, BACE1, PS1 and PS2 genes in the retinas of 7-week-old Wistar, SD, DA, Lewis, LETO and OLETF rats with no obvious differences observed among the rat strains.
Changes in Aβ1–42 Levels in the Retinas of OLETF Rats with or without Diabetes MellitusTable 3 shows body weight, Glu, TG, Cho, insulin and HbA1c levels in 10- and 60-week-old LETO and OLETF rats. Glu levels in 10-week-old OLETF rats were slightly higher than in 10-week-old LETO rats, while TG, Cho and insulin levels in 10-week-old OLETF rats were similar to those in 10-week-old LETO rats. These levels did not change with age in LETO rats while they increased with age in OLETF rats. In 60-week-old OLETF rats, plasma insulin levels were lower and HbA1c levels were significantly higher than in 60-week-old LETO rats. Figure 3 shows the expression levels of the APP, ADAM10, BACE1, PS1 and PS2 mRNAs in the retinas of 60-week-old LETO and OLETF rats as determined by quantitative real-time PCR and Western blot. The expression levels of mRNAs in the retinas of OLETF rats were significantly higher than those in LETO rats (Figs. 3A–E). Furthermore, a high expression of the APP protein in the retinas of 60-week-old OLETF rats was observed as compared with 60-week-old LETO rats (LETO rat, 5.9±1.3; OLETF rat, 16.1±5.7, ×10−2 APP/GAPDH, n=5, Fig. 3F). Figure 4 shows the levels of soluble (A) and insoluble (B) Aβ1–42 in the retinas of LETO and OLETF rats aged 10 and 60 weeks as determined by the ELISA method. The soluble and insoluble Aβ1–42 levels in the retinas of 10-week-old OLETF rats were similar to those in 10-week-old LETO rats. On the other hand, both soluble and insoluble Aβ1–42 levels in the retinas of 60-week-old OLETF rats were significantly higher than those in the retinas of 60-week-old LETO rats.
Table 3. Body Weights and Some Blood Test Values for Diabetes Mellitus in 10- and 60-Week-Old LETO and OLETF Rats
| 10-week-old | 60-week-old |
|---|
| LETO | OLETF | LETO | OLETF |
|---|
| Body weight (g) | 220.6±8.1 | 278.3±6.7* | 466.9±13.9 | 410.0±11.0** |
| Glu (mg/dL) | 103.8±2.9 | 124.3±5.3* | 127.3±3.2 | 249.9±20.1** |
| TG (mg/dL) | 101.6±7.6 | 114.5±10.1 | 119.8±7.6 | 337.5±6.3** |
| Cho (mg/dL) | 84.7±21.7 | 106.3±9.6 | 93.8±21.2 | 252.8±14.9** |
| Insulin (ng/dL) | 95.3±9.5 | 99.5±3.0 | 103.7±7.9 | 73.5±8.8** |
| HbA1c (%) | — | — | 2.9±0.07 | 4.3±0.24** |
TG levels were determined using an Accutrend GCT. Glu and Cho levels were measured by a Glucose Assay Kit and Cholesterol E-Test Kit, respectively. Insulin was determined using an ELISA method, and HbA1c was analyzed by HLC-723GHbV. The data are presented as means±S.E. of 8 independent rats. * p<0.05 vs. 10-week-old normal rats for each category. ** p<0.05 vs. 60-week-old normal rats for each category.
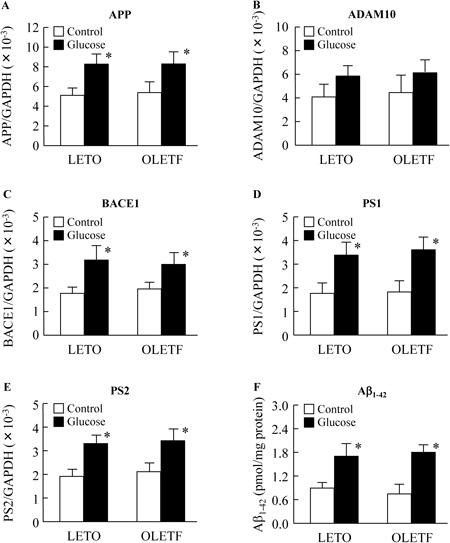
Figure 5A shows the changes in Glu levels in the OGT test. Blood Glu levels in 60-week-old LETO and OLETF rats reached a peak 30–60 min after the oral administration of glucose. The Glu levels in 60-week-old LETO rats decreased gradually, and reached pre-prandial levels 120 min after glucose. In contrast to LETO rats, the Glu levels in 60-week-old OLETF rats were still elevated 180 min after glucose administration. Figures 5B–F shows the effects of high glucose on the expression of the APP, ADAM10, BACE1, PS1 and PS2 mRNAs in the retinas of 60-week-old LETO and OLETF rats. The expressions of APP, BACE1, PS1 and PS2 mRNAs were significantly increased 180 min after glucose administration. Table 4 shows the correlation coefficients (r) between Aβ1–42 levels and blood test values for diabetes mellitus (Glu, TG, Cho, insulin and HbA1c) in 60-week-old OLETF rats. Neither body weight nor serum TG, Cho and insulin levels showed any relationship with soluble and insoluble Aβ1–42 levels. On the other hand, both the soluble and insoluble Aβ1–42 levels in 60-week-old OLETF rats increased with increasing Glu levels, showing a close relationship. Furthermore, the soluble and insoluble Aβ1–42 levels in 60-week-old OLETF rats increased with the increase in HbA1c, and the relationship between Aβ1–42 and HbA1c was greater than that between Aβ1–42 and Glu. Figure 6 shows the mRNA expression levels for APP (A), ADAM10 (B), BACE1 (C), PS1 (D) and PS2 (E) and Aβ1–42 levels (F) in the retina with or without the treatment of high glucose. The APP, ADAM10, BACE1, PS1, PS2 and Aβ1–42 levels in retinas of LETO and OLETF rats were increased under the high glucose condition.
Table 4. Correlation Coefficients (
r) among Soluble and Insoluble Aβ
1–42 Levels and Body Weight, Glu, TG, Cho, Insulin and HbA1c Levels in 60-Week-Old OLETF Rats
| Relationship | Soluble Aβ1–42 | Insoluble Aβ1–42 |
|---|
| vs. body weight | −0.29 | −0.40 |
| vs. Glu | 0.72* | 0.67 |
| vs. TG | −0.08 | −0.10 |
| vs. Cho | 0.01 | 0.04 |
| vs. insulin | −0.06 | 0.03 |
| vs. HbA1c | 0.90* | 0.87* |
TG levels were determined using an Accutrend GCT. Glu and Cho levels were measured by a Glucose Assay Kit and Cholesterol E-Test Kit, respectively. Insulin and Aβ1–42 levels were determined using an ELISA method, and HbA1c was analyzed by HLC-723GHbV. The data represent mean values for 8 independent rats. * p<0.05.
DISCUSSION
Aβ is produced constitutively by the proteolysis of APP, and it has been reported that enhanced Aβ levels cause neurodegeneration in the retinas of mice and rats.12,34,37) In this study, we demonstrate that the spontaneous diabetes mellitus OLETF rats can be used as a model animal for studies to identify the expression of Aβ in diabetic retinas. In addition, we investigated the relationship between blood glucose levels and Aβ production in the retina of OLETF rats.
It has been reported that both Aβ1–40 and Aβ1–42 peptides self-assemble into amyloid fibrils,38–41) and biophysical experiments have indicated that Aβ1–42 forms amyloid fibrils even more readily than Aβ1–40 in in vitro experiments.42,43) In this study, we examined the accumulation of Aβ1–42 in the retinas of rats. Aβ1–42 was found to accumulate in the retinas of both LETO and OLETF rats; however, Aβ1–42 was undetectable in the retinas of Wistar, SD, DA and Lewis rats (Fig. 1C). It is known that under physiological conditions, Aβ is degraded by peptidases, including NEP, DINE and ECE, immediately after production.5–9) Therefore, we measured the expressions of the NEP, DINE and ECE-1 genes in the retinas of these rat strains using a semi-quantitative RT-PCR method (50 cycles). In the retinas of normal rats, such as Wistar, SD, DA, Lewis, NEP, DINE and ECE-1 expression was observed. Although, the expression of DINE and ECE-1 was also detected in the retinas of LETO and OLETF rats, no NEP expression could be observed (Figs. 1A, B). Since the expression of genes involved in Aβ production (APP, BACE1, PS1 and PS2) were found to be similar among Wistar, SD, DA, Lewis, LETO and OLETF rats, these results indicate that Aβ accumulation in LETO and OLETF rat retinas is attributable to a defect or decrement in NEP.
Next, we examined Aβ1–42 levels in the retinas of rats with or without diabetic mellitus. APP gene expression levels, as well as the expression levels of the genes for β-secretase (BACE1) and γ-secretase (PS1 and PS2), which cause APP proteolysis, were all significantly higher in the retinas of 60-week-old OLETF rats with retinopathy than in LETO rats of the same age (Fig. 3). In addition, the levels of APP protein, soluble and insoluble Aβ1–42 in the retinas of 60-week-old OLETF rats were significantly higher than those in 60-week-old LETO rats (Figs. 3F, 4). On the other hand, the Aβ1–42 levels in the retinas of young OLETF rats without diabetes mellitus were similar to those in LETO rats (Fig. 4), and the Aβ accumulation in retinas of 60-week-old normal rats such as Wistar rat and SD rat, did N.D. by the ELISA method (Rat β Amyloid (42) ELISA Kit). These results suggest that the excessive expressions of the APP, BACE1, PS1 and PS2 genes, as well as Aβ1–42 accumulation, may be caused by the spontaneous development of diabetes mellitus in OLETF rats. A spontaneous diabetic model with metabolic syndrome in which Aβ1–42 accumulates in the retina has not been reported so far; we here report for the first time a spontaneous diabetic model that shows Aβ1–42 accumulation in the retina. Therefore, OLETF rats may provide a suitable animal model for studies related to retinal Aβ in diabetes mellitus.
It is very important to elucidate the precise process by which Aβ1–42 accumulates in the retinas of OLETF rats, and to clarify the temporal relationship between Aβ accumulation and retinal damage in this model. It is known that both soluble and insoluble Aβ1–42 levels increase in close correlation with Glu levels (Table 4). Therefore, we measured HbA1c levels, and demonstrated a relationship between soluble and insoluble Aβ1–42 levels and HbA1c levels. It is known that retinal HbA1c levels in rats are lower than in humans with type 2 diabetes mellitus, and Taniguchi et al.44) have shown that HbA1c levels in 25-week-old LETO and OLETF rats are approximately 2.9% and 3.5%, respectively. In this study, the HbA1c levels in 60-week-old LETO and OLETF rats were similar to those reported by Taniguchi et al.,44) and are higher in OLETF rats than in LETO rats. The relationship between the levels of soluble or insoluble Aβ1–42 and HbA1c are also similar, and closer than the relationship between Aβ1–42 and Glu (Table 4). In addition, the expressions of APP, BACE1, PS1 and PS2 mRNAs in the retinas of 60-week-old OLETF rats were significantly increased 180 min after the oral administration of glucose (Fig. 5), and the expression of genes involved in Aβ production (APP, BACE1, PS1 and PS2) and Aβ1–42 levels in the retinas of LETO and OLETF rats were significantly enhanced by the treatment with high glucose (Fig. 6). Taken together, it is hypothesized that long-term hyperglycemia induces an enhancement in the expression of genes that lead to Aβ production (APP, BACE1, PS1 and PS2), so that Aβ1–42 accumulates in retinas. Furthermore, it was known that the oscillatory potentials (OP) of the ERG in retina reflect to the onset of diabetic retinopathy, and the significantly changes in OP was started in 35-week-old OLETF rat.10) On the other hand, the accumulation of Aβ1–42 in retina was observed in 20-week-old OLETF rat (LETO rat, 0.67±0.07; OLETF rat, 0.83±0.08, pmol/mg protein, n=4), and the NEP levels in retina of 7-week-old Wistar, SD, DA and Lewis rat (normal rat) treated with 20 mM glucose was also higher than those in 5.6 mM glucose (5.6 mM: Wistar rat, 220±23; SD, 237±19; DA, 241±20; Lewis rat, 227±21, 20 mM: Wistar rat, 288±28; SD, 319±24; DA, 336±22; Lewis rat, 291±25, pg/mg protein, n=5). Hara et al.11) reported that the accumulation of Aβ was related to the retinal damage in the in patients with retinal diseases. In addition, It was reported that the accumulation of Aβ was caused to increase the NEP expression of retina in humans with diabetic retinopathy.10,11) From these results, it is possible that the accumulation of Aβ may be related to the retinal damage in the OLETF rats,12,34,37) and the deficit or decrement of the expression levels of NEP may enhance the risk of diabetic retinopathy or other retinal diseases via Aβ accumulation.
Further studies are needed to elucidate the mutations in the gene of NEP in LETO and OLETF rats. Therefore, we next plan to investigate the sequence analysis among the Wistar rat and Long-Evans rat (LETO and OLETF rat). In addition, it is important to clarify the relationships among Glu levels, Aβ1–42 levels and retinopathy in OLETF rats. When blood glucose concentrations are chronically high, the production of various reducing sugars increases as a result of enhancements in glycolysis and the polyol pathway, which leads to an increase in the production of reactive oxygen species (ROS) through the induction of the glycation reaction.45,46) Therefore, we will investigate the effects of ROS via the glycation reaction on the induction of Aβ production and its accumulation in the retinas of OLETF rats with diabetes mellitus.
In conclusion, we report for the first time the accumulation of Aβ1–42 in the retinas of OLETF rats. Prior to now, a spontaneous diabetic animal model showing Aβ1–42 accumulation in the retina and metabolic syndrome has not been reported. Therefore, OLETF rats may provide a suitable animal model for studies related to Aβ in the retinas of patients with diabetes mellitus. In addition, we determined that chronically high blood glucose levels elevate the expressions of genes responsible for Aβ production (APP, BACE1, PS1 and PS2), resulting in the accumulation of soluble and insoluble Aβ1–42 in the retinas of 60-week-old OLETF rats. These findings provide information significant for the prevention and treatment of retinopathy in diabetic patients.
Conflict of Interest
The authors declare no conflict of interest.
REFERENCES
- 1) Vassar R, Bennett BD, Babu-Khan S, Kahn S, Mendiaz EA, Denis P, Teplow DB, Ross S, Amarante P, Loeloff R, Luo Y, Fisher S, Fuller J, Edenson S, Lile J, Jarosinski MA, Biere AL, Curran E, Burgess T, Louis JC, Collins F, Treanor J, Rogers G, Citron M. Beta-secretase cleavage of Alzheimer’s amyloid precursor protein by the transmembrane aspartic protease BACE. Science, 286, 735–741 (1999).
- 2) Takasugi N, Tomita T, Hayashi I, Tsuruoka M, Niimura M, Takahashi Y, Thinakaran G, Iwatsubo T. The role of presenilin cofactors in the gamma-secretase complex. Nature, 422, 438–441 (2003).
- 3) Zheng H, Koo EH. The amyloid precursor protein: beyond amyloid. Mol. Neurodegener., 1, 5 (2006).
- 4) Wong PC. Translational control of BACE1 may go awry in Alzheimer’s disease. Neuron, 60, 941–943 (2008).
- 5) Kukar TL, Ladd TB, Bann MA, Fraering PC, Narlawar R, Maharvi GM, Healy B, Chapman R, Welzel AT, Price RW, Moore B, Rangachari V, Cusack B, Eriksen J, Jansen-West K, Verbeeck C, Yager D, Eckman C, Ye W, Sagi S, Cottrell BA, Torpey J, Rosenberry TL, Fauq A, Wolfe MS, Schmidt B, Walsh DM, Koo EH, Golde TE. Substrate-targeting gamma-secretase modulators. Nature, 453, 925–929 (2008).
- 6) Iwata N, Takaki Y, Fukami S, Tsubuki S, Saido TC. Region-specific reduction of A beta-degrading endopeptidase neprilysin in mouse hippocampus upon aging. J. Neurosci. Res., 70, 493–500 (2002).
- 7) Esler WP, Wolfe MS. A portrait of Alzheimer’s secretases—new features and familiar faces. Science, 293, 1449–1454 (2001).
- 8) Eckman EA, Reed DK, Eckman CB. Degradation of the Alzheimer’s amyloid beta peptide by endothelin-converting enzyme. J. Biol. Chem., 276, 24540–24548 (2001).
- 9) Selkoe DJ. Amyloid beta-protein and the genetics of Alzheimer’s disease. J. Biol. Chem., 271, 18295–18298 (1996).
- 10) Yoneda S, Hara H, Hirata A, Fukushima M, Inomata Y, Tanihara H. Vitreous fluid levels of beta-amyloid(1–42) and tau in patients with retinal diseases. Jpn. J. Ophthalmol., 49, 106–108 (2005).
- 11) Hara H, Oh-hashi K, Yoneda S, Shimazawa M, Inatani M, Tanihara H, Kiuchi K. Elevated neprilysin activity in vitreous of patients with proliferative diabetic retinopathy. Mol. Vis., 12, 977–982 (2006).
- 12) Ning A, Cui J, To E, Ashe KH, Matsubara J. Amyloid-beta deposits lead to retinal degeneration in a mouse model of Alzheimer’s disease. Invest. Ophthalmol. Vis. Sci., 49, 5136–5143 (2008).
- 13) Kinoshita JH. Cataracts in galactosemia (The Jonas S Friendenwald Memorial Lecture). Invest. Ophthalmol., 4, 786–799 (1965).
- 14) Kinoshita JH. Mechanisms initiating cataract formation (Proctor Lecture). Invest. Ophthalmol. Vis. Sci., 13, 713–724 (1974).
- 15) Fukushi S, Merola LO, Kinoshita JH. Altering the course of cataracts in diabetic rats. Invest. Ophthalmol. Vis. Sci., 19, 313–315 (1980).
- 16) Kador PF, Akagi Y, Kinoshita JH. The effect of aldose reductase and its inhibition on sugar cataract formation. Metabolism, 35 (Suppl. 1), 15–19 (1986).
- 17) Akagi Y, Tasaka H, Terubayashi H, Ikebe H, Mori K. Morphological classification of the prevention of aldose reductase inhibitor on rat galactose cataract Current Concepts of Aldose Reductase and its Inhibition. (Sakamoto N, Kinoshita JH, Kador PF, Hotta N eds.) Elsevier, New York, U.S.A., pp. 157–160 (1990).
- 18) Kawano K, Hirashima T, Mori S, Saitoh Y, Kurosumi M, Natori T. Spontaneous long-term hyperglycemic rat with diabetic complications Otsuka Long-Evans Tokushima Fatty (OLETF) strain. Diabetes, 41, 1422–1428 (1992).
- 19) Ishida K, Mizuno A, Min Z, Sano T, Shima K. Which is the primary etiologic event in Otsuka Long-Evans Tokushima Fatty rats a model of spontaneous non-insulin-dependent diabetes mellitus insulin resistance or impaired insulin secretion? Metabolism, 44, 940–945 (1995).
- 20) Sato T, Asahi Y, Toide K, Nakayama N. Insulin resistance in skeletal muscle of the male Otsuka Long-Evans Tokushima Fatty rat a new model of NIDDM. Diabetologia, 38, 1033–1041 (1995).
- 21) Ito A, Uriu K, Inada Y, Qie YL, Takagi I, Ikeda M, Hashimoto O, Suzuka K, Eto S, Tanaka Y, Kaizu K. Inhibition of neuronal nitric oxide synthase ameliorates renal hyperfiltration in streptozotocin-induced diabetic rat. J. Lab. Clin. Med., 138, 177–185 (2001).
- 22) Yabuki A, Tahara T, Taniguchi K, Matsumoto M, Suzuki S. Neuronal nitric oxide synthase and cyclooxygenase-2 in diabetic nephropathy of type 2 diabetic OLETF rats. Exp. Anim., 55, 17–25 (2006).
- 23) Hirashima T, Man ZW, Mori S, Kawano K. OLETF rat. Diabetes Frontier, 9, 477–480 (1998).
- 24) Minami A, Ishimura N, Sakamoto S, Takishita E, Mawatari K, Okada K, Nakaya Y. Effect of eicosapentaenoic acid ethyl ester V oleic acid-rich safflower oil on insulin resistance in type 2 diabetic model rats with hypertriacylglycerolaemia. Br. J. Nutr., 87, 157–162 (2002).
- 25) Wakuta M, Morishige N, Chikama T, Seki K, Nagano T, Nishida T. Delayed wound closure and phenotypic changes in corneal epithelium of the spontaneously diabetic Goto–Kakizaki rat. Invest. Ophthalmol. Vis. Sci., 48, 590–596 (2007).
- 26) Miyamura N, Bhutto IA, Amemiya T. Retinal capillary changes in Otsuka Long-Evans Tokushima Fatty rats (spontaneously diabetic strain). Electron-microscopic study. Ophthalmic Res., 31, 358–366 (1999).
- 27) Yonemura D. An electrophysiological study on activities of neuronal and non-neuronal retinal elements in man with reference to its clinical application. Nippon Ganka Gakkai Zasshi, 81, 1632–1665 (1977).
- 28) Yamada A. Alteration of electroretinogram in spontaneously diabetic rats: Effect of caloric restriction. J. Juzen Med. Soc., 110, 418–442 (2001).
- 29) Chomczynski P, Sacchi N. Single-step method of RNA isolation by acid guanidinium thiocyanate–phenol–chloroform extraction. Anal. Biochem., 162, 156–159 (1987).
- 30) Lin HB, Yang XM, Li TJ, Cheng YF, Zhang HT, Xu JP. Memory deficits and neurochemical changes induced by C-reactive protein in rats: implication in Alzheimer’s disease. Psychopharmacology, 204, 705–714 (2009).
- 31) Xiong M, Zhang T, Zhang LM, Lu SD, Huang YL, Sun FY. Caspase inhibition attenuates accumulation of beta-amyloid by reducing beta-secretase production and activity in rat brains after stroke. Neurobiol. Dis., 32, 433–441 (2008).
- 32) Zhu X, Zhou W, Cui Y, Zhu L, Li J, Xia Z, Shao B, Wang H, Chen H. Muscarinic activation attenuates abnormal processing of beta-amyloid precursor protein induced by cobalt chloride-mimetic hypoxia in retinal ganglion cells. Biochem. Biophys. Res. Commun., 384, 110–113 (2009).
- 33) Nagai N, Fukuhata T, Ito Y, Usui S, Hirano K. Involvement of interleukin 18 in indomethacin-induced lesions of the gastric mucosa in adjuvant-induced arthritis rat. Toxicology, 255, 124–130 (2009).
- 34) Shimazawa M, Inokuchi Y, Okuno T, Nakajima Y, Sakaguchi G, Kato A, Oku H, Sugiyama T, Kudo T, Ikeda T, Takeda M, Hara H. Reduced retinal function in amyloid precursor protein-over-expressing transgenic mice via attenuating glutamate-N-methyl-D-aspartate receptor signaling. J. Neurochem., 107, 279–290 (2008).
- 35) Nagai N, Ito Y. Excessive hydrogen peroxide enhances the attachment of amyloid β1-42 in the lens epithelium of UPL rats a hereditary model for cataracts. Toxicology, 315, 55–64 (2014).
- 36) Bradford MM. A rapid and sensitive method for the quantitation of microgram quantities of protein utilizing the principle of protein–dye binding. Anal. Biochem., 72, 248–254 (1976).
- 37) Guo L, Salt TE, Luong V, Wood N, Cheung W, Maass A, Ferrari G, Russo-Marie F, Sillito AM, Cheetham ME, Moss SE, Fitzke FW, Cordeiro MF. Targeting amyloid-beta in glaucoma treatment. Proc. Natl. Acad. Sci. U.S.A., 104, 13444–13449 (2007).
- 38) Fraser PE, Nguyen JT, Inouye H, Surewicz WK, Selkoe DJ, Podlisny MB, Kirschner DA. Fibril formation by primate rodent and Dutch-hemorrhagic analogues of Alzheimer’s amyloid beta-protein. Biochemistry, 31, 10716–10723 (1992).
- 39) Bush AI, Pettingell WH, Multhaup G, d Paradis M, Vonsattel JP, Gusella JF, Beyreuther K, Masters CL, Tanzi RE. Rapid induction of Alzheimer A beta amyloid formation by zinc. Science, 265, 1464–1467 (1994).
- 40) Lorenzo A, Yankner BA. Beta-amyloid neurotoxicity requires fibril formation and is inhibited by Congo red. Proc. Natl. Acad. Sci. U.S.A., 91, 12243–12247 (1994).
- 41) Ma J, Yee A, Brewer HB Jr, Das S, Potter H. Amyloid-associated proteins alpha 1-antichymotrypsin and apolipoprotein E promote assembly of Alzheimer beta-protein into filaments. Nature, 372, 92–94 (1994).
- 42) Jarret JT, Lansbury PT Jr. Seeding “one-dimensional crystallization” of amyloid: a pathogenic mechanism in Alzheimer’s disease and scrapie? Cell, 73, 1055–1058 (1993).
- 43) Jarrett JT, Berger EP, Lansbury PT Jr. The carboxy terminus of the beta amyloid protein is critical for the seeding of amyloid formation: implications for the pathogenesis of Alzheimer’s disease. Biochemistry, 32, 4693–4697 (1993).
- 44) Taniguchi M, Kim S, Zhan Y, Iwao H. Role of intrarenal angiotensin-converting enzyme in nephropathy of type II diabetic rats. Hypertens. Res., 25, 287–294 (2002).
- 45) Tajiri Y, Moller C, Grill V. Long-term effects of aminoguanidine on insulin release and biosynthesis: evidence that the formation of advanced glycosylation end products inhibits B cell function. Endocrinology, 138, 273–280 (1997).
- 46) Kaneto H, Kajimoto Y, Fujitani Y, Matsuoka T, Sakamoto K, Matsuhisa M, Yamasaki Y, Hori M. Oxidative stress induces p21 expression in pancreatic islet cells: possible implication in beta-cell dysfunction. Diabetologia, 42, 1093–1097 (1999).