Abstract
Nonalcoholic fatty liver disease (NAFLD) is the most common chronic liver disease worldwide. Paeoniflorin, a natural product and active ingredient of Paeonia lactiflora, has been demonstrated to have many pharmacological effects including antiinflammatory and antihyperglycemic activity. We investigated the effects of paeoniflorin on NAFLD in mice and its underlying mechanisms. We examined this hypothesis using a well-established animal model of NAFLD. The effects of paeoniflorin on inflammation and glucolipid metabolism disorder were evaluated. The corresponding signaling pathways were measured using real-time polymerase chain reaction (PCR). We demonstrated that the mice developed obesity, dyslipidemia, and fatty liver, which formed the NAFLD model. Paeoniflorin attenuated NAFLD and exhibited potential cardiovascular protective effects in vivo by lowering body weight, hyperlipidemia, and insulin resistance; blocking inflammation; and inhibiting lipid ectopic deposition. Further investigation revealed that the antagonistic effect on hyperlipidemia and lipid ectopic deposition was related to lowering the lipid synthesis pathway (de novo pathway, 3-hydroxy-3-methyl glutaryl coenzyme A reductase (HMG-CoAR)), promoting fatty acid oxidation [peroxisome proliferator-activated receptor-alpha (PPARα), carnitine palmitoyltransferase-1, etc.] and increasing cholesterol output (PPARγ-liver X receptor-α-ATP-binding cassette transporter-1); the inhibitory effects on inflammation and hyperglycemia were mediated by blocking inflammatory genes activation and reducing gluconeogenic genes expression (phosphoenolpyruvate carboxykinase and G6Pase). These results suggest that paeoniflorin prevents the development of NAFLD and reduces the risks of atherosclerosis through multiple intracellular signaling pathways. It may therefore be a potential therapeutic compound for NAFLD.
Nonalcoholic fatty liver disease (NAFLD) is an escalating public health problem.1) Prevalence of NAFLD has been increasing mainly because of the increased prevalence of obesity.2) It has been estimated that as many as 35% of adults in the United States and 15% in relatively affluent regions in China have NAFLD.3,4) NAFLD includes a spectrum of hepatic disorders extending from nonalcoholic fatty liver (NAFL) to nonalcoholic steatohepatitis (NASH), fibrosis/cirrhosis and hepatocellular carcinoma (HCC).5,6) In addition to hepatic complications, patients with NAFLD are at increased risk for cardio-metabolic complications such as type 2 diabetes (T2DM) and cardiovascular disease (CVD).
Paeonia lactiflora has been used in traditional Chinese medicines in China and Japan for memory improvement, anti-epilepsy, lipid-lowering. Paeoniflorin, isolated from P. lactiflora, is a predominant component of peony plants.7) Today, it has been reported that paeoniflorin exhibits many pharmacological effects such as anti-inflammation, anti-allergy, anti-hyperglycemia, analgesia and enhancing cognition.7–10) The aim of the present study was to investigate whether paeoniflorin exerted a protective effect against on NAFLD and to determine its mechanism.
MATERIALS AND METHODS
MaterialsPaeoniflorin, supplemented in diet, was purchased from Shanghai Pureone biotechnology (Shanghai, China) Co., Ltd. (lot number: P0087). Commercial kits for the measurement of triglyceride (TG), total cholesterol (TC), high density lipoprotein (HDL) and low density lipoprotein (LDL) were obtained from Nanjing Jiancheng Bioengineering Institute. Alanine aminotransferase (ALT) and aspartate aminotransferase (AST) kits were obtained from Shanghai Yaji Meilian Biological Technology Co., Ltd. All primers were synthesized by Sangon Biotech (Shanghai) Co., Ltd. All chemicals and reagents were analytical grade.
Animals ExperimentAnimals Model and DietExperiments were approved by the Animal Care Use Committee of the Renmin hospital of Wuhan University. Seven weeks old male C57BL/6J mice were purchased from experimental animal center of Wuhan University. They were kept in an standard cages (temperature: 23±2°C, humidity: 60±5%, 12 h dark/light cycle). After 1 week of acclimatization, mice were divided into four groups: normal control mice (Control) (n=10), normal control mice treated with paeoniflorin (Con+Pa) (n=10), high-fat diet-fed mice (HF) (n=10), and high-fat diet-fed mice treated with paeoniflorin (HF+Pa) (n=10). The control and the HF groups were fed with AIN-76A diet [containing (energy%) 11.5% fat, 67.7% carbohydrate, and 20.8% protein] and high-fat diet [containing (energy%) 37.4% fat, 42.6% carbohydrate, and 20.0% protein], respectively. While the other groups were fed with corresponding diet supplemented with 0.05% paeoniflorin (>98% pure). The food consumption and weight gain were measured one and two weeks, respectively.
Sample Collection and PreparationMice were fed for 24 weeks. At the end of the study, animals were fasted overnight and were sacrificed under anesthesia (ether inhalation anesthesia). Before being sacrificed, body weight and length were measured. Blood samples were collected and centrifuged at 4000 rpm, 30 min at 4°C for serum. Liver were removed for weight and liver index calculation [Index (%)=liver weight (g)×body weight (g)−1×100]. One part was cut and fixed in 10% (v/v) neutral formalin solution for histological analysis. The rest was used for frozen sections and molecular detection. Visceral fat, including perirenal, retroperitoneal, epididymal fat pad, was also removed and weighed for index calculation.
Biochemical AnalysisThe levels of serum lipid and ALT, AST were assayed according to the protocols of commercial clinical diagnosis kits in the Olympus AU 600 autoanalyzer. Hepatic TC and TG content were measured by spectrophotometry and expressed as TC and TG mg/g wet liver weight according to published method.11)
Blood glucose was measured in whole blood with a glucose meter (Onetouch Ultra, Johnson & Johnson). Insulin concentrations were analyzed using enzyme-linked immunosorbent assay (ELISA) method (LINCO Research). Insulin resistance was evaluated by the homeostasis model of insulin resistance (HOMA-IR) formula (serum glucose level [mmol/L]×insulin level [mIU/L]/22.5). A high HOMA-IR score indicates a high insulin resistance.
Histologcal AnalysisLiver were excised, washed with saline solution and placed in 10% formalin. Several sections of liver (4–5 µm thick) were prepared and stained with hematoxylin and eosin (H&E) for histopathology and then visualized by light microscopy (×200). Histological changes were semi-quantitated by two independent pathologists according to the degrees of the steatohepatitis scores.12)
Gene Expression AnalysisTotal RNA was extracted from frozen, pulverized mice liver using Trizol (Invitrogen) and transcribed by two-step method with Super Script First-Strand Synthesis System. We quantified polymerase chain reaction (PCR) amplifications using SYBR Green PCR Master Mix (Applied Biosystems) and normalized results against β-actin gene expression. Sequences of primers used for real-time PCR are showed in Table 1.
Table 1. Sequences of the Primers Used in the PCR Measurements
| Gene | Sense | Sequence (5′ to 3′) |
|---|
| SREBP-1c | SREBP-1C-FWD | CACTTCTGGAGACATCGCAAAC |
| SREBP-1C-REV | ATGGTAGACAACAGCCGCATC |
| FAS | FAS-FWD | CTGCGGAAACTTCAGGAAATG |
| FAS-REV | GGTTCGGAATGCTATCCAGG |
| CPT-1a | CPT-1a-FWD | AGGACCCTGAGGCATCTATT |
| CPT-1a-REV | ATGACCTCCTGGCATTCTCC |
| ACOX | ACOX-FWD | CGGAAGATACATAAAGGAGACC |
| ACOX-REV | AAGTAGGACACCATACCACCC |
| UCP2 | UCP2-FWD | GCTGGTGGTGGTCGGAGATA |
| UCP2-REV | ACTGGCCCAAGGCAGAGTT |
| SCD-1 | SCD-1-FWD | TCTTCCTTATCATTGCCAACACCA |
| SCD-1-REV | GCGTTGAGCACCAGAGTGTATCG |
| PPARα | PPAR-α-FWD | CAAGGCCTCAGGGTACCACT |
| PPAR-α-REV | TTGCAGCTCCGATCACACTT |
| ACCα | ACCα-FWD | GGCCAGTGCTATGCTGAGAT |
| ACCα-REV | AGGGTCAAGTGCTGCTCCA |
| HMGCR | HMGCR-FWD | TGGCAGGACGCAACCTCTAT |
| HMGCR-REV | TGACGGCTTCACAAACCACA |
| LDLR | LDLR-FWD | GAACTCAGGGCCTCTGTCTG |
| LDLR-REV | GAAACCATGCGTGTATCCCT |
| LXR-α | LXR-α-FWD | AGCGTCCACTCAGAGCAAGT |
| LXR-α-REV | GGGGACAGAACAGTCATTCG |
| ABCA-1 | ABCA-1-FWD | CAAGGATGGCCATAATGGTCA |
| ABCA-1-REV | GGCCACATCCACAACTGTCTG |
| PPARγ | PPAR-γ-FWD | ATTCTGGCCCACCAACTTCGG |
| PPAR-γ-REV | TGGAAGCCTGATGCTTTATCCCCA |
| PEPCK | PEPCK-FWD | GCCGACCTCCCTTAGAAATAG |
| PEPCK-REV | CGAACTTCGGAGAACAGACGTGA |
| G6Pase | G6Pase-FWD | AGAGACTGTGGGCATCAATCT |
| G6Pase-REV | CCGGAATCCATACGTTGATT |
| TNF-α | TNF-α-FWD | CCGATGGGTTGTACCTTGTC |
| TNF-α-REV | GGGCTGGGTAGAGAATGGAT |
| IL-1β | IL-1β-FWD | CCTCTCCAGCCAAGCTTCCT |
| IL-1β-REV | TTTGGAAGCAGCCCTTCATC |
| IL-6 | IL-6-FWD | TCCTACCCCAATTTCCAATGC |
| IL-6-REV | CATAACGCACTAGGTTTGCCG |
| MCP-1 | MCP-1-FWD | ATGCAGGTCTCTGTCACG |
| MCP-1-REV | CTAGTTCTCTGTCATACT |
| β-Actin | β-Actin-FWD | CCACTGCCGCATCCTCTTCCTC |
| β-Actin-REV | TCCTGCTTGCTGATCCACATCT |
Data were expressed as mean±S.E. The significance of differences between groups was analyzed statistically by one-way ANOVA. Differences were considered significance at p<0.05.
RESULTS
NAFLD Was Induced by High-Fat Diet in C57 MiceDuring the 24-week feeding period, the mice in HF group developed central obesity (Fig. 1, Table 2), hyperglycemia, insulin resistance, dyslipidemia, inflammatory state (Tables 3, 4) and hepatic steatosis (Fig. 2). There was, however, no significant difference in food intake among all mice (data not shown).
Table 2. Paeoniflorin Decreases Abdominal Obesity and Organ Weights in C57 Mice
| Control | Control+Pa | HF | HF+ Pa |
|---|
| Number | 10 | 10 | 10 | 10 |
| Abdomen circumference (cm) | 7.48±0.15 | 7.51±0.13 | 9.21±0.17* | 8.15±0.15## |
| Liver weight (g) | 1.11±0.04 | 1.11±0.04 | 1.83±0.11* | 1.50±0.08## |
| White adipose tissue (g) | 1.21±0.12 | 1.22±0.11 | 3.58±0.21* | 2.02±0.19## |
| Liver index (%) | 3.46±0.11 | 3.42±0.12 | 4.42±0.17* | 4.01±0.14# |
| Adiposity index (%) | 4.07±0.28 | 3.95±0.25 | 8.54±0.35* | 5.87±0.45## |
Paeoniflorin-treated obese mice were compared with obese animals and with the controls. Paeoniflorin lowered abdomen circumference, organ weights and organ weight index. Visceral fat includes epididymal fat pad, mesentery fat tissue and abdominal adipose tissue. Visceral fat index=white adipose tissue weight (g) / body weight (g)×100. So is liver index. All values are the mean±S.E.M. * p<0.01 vs. Control, # p<0.05, ## p<0.01 vs. HF.
Table 3. Effects of Paeoniflorin on Lipid Profiles and Liver Function in C57 Mice
| Control | Control+Pa | HF | HF+Pa |
|---|
| Number | 10 | 10 | 10 | 10 |
| Serum TC (mL) | 1.85±0.13 | 1.98±0.20 | 4.54±0.11* | 3.12±0.09## |
| Serum TG (mL) | 0.60±0.08 | 0.56±0.03 | 0.87±0.05* | 0.78±0.04 |
| Serum HDL (mL) | 1.50±0.09 | 1.73±0.13 | 3.08±0.08* | 2.26±0.25## |
| Serum LDL (mL) | 0.33±0.03 | 0.36±0.05 | 0.94±0.02* | 0.61±0.03## |
| Liver TC (mg/g) | 1.67±0.38 | 1.52±0.41 | 4.84±0.73* | 2.77±0.66# |
| Liver TG (mg/g) | 4.64±0.34 | 4.56±0.58 | 11.23±1.64* | 10.74±1.12 |
| ALT (U L−1) | 44.59±7.68 | 47.28±8.23 | 87.60±9.74* | 61.33±7.24## |
| AST (U L−1) | 63.24±8.76 | 65.57±8.52 | 117.21±10.45* | 88.62±9.72# |
| Blood glucose (mmol L−1) | 5.28±0.43 | 5.62±0.54 | 8.21±0.57* | 6.64±0.53# |
| Serum insulin (mIU/L) | 8.58±0.95 | 8.14±1.03 | 46.13±4.24* | 15.56±2.35## |
| HOMA-IR (mmol L−1×mIU L−1) | 2.01±0.28 | 2.03±0.31 | 16.83±1.42* | 4.59±0.86## |
Paeoniflorin treatment promoted a significant decrease in serum levels of TC, TG, HDL, LDL, ALT, AST and the contents of liver TC, TG in comparison to HF animals, while it did not lead to a significant change in triglycerides levels. The mice, induced by high-fat diet, developed insulin resistance: higher fasting blood glucose, serum insulin levels and HOMA-IR. All changes were reversed by paeoniflorin. But it did not lower serum glucose in normal state. All values are the mean±S.E.M. * p<0.01 vs. Control, # p<0.05, ## p<0.01 vs. HF.
In our experiment, the model mice developed obesity significantly shown by increased body weight (Fig. 1, Table 2, p>0.05). At the end of study, the average body weight in HF group and HF+Pa group reached 41.53±0.799, 37.24±0.964, respectively (p<0.01). And the weight of mice in control+Pa group showed no change compared with that of the control group. This means paeoniflorin just plays the weight-lowering effect in obesity state. Meanwhile, several indexes showed the same changes, such as liver weight, liver index, visceral fat weight, visceral fat index and so on (Table 2).
Paeoniflorin Improved High-Fat Diet-Induced Hyperglycemia, Insulin Resistance, Hyperlipidemia and Liver Function DamageGlycolipid metabolism disorders manifests as hyperglycemia, insulin resistance and hyperlipidemia, along with impaired liver function. In our study, hyperlipemia, insulin resistance and hyperlipidemia formed after induced by the high-fat diet. The levels of serum cholesterol were significantly increased by 145.4% in the HF group (p<0.01) and decreased to 68.7% in paeoniflorin-treated group (p<0.01; Table 3). The levels of serum LDL and HDL showed the same changes as cholesterol. Triglyceride concentrations were not altered, although it did decrease slightly after paeoniflorin treatment. The same changes occurred in the liver TC and TG contents. Long-term high-fat diet resulted in serious liver function damage—elevated serum ALT and AST levels. After paeoniflorin treatment, impaired liver function returned to normal.
Insulin resistance is one of the characteristics of metabolic syndrome. To demonstrate the insulin resistance, we performed several tests, including fasting glucose, insulin levels, HOMA-IR index. In the HF group, the HOMA-IR index was 8 times higher than that of Control group (p<0.01; Table 3). While in the HF+Pa group, insulin sensitivity was increased because the HOMA-IR index dropped to 27.3%. The levels of fasting glucose and insulin exhibited similar changes as the HOMA-IR index.
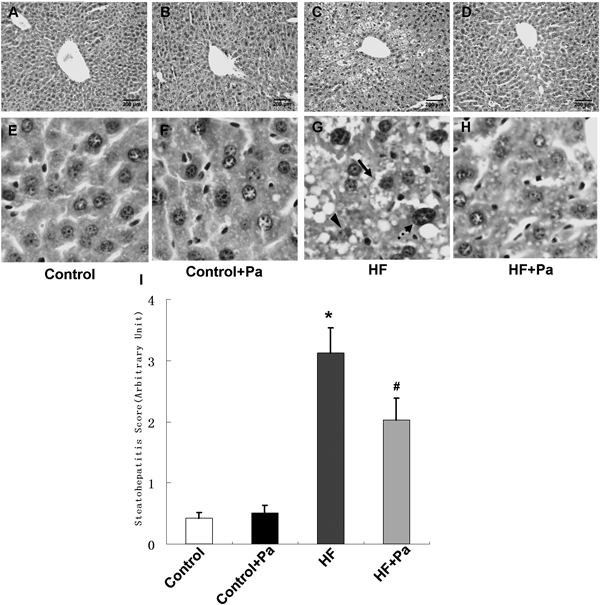
Paeoniflorin Attenuated High-Fat Diet-Induced Hepatic Adipose InfiltrationLivers from mice fed the four diets were analyzed histologically and the stained sections were analyzed by light microscopy (×200, Fig. 2). No apparent differences were observed between liver sections from control and control+Pa mice. Long-term high-fat diet resulted in steatosis, inflammation, ballooning degeneration and necrosis in HF group. But the lipid inclusions were strikingly reduced in both size and number in the liver of Pa-treated animals. And paeoniflorin also lowered steatohepatitis scores (p<0.01; Fig. 2I).
Molecular Changes of Hepatic Genes Involved in Energy MetabolismTo further elucidate the mechanism why paeoniflorin was able to affect lipid metabolism in the liver, the mRNA levels of several key genes affecting lipid synthesis and metabolism were determined. As shown in Table 4, many lipid metabolism genes changed. A) In the way of de novo synthesis, expressions of the first three genes (SERBP-1c, FAS, ACCα) were higher in HF vs. Control animals. But these alteration were reversed by paeoniflorin (p<0.01; Table 4A); B) In the way of oxidation metabolism, the expressions of four genes promoting fatty acid oxidation (PPARα, CPT-1a, ACOX, UCP2) showed a significant difference in HF+Pa vs. HF mice (p<0.01; Table 4B). Great changes occurred in the levels of SCD-1 mRNA, which were increased 1.1-fold in model mice, but no significant difference was observed in high-fat fed mice supplemented with paeoniflorin (p>0.05; Table 4B; C) Cholesterol biosynthesis: expressions of the two genes (HMGCR, LDLR) coding enzymes affecting cholesterol synthesis were higher in HF+Pa vs. HF group (p<0.01; Table 4C); D) Cholesterol output: An approximately 74% increase in hepatic PPARγ mRNA levels was induced by high-fat diet in HF group and LXR-α, ABCA-1 showed the same changes. Treated with paeoniflorin, the changes were reversed (p<0.05; Table 4D); E) In glucose metabolic pathway, PEPCK and G6Pase mRNA levels were increased by 301% and 178%, respectively in obese mice, and were attenuated in high-fat fed mice supplemented with paeoniflorin (p<0.01; Table 4E); F) Inflammation related genes: long-term high-fat diet resulted in high expressions of liver inflammatory factors (like tumor necrosis factor-α (TNF-α), interleukin-1 (IL-1), IL-6, MCP-1). Paeoniflorin supplementation had a significant effect on the levels of inflammation related genes (p<0.05; Table 4F).
Table 4. Changes in Hepatic Expressions of Genes Involved in Glucolipid Metabolism and Inflammation
| Control | Control+Pa | HF | HF+Pa |
|---|
| A. De novo synthesis | | | | |
| SREBP-1c | 1.00±0.21 | 1.02±0.24 | 2.86±0.36** | 1.44±0.23## |
| FAS | 1.00±0.18 | 1.21±0.26 | 4.38±0.54** | 2.01±0.36## |
| ACCα | 1.00±0.07 | 1.00±0.06 | 1.7±0.12** | 0.83±0.08## |
| B. Lipid oxidation related genes | | | | |
| PPARα | 1.00±0.12 | 0.92±0.09 | 0.51±0.03** | 0.84±0.05## |
| ACOX | 1.00±0.08 | 0.97±0.07 | 0.42±0.05** | 0.85±0.07## |
| UCP2 | 1.00±0.18 | 1.07±0.16 | 3.61±0.34** | 2.14±0.21## |
| CPT-1a | 1.00±0.11 | 0.96±0.11 | 0.44±0.07** | 0.81±0.12# |
| SCD-1 | 1.00±0.14 | 1.05±0.12 | 2.11±0.21** | 1.95±0.16 |
| C. Cholesterol synthesis related genes | | | | |
| HMGCR | 1.00±0.21 | 1.16±0.26 | 2.64±0.45** | 1.61±0.22# |
| LDLR | 1.00±0.22 | 1.11±0.28 | 4.42±0.57** | 1.97±0.32## |
| D. Cholesterol output related genes | | | | |
| PPARγ | 1.00±0.07 | 1.04±0.08 | 1.74±0.08** | 1.38±0.07## |
| LXR-α | 1.00±0.10 | 0.94±0.12 | 1.51±0.08** | 1.04±0.11## |
| ABCA-1 | 1.00±0.11 | 1.11±0.17 | 1.85±0.28** | 1.22±0.12# |
| E. Glucose metabolism related genes | | | | |
| PEPCK | 1.00±0.29 | 1.23±0.28 | 4.01±0.58** | 1.93±0.47## |
| G6Pase | 1.00±0.22 | 0.96±0.28 | 2.78±0.36** | 1.46±0.29## |
| F. Inflammation related genes | | | | |
| TNF-α | 1.00±0.39 | 1.32±0.31 | 5.80±0.85** | 3.31±0.69## |
| IL-1 | 1.00±0.45 | 1.41±0.58 | 4.14±0.68** | 2.12±0.36## |
| IL-6 | 1.00±0.65 | 0.65±0.53 | 5.11±1.62** | 2.44±0.87## |
| MCP-1 | 1.00±1.13 | 1.34±0.84 | 6.64±1.26** | 3.55±1.11# |
(A) Gene expressions of SREBP-1c and target genes, which contorl the beginning synthesis way. (B) Gene expressions of lipid oxidation pathway. (C) The expressions of cholesterol synthesis related genes. (D) The expressions of cholesterol output related genes. (E) The expressions of glucose metabolism related genes. (F) Gene expressions for inflammation. Relative mRNA levels are expressed as a ratio relative to β-actin. Relative mRNA levels are expressed as mean±S.E.M. * p<0.05, ** p<0.01 vs. Control, # p<0.05, ## p<0.01 vs. HF.
DISCUSSION
The liver maintains a stable environment within the body by regulating the synthesis and decomposition of carbohydrate, lipid and protein. Injury and metabolism abnormality of liver are complementary to each other. Any reasons making the fat metabolism disorder could lead to liver fat deposition.13)
Fatty liver is not an independent disease. It is a common pathological phenomenon that a variety of diseases induce the excessive fat to deposite in hepatocyte.5,6) Mounting reports demonstrate that long-term high fat diet could cause hyperlipidemia, ectopic lipid deposition and the NAFLD.14) Therefore, early and long-term treatment is extremely important. Compared with the existing drugs, paeoniflorin has its own advantages: wide varieties of sources, low cost, simple extraction process, pleiotropic effects. Our study provided the first evidence that paeoniflorin ameliorated NAFLD in vivo. These protective effects involved multiple signaling molecules and transduction pathways. These findings supported the notion that paeoniflorin could be a promising drug for non alcohol fatty liver disease.
Our study suggested that a high-fat diet resulted in central obesity, hyperglycemia, insulin resistance, dyslipidemia, impaired liver function and hepatic steatosis. It suggested a successful animal model was established. However, paeoniflorin reduced body weight, liver index, serum glucose and increased the insulin sensitivity, which improved the liver function and ectopic lipid accumulation. Because of the different blood lipid spectrum, mice HDL is similar to human LDL and paeoniflorin effectively reduced the HDL levels of mice. The results suggested that paeoniflorin is mainly achieved by lowering cholesterol and lipid-lowering effect, little influence on triglyceride.
Therefore, to clarify the lipid lowering mechanism of paeoniflorin, we detected the target genes of lipid metabolism. Our study identitied that paeoniflorin could regulate lipid synthesis and metabolism through a variety of signaling pathways, including the de novo pathway, lipid oxidation metabolism pathway, cholesterol synthesis and output pathway etc. Long-term high-fat diet could affect the activation of SREBP-1c (sterol regulatory element-binding protein le, SREBP-1c) and PPAR-α (peroxisome proliferator-activated receptor-α).15,16) It made the SREBP-1c mRNA up-regulation and PPAR-α down-regulation, which promoted the lipid synthesis and inhibited the fatty acid oxidation. SREBP-1c is an important transcription factor, which is combined with the endoplasmic reticulum for regulating fatty acid and cholesterol synthesis.17) It has impact on the transcription of several genes involved in fatty acid and triglyceride metabolism, such as acetyl coenzyme A carboxylase (ACC), fatty acid synthase (FAS) and hard acyl coenzyme A dehydrogenase (SCD) of genes.18)
ACC is a rate-limiting enzyme for fatty acids synthesis in liver and other tissues, which could catalyze acetyl coenzyme A to Malonyl CoA (MC).19) And the inactivation of ACC decreased the activity of MC.20) MC is a fatty acid precursor. It is also an inhibitor of camitine palmitoyltransferase 1 (CPT-1) which is the rate-limiting enzyme of mitochondrial fatty acid oxidation.21) PPARα is a member of the nuclear hormone receptor family. It could control the transcriptional regulation of a series genes involved in free fatty acid oxidation, transport and output, including CPT-1, apolipoprotein gene and other genes in peroxisomal fatty acid beta oxidation pathway.22,23) Our study showed that paeoniflorin did increase the lipid oxidative metabolism, but had little effect on SCD-1, which explained the results that it cannot alleviate hypertriglyceridemia.
About 70–80% cholesterol is synthesized in liver. 3-Hydroxy-3-methyl coenzyme A reductase (HMG-CoA reductase) is the rate-limiting enzyme for cholesterol synthesis.24) Inhibiting its activity could reduce the LDL-c synthesis. But what is different is our study has found serum LDL levels decreased and LDLR gene expressions was also significantly reduced after paeoniflorin administration, which is inconsistent with the usual findings. We speculate that mammalian cells preferentially use exogenous cholesterol, although they have the ability of cholesterol synthesis. Therefore, liver LDL-R mRNA levels increased because of high cholesterol diet, which could effectively transfer excess cholesterol from the blood to the liver, and inhibit elevated blood cholesterol levels. When paeoniflorin reduces blood lipids through multiple ways, LDLR mRNA expressions were also decreased. That may be the body’s self-regulatory mechanism.
PPARγ-LXRα-ABCA-1 is an important regulatory pathway of cholesterol output.25) PPARγ agonist could induce ABCAl transcription26); Oxidative cholesterol can activate LXR for inducing ABCAl transcription; and the LXRα transcription is also affected by PPARγ.27) Our results suggest that upregulation of PPARγ expressions in high-fat diet mice might be a compensatory and self-protection mechanism12); And paeoniflorin decreased the levels of PPARγ mRNA. Paeoniflorin might restrain the PPARγ-LXRα-ABCA-1 pathway for lowering cholesterol.
We also measured the gluconeogenesis and inflammation related genes. NAFLD is often accompanied by hyperglycemia and inflammation, which has been confirmed in our early biochemical test again. Hyperglycemia is closely related to glyconeogenesis in NAFLD. PEPCK and G6Pase are rate-limiting gluconeogenic enzymes and their expressions are increased in NAFLD.28) Our study comfirmed it and paeoniflorin did effectively restrain the gluconeogenesis for hyperglycemia lowing.
Long-term hyperglycemia and hyperlipidemia is associated with a large number of inflammatory cells and factors. We found abundant inflammatory genes were over-expressed in the liver of NAFLD mice. Severe inflammation can aggravate the liver injury, cause the decline of liver function, weaken the glucolipid metabolism ability and inhibit the liver ectopic lipid deposition.29,30) Paeoniflorin could attenuate the inflammation. It means that paeoniflorin could have impact not only on glucose and lipid metabolism, but also on inflammation in the body, which protects the liver function and energy metabolism indirectly.
In conclusion, the present work showed that the paeoniflorin was effective in protecting against the development of NAFLD, which might provide the experimental basis for NAFLD clinical prevention. It could improve hyperlipidemia and ectopic deposition, inhibit the gluconeogenesis for lowing serum glucose; reducing inflammatory responses for liver function protection. Our experiments firstly confirmed that multiple pathways were involved in its anti-NAFLD effect, including the de novo pathway, lipid oxidation metabolism pathway, cholesterol synthesis and output pathway etc. Thus, paeoniflorin is a promising agent for the prevention of NAFLD; further experimental and clinical studies are required to explore the additional mechanisms and establish clinical utility.
Acknowledgment
This research was supported by the Yichang Medical Research Funds for Science and Development Project (A13301-23).
Conflict of Interest
The authors declare no conflict of interest.
REFERENCES
- 1) Hassan K, Bhalla V, Ezz El Regal M, A-Kader HH. Nonalcoholic fatty liver disease: A comprehensive review of a growing epidemic. World J. Gastroenterol., 20, 12082–12101 (2014).
- 2) Koppe SW. Obesity and the liver: nonalcoholic fatty liver disease. Transl. Res., 164, 312–322 (2014).
- 3) Wong RJ, Ahmed A. Obesity and non-alcoholic fatty liver disease: Disparate associations among Asian populations. World J Hepatol, 6, 263–273 (2014).
- 4) Corey KE, Kaplan LM. Obesity and liver disease: the epidemic of the twenty-first century. Clin. Liver Dis., 18, 1–18 (2014).
- 5) Sattar N, Forrest E, Preiss D. Non-alcoholic fatty liver disease. BMJ, 349, g4596 (2014).
- 6) Yeh MM, Brunt EM. Pathological features of fatty liver disease. Gastroenterology, 147, 754–764 (2014).
- 7) Wang QS, Gao T, Cui YL, Gao LN, Jiang HL. Comparative studies of paeoniflorin and albiflorin from Paeonia lactiflora on anti-inflammatory activities. Pharm. Biol., 52, 1189–1195 (2014).
- 8) Yu HY, Liu MG, Liu DN, Shang GW, Wang Y, Qi C, Zhang KP, Song ZJ, Chen J. Antinociceptive effects of systemic paeoniflorin on bee venom-induced various ‘phenotypes’ of nociception and hypersensitivity. Pharmacol. Biochem. Behav., 88, 131–140 (2007).
- 9) Juan YC, Tsai WJ, Lin YL, Wang GJ, Cheng JJ, Yang HY, Hsu CY, Liu HK. The novel anti-hyperglycemic effect of Paeoniae radix via the transcriptional suppression of phosphoenopyruvate carboxykinase (PEPCK). Phytomedicine, 17, 626–634 (2010).
- 10) Xiao L, Wang YZ, Liu J, Luo XT, Ye Y, Zhu XZ. Effects of paeoniflorin on the cerebral infarction, behavioral and cognitive impairments at the chronic stage of transient middle cerebral artery occlusion in rats. Life Sci., 78, 413–420 (2005).
- 11) Tan S, Li M, Ding X, Fan S, Guo L, Gu M, Zhang Y, Feng L, Jiang D, Li Y, Xi W, Huang C, Zhou Z. Effects of Fortunella margarita fruit extract on metabolic disorders in high-fat diet-induced obese C57BL/6 mice. PLoS ONE, 9, e93510 (2014).
- 12) Cong WN, Tao RY, Tian JY, Liu GT, Ye F. The establishment of a novel non-alcoholic steatohepatitis model accompanied with obesity and insulin resistance in mice. Life Sci., 82, 983–990 (2008).
- 13) Paradies G, Paradies V, Ruggiero FM, Petrosillo G. Oxidative stress, cardiolipin and mitochondrial dysfunction in nonalcoholic fatty liver disease. World J. Gastroenterol., 20, 14205–14218 (2014).
- 14) Nakamura A, Terauchi Y. Lessons from mouse models of high-fat diet-induced NAFLD. Int. J. Mol. Sci., 14, 21240–21257 (2013).
- 15) Kersten S. Mechanisms of nutritional and hormonal regulation of lipogenesis. EMBO Rep., 2, 282–286 (2001).
- 16) Terauchi Y. PPARgamma and metabolic syndrome. Rinsho Byori, 55, 447–451 (2007).
- 17) Jeon TI, Osborne TF. SREBPs: metabolic integrators in physiology and metabolism. Trends Endocrinol. Metab., 23, 65–72 (2012).
- 18) Tang XL, Deng LB, Lin JR, Zhang WL, Liu SM, Wei Y, Mei PM, Wang Y, Liang SD. Sterol regulatory element binding protein 1 and its target gene networks. Yi Chuan, 35, 607–615 (2013).
- 19) Harwood HJ Jr. Acetyl-CoA carboxylase inhibition for the treatment of metabolic syndrome. Curr. Opin. Investig. Drugs, 5, 283–289 (2004).
- 20) Brownsey RW, Boone AN, Elliott JE, Kulpa JE, Lee WM. Regulation of acetyl-CoA carboxylase. Biochem. Soc. Trans., 34, 223–227 (2006).
- 21) Wolfgang MJ, Lane MD. Hypothalamic malonyl-CoA and CPT1c in the treatment of obesity. FEBS J., 278, 552–558 (2011).
- 22) Mansour M. The roles of peroxisome proliferator-activated receptors in the metabolic syndrome. Prog. Mol. Biol. Transl. Sci., 121, 217–266 (2014).
- 23) Chen L, Yang G. PPARs integrate the mammalian clock and energy metabolism. PPAR Res., 2014, 653017 (2014).
- 24) Haines BE, Wiest O, Stauffacher CV. The increasingly complex mechanism of HMG-CoA reductase. Acc. Chem. Res., 46, 2416–2426 (2013).
- 25) Kidani Y, Bensinger SJ. Liver X receptor and peroxisome proliferator-activated receptor as integrators of lipid homeostasis and immunity. Immunol. Rev., 249, 72–83 (2012).
- 26) Afonso Mda S, Castilho G, Lavrador MS, Passarelli M, Nakandakare ER, Lottenberg SA, Lottenberg AM. The impact of dietary fatty acids on macrophage cholesterol homeostasis. J. Nutr. Biochem., 25, 95–103 (2014).
- 27) Xiao L, Wang J, Jiang M, Xie W, Zhai Y. The emerging role of constitutive androstane receptor and its cross talk with liver X receptors and peroxisome proliferator-activated receptor A in lipid metabolism. Vitam. Horm., 91, 243–258 (2013).
- 28) Bechmann LP, Hannivoort RA, Gerken G, Hotamisligil GS, Trauner M, Canbay A. The interaction of hepatic lipid and glucose metabolism in liver diseases. J. Hepatol., 56, 952–964 (2012).
- 29) Tiegs G. Cellular and cytokine-mediated mechanisms of inflammation and its modulation in immune-mediated liver injury. Z. Gastroenterol., 45, 63–70 (2007).
- 30) Samad F, Badeanlou L, Shah C, Yang G. Adipose tissue and ceramide biosynthesis in the pathogenesis of obesity. Adv. Exp. Med. Biol., 721, 67–86 (2011).