MATERIALS AND METHODS
Chemicals and ReagentsN-Methyl-N-(trimethylsilyl)trifluoroacetamide (MSTFA) and trimethylchlorosilane (TMCS) were purchased from Sigma-Aldrich (Shanghai, China). Methylhydroxylamine hydrochloride and pyridine were purchased from Aladdin Industrial, Inc. (Shanghai, China). HPLC-grade acetonitrile and n-heptane were purchased from Tedia Reagent Company (Shanghai, China).
Instrumentation and ConditionsAgilent 6890N-5975B GC/MS, HP-5MS (0.25 mm×30 m×0.25 mm), were from Agilent Company (Santa Clara, CA, U.S.A.). The GC oven was initially set at 80°C and was kept at this temperature for 5 min. The temperature was then gradually increased to 260°C at a rate of 10°C/min, and then kept at 260°C for 10 min. MS detection was conducted first in electron ionization (EI) mode with electron energy of 70 eV, then in full-scan mode with m/z of 50–550, and finally, by splitless mode injection.
Animal Treatment and Sample CollectionMale Sprague-Dawley rats, with weights of 250±20 g, were obtained from the Shanghai SLAC Laboratory Animal Co., Ltd. The animal license number was SCXK (Shanghai) 2012-0005. All thirty-eight rats were housed at Laboratory Animal Research Center of Wenzhou Medical University under the controlled conditions of a temperature of 22°C and a natural light–dark cycle. All experimental procedures were conducted according to the Institutional Animal Care Guidelines and were approved as ethical by the Administration Committee of Experimental Animals at the Laboratory Animal Center of Wenzhou Medical University.
Thirty-eight male Sprague-Dawley rats were randomly divided into two groups, the control group (n=19) and the acute paraquat poisoning group (n=19). The experimental group received a single intragastric administration (i.g.) of paraquat dissolved in 500 µL saline (36 mg/kg).9) At the same time, the control group received a single i.g. of 500 µL saline.
Serum samples were cellected from the rats from the control group and acute paraquat poisoning group at 8 : 00 a.m. after 2 d (n=19), 3 d (n=18), 4 d (n=18), 5 d (n=18), 6 d (n=17), 7 d (n=16), 8 d (n=16), 15 d (n=16), 21 d (n=16), respectively. The numbers of acute paraquat poisoning group rats are decreasing, the rats had dead due to paraquat poisoning as the days progress. The blood samples were collected and then centrifuged for 10 min at 4°C. The serum was stored at −80°C until measurement.
Sample PreparationThe 250 µL of acetonitrile was added to 100 µL of serum, kept in an ice-bath for 15 min, and then 10000×g were centrifuged for 10 min at 4°C. The 150 µL of the supernatant was transferred to a GC vial and evaporated to dryness under a stream of nitrogen gas. Methoximation was carried out at 70°C for 24 h after 50 µL of methylhydroxylamine hydrochloride (15 mg/mL in pyridine) was added. Fifty microliters of MSTFA (with 1% TMCS as the catalyst) was added and kept at 70°C for another hour, and then vortexed after adding 150 µL n-heptane.10)
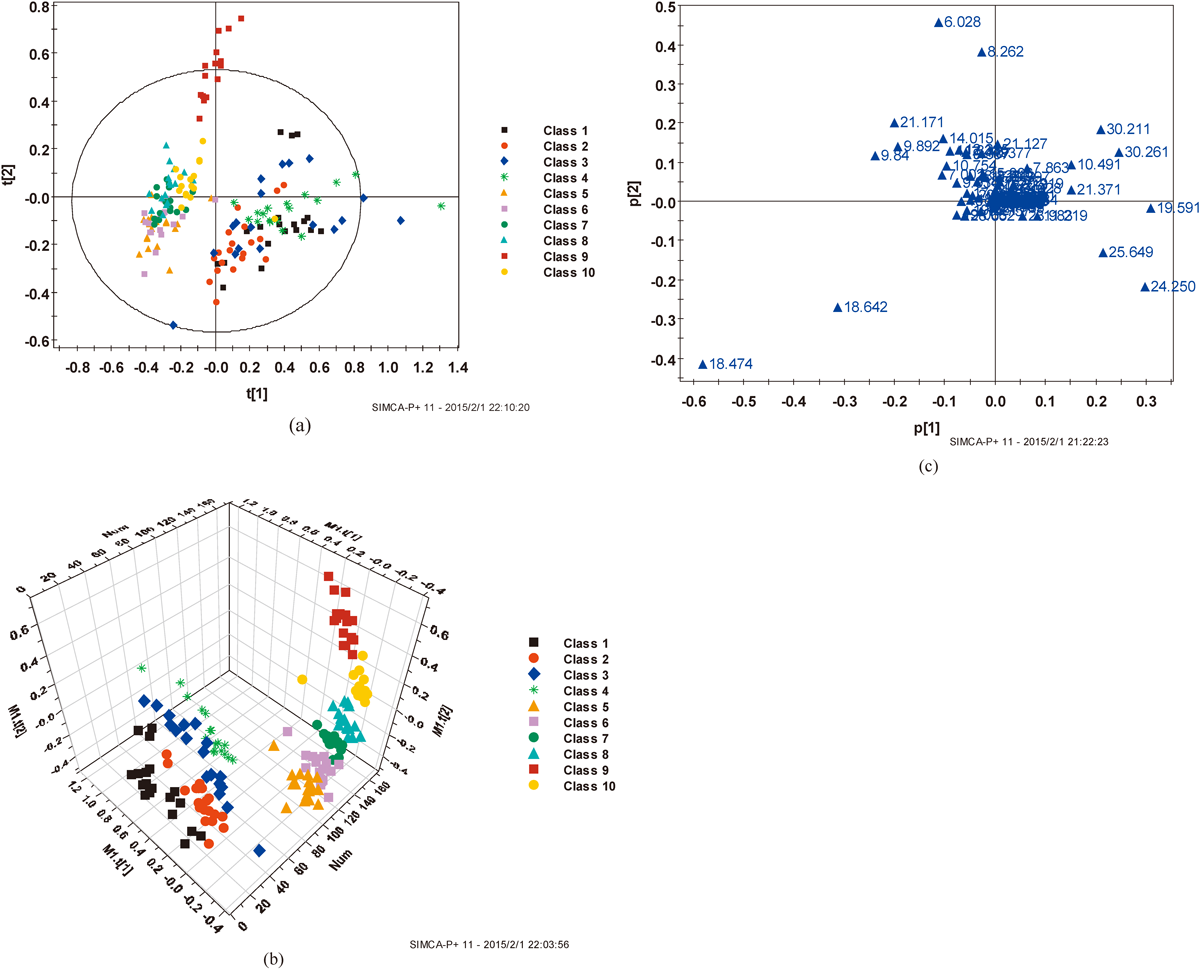
Data AnalysisThe GC/MS data was exported into Microsoft Excel, with the peaks normalized to the total sum of spectrum prior to multivariate analyses. The resulting data was processed through principal component analysis (PCA) and partial least squares discriminate analysis (PLS-DA) using SIMCA-P 11.5 software (Umetrics, Umea, Sweden). PLS-DA was used to reveal the differences in serum composition of two different groups, the corresponding loading plots, where each point represents a metabolite, were used to identify which variables contributed to the separation of the samples on the scores plot.
Statistical analysis was carried out using SPSS software (Version 13.0, SPSS). Independent samples t-test was applied in order to detect significant differences in all metabolites between two groups. A p-value of <0.05 was considered statistically significant.
RESULTS AND DISCUSSION
Analytical Characteristics of Global Profiling MethodsFigure 1 provides the typical metabolic profiles of serum acquired through GC-MS technique. Metabolic profile data pretreatment resulted in a final dataset consisting of forty-six metabolic features from GC-MS analyses. The six quality control samples first investigated the reproducibility of the metabolic features. The GC-MS analysis showed that more than 72% of the forty-six metabolic features had a CV% (coefficient of variance) of no more than 25%. The endogenous metabolites in the serum were identified using the NIST 2005 mass spectrometry database.
Metabolomics StudyMetabolomics, focusing on the low molecular weight endogenous metabolites in biological samples, is one of the newest ‘omics.’11) Metabolomics is a newly emerging omics approach to the investigation of metabolic phenotype changes induced by environmental or endogenous factors.12) It has shown promising results in healthcare fields, especially in disease diagnosis and drug-toxicity assessment, as reviewed recently.13,14) In drug-toxicity assessment, metabolomics is often concerned with finding toxicity-related biomarkers by investigating the changes in metabolic signatures induced by drug exposure.15,16)
Principal component analysis of the results of acute paraquat poisoning provided an unsatisfactory separation of data between the acute paraquat poisoning group and the control group. To improve the classification of the acute paraquat poisoning group and control group, we subsequently used a multivariate PLS-DA classification method to maximize metabolite variations and to identify the metabolites responsible for such variations.
In order to explore the metabolic profile changes of acute paraquat poisoning in rats during different time periods, we compared the GC-MS spectrum of PLS-DA of the acute paraquat poisoning group (2, 3, 4, 5, 6, 7, 8, 15, and 21 d after i.g. 36 mg/kg paraquat) with the rats in the control group (Fig. 2). Figure 2a PLS-DA score chart showed that the first principal components of the rats in the acute paraquat poisoning group (2, 3, 4, 5, 6, 7, 8, 15, and 21 d after i.g. 36 mg/kg paraquat) were not clearly distinguished from the rats in the control group, it was maybe too many data or group in 2D figure. PLS-DA 3D (Fig. 2b) score chart showed that the rats in acute paraquat poisoning group were distinguished from the rats in the control group. Metabolic trajectories after acute paraquat poisoning at 2, 3, 4, 5, 6, 7, 8, 15, and 21 d were shown in Fig. 3, the metabolic trend of acute paraquat poisoning is consistent with Fig. 2b.
Changes in MetaboliteMetabolomics comprises the measurement of endogenous metabolites, including amino acids, nucleic acid precursors, lipids, and degradation products of chemical intermediates in catabolism and biosynthesis. The advantage of metabolomics is that it provides the most functional measure of cellular status and can help to describe an organism’s phenotype.17)
In this study, the changes of metabolites between acute paraquat poisoning groups and their control group were shown in Table 1. Compared to the control group, the level of octadecanoic acid, L-serine, L-threonine, L-valine, glycerol of the acute paraquat poisoning group (36 mg/kg) increased, while the level of D-galactose decreased. Glycerol, butanoic acid, ethanimidic acid and L-proline, L-tyrosine, L-valine are metabolites of protein and fat, while D-galactose belong to metabolites of glucose, which indicated that the metabolism of protein and fat are enhanced while glucose metabolism is inhibited after paraquat poisoning.
Table 1. Summary of the Changes in Relative Levels of Metabolites in Rat Serum after Acute Paraquat Poisoning (i.g. 36 mg/kg)
| No. | Rentention time/min | Metabolite | VIP | The days after PQ poisoned |
|---|
| 2 | 3 | 4 | 5 | 6 | 7 | 8 | 15 | 21 |
|---|
| 1 | 18.474 | D-Mannose | 4.98412 | ↑** | — | — | ↑** | ↑** | ↑** | ↑** | ↑** | ↑** |
| 2 | 6.028 | Propanoic acid | 3.27477 | ↓** | ↓** | ↓* | — | — | — | — | — | — |
| 3 | 24.25 | Hexadecanoic acid | 3.1401 | ↓** | — | | ↓** | ↓** | ↓** | ↓** | ↓** | ↓** |
| 4 | 8.262 | Butanoic acid | 2.93948 | ↑** | ↑** | ↑** | — | — | — | ↑** | ↑** | ↑** |
| 5 | 18.642 | L-Tyrosine | 2.73703 | — | — | — | ↑** | ↑** | ↑** | ↑** | ↓** | ↑* |
| 6 | 21.171 | Octadecanoic acid | 2.47064 | ↑** | ↑** | ↑** | ↑** | ↑** | ↑** | ↑** | ↑** | ↑** |
| 7 | 19.591 | D-Galactose | 2.45927 | — | — | ↑** | ↓** | ↓** | ↓** | ↓** | ↓** | ↓** |
| 8 | 25.649 | Decanoic acid | 2.11397 | ↓** | — | — | ↓** | ↓** | ↓** | ↓** | ↓** | ↓** |
| 9 | 30.261 | α-D-Galactopyranoside | 1.73895 | ↓** | — | — | — | — | — | — | — | — |
| 10 | 9.892 | Urea | 1.71199 | ↓** | — | — | ↑** | ↑** | ↑** | — | — | — |
| 11 | 14.015 | L-Proline | 1.70412 | ↑** | — | — | ↑** | ↑** | ↑** | ↑** | ↑** | ↑** |
| 12 | 10.491 | Phosphate | 1.65325 | ↑** | ↑** | — | ↓** | ↓** | ↓** | ↓** | ↑** | — |
| 13 | 9.84 | Ethanimidic acid | 1.48804 | — | — | — | — | — | — | — | ↑** | ↑** |
| 14 | 11.833 | L-Serine | 1.3113 | ↑** | ↑** | ↑** | ↑** | ↑** | ↑** | ↑** | ↑** | ↑** |
| 15 | 12.235 | L-Threonine | 1.26194 | ↑** | ↑** | ↑** | ↑** | ↑** | ↑** | ↑** | ↑** | ↑** |
| 16 | 7.449 | Glycine | 1.12578 | — | ↑** | ↑* | — | ↑** | ↑** | ↑** | ↑** | ↑** |
| 17 | 9.367 | L-Valine | 1.05937 | ↑** | ↑** | ↑* | ↑** | ↑** | ↑** | ↑** | ↑** | ↑** |
| 18 | 10.081 | Serine | 1.05917 | — | — | — | — | — | — | — | — | — |
| 19 | 10.377 | Glycerol | 1.04624 | ↑** | ↑* | ↑** | ↑** | ↑** | ↑** | ↑** | ↑** | ↑** |
Note: Variable importance in the projection (VIP) was acquired from the PLS-DA model with a threshold of 1.0. Marks indicate the direction of the change, i.e., ↓ for decrease, ↑ for increase, − for no change. Compared control group with acute paraquat poisoning group (intragastric administration (i.g.) of paraquat 36 mg/kg, and serum sample collected at 2, 3, 4, 5, 6, 7, 8, 15, 21 d), * p<0.05 and ** p<0.01, as indicated by the statistical analysis t-test.
Octadecanoic acid is a saturated fatty acid with an 18-carbon chain. In terms of its biosynthesis, stearic acid is produced from carbohydrates via the fatty acid synthesis machinery via acetyl-CoA. Octadecanoic acid is less likely to be incorporated into cholesterol esters. In epidemiologic and clinical studies, octadecanoic acid was found to be associated with lowered low density lipoprotein (LDL) cholesterol in comparison with other saturated fatty acids.18)
Glycerol is a precursor for synthesis of triacylglycerols and of phospholipids in the liver and adipose tissue. When the body uses stored fat as a source of energy, glycerol, and fatty acids are released into the bloodstream. Circulating glycerol does not glycate proteins like glucose or fructose do, and does not lead to the formation of advanced glycation endproducts (AGEs). In some organisms, the glycerol component can enter the glycolysis pathway directly and, thus, provide energy for cellular metabolism.
Hexadecanoic acid is the first fatty acid produced during fatty acid synthesis and the precursor to longer fatty acids. As a consequence, hexadecanoic acid is a major body component of animals. In humans, one analysis found it to comprise 21–30% (molar) of human depot fat.19) Hexadecanoic acid negatively feeds back on acetyl-CoA carboxylase (ACC), which is responsible for converting acetyl-CoA to malonyl-CoA, which in turn is used to add to the growing acyl chain, thus preventing further palmitate generation.
Galactose is a monosaccharide. When combined with glucose (monosaccharide), through a condensation reaction, the result is the disaccharide lactose. Many speculate that it is for this reason that a pathway for rapid conversion from galactose to glucose has been highly conserved among many species. The main pathway of galactose metabolism is the Leloir pathway; humans and other species, however, have been noted to contain several alternate pathways, such as the De Ley Doudoroff pathway.
Although the critical mechanism of cell damage caused by paraquat poisoning is still unknown, it is clear that paraquat can produce the free radicals which are formed in both the mitochondria and microsome fractions. In paraquat-treated rats, the ultrastructural changes in pulmonary alveolar epithelial cells showed paraquat primary affected type II cells and with lesions first occurring in mitochondria and microsomes.20,21) Therefore, the increasing plasma levels of octadecanoic acid, L-serine, L-threonine, hexadecanoic acid may be due to the damages of the vascular cells.
As the outer membrane of cell contaminated a few microsomes, paraquat can produce oxygen radicals immediately by biotransformation when it passed through cell membranes and got inside the cells.22) Therefore, the generated oxygen radicals may increase the lipid peroxidation then damage the outer membrane, as a result, the level of octadecanoic acid increased and hexadecanoic acid decreased in plasma. When the integrity of the cell membrane was damaged, some substances were released into blood such as L-serine, L-threonine, L-mannose, butanoic acid, L-proline, and D-galactose.
Another important point is L-serine and L-threonine, they are two amino acids composed of serine/threonine protein kinase. As both of them increased simultaneously, which may indicate paraquat stimulated the expression of them. Certainly, this is only a speculation; we should do a series of works in the future to investigate that. These finding may be useful for new evidences in acute paraquat poisoning study. Additional prospective studies will be required to better understand these observations.