Abstract
The objective of the present work was to investigate the potential for pharmacokinetic drug–drug interactions between glimepiride (GMP) and piperazine dithioctate (PDT) in rats to support the development of an orally combined product of the two drugs. An LC-MS/MS bioanalytical method was developed for simultaneous quantification of GMP and thioctic acid (TA) in rat plasma. The accuracy, precision, linearity, selectivity, and recovery were all within an acceptable range. The oral plasma exposure of the GMP solution was more than 14-times greater than that of the GMP suspension at a dose of 0.5 mg/kg, suggesting a dissolution-limited absorption of the GMP suspension. Oral co-administration of PDT (72 mg/kg) with GMP suspension (0.5 mg/kg) reduced the plasma GMP exposure by approximately 80% without a significant change in t1/2 and tmax. Oral co-administration of PDT with GMP solution had no significant effect on the plasma pharmacokinetics of GMP. PDT lowered the pH (from ca. 7 to 5.6) and the dissolved GMP concentration in the GMP suspension. It was also shown that GMP was more soluble at pH 7 than at 5.7 in an aqueous solution, and the oral plasma exposure of a GMP suspension at pH 7.0 was substantially higher than that of a suspension at pH 5.7. These results suggest that the pH-dependent solubility of GMP was likely responsible for PDT’s effect on the oral absorption of GMP. In conclusion, the current work suggests a possibility of drug–drug interaction between GMP and PDT upon oral co-administration.
Glimepiride (GMP) (Fig. 1) is a medium- to long-acting oral sulfonylurea widely prescribed to treat type 2 diabetes.1) GMP lowers blood glucose by stimulating the release of insulin and by enhancing the activity of intracellular insulin receptors.2,3) GMP is rapidly and completely absorbed following oral administration, with a bioavailability close to 100% and a tmax of 2–3 h in humans.4) GMP is eliminated mainly by metabolism by CYP2C9, and the mean plasma elimination half-life (t1/2) is 5–8 h in humans.5)
Thioctic acid (TA) (Fig. 1) is an antioxidant present in prokaryotic and eukaryotic cells. It has been administered for the treatment of various oxidative stress-related diseases, including alcoholic liver disease, diabetes, glaucoma, and neurodegenerative disorders.6,7) TA can also decrease neuropathy symptoms, therefore, it has been approved as a prescription drug for the treatment of diabetic polyneuropathy, and has been frequently co-prescribed with GMP.8–11) TA also is widely available as a nutritional supplement in the United States. TA was shown to be absorbed rapidly with a tmax of 0.8 h following a single oral dose of 200 mg in humans, and its mean oral bioavailability is 29.1%, with a mean t1/2 of 0.5 h.12)
Piperadine dithioctate (PDT) (Fig. 1) is a piperazine salt of TA with physicochemical properties more suitable for formulations than TA itself. The melting points of PDT and TA are 106–107 and 58.0–62.0°C, respectively, and PDT has a substantially higher aqueous solubility than TA.13) PDT was developed as an active pharmaceutical ingredient (API) that could potentially replace TA in prescription drugs as well as nutritional supplements.14)
In this research, we investigated the pharmacokinetic drug–drug interactions between GMP and PDT using rats as an animal model to support the development of an oral combination product. A rapid and reliable LC-MS/MS bioanalytical method was developed for simultaneous quantification of GMP and TA in rat plasma.15–18) This method was applied successfully to study the plasma pharmacokinetics of GMP and TA in rats. We also conducted mechanistic studies to elucidate the pharmacokinetic interaction between GMP and PDT that has been demonstrated in this study.
MATERIALS AND METHODS
Chemicals and DrugsPDT was provided by Celltrion Chemical Research Institute (Yongin, Kyunggi-do, Korea) with a purity >99.0%. GMP, glipizide (GPZ), TA, ammonium acetate, dimethylacetamide (DMA), trifluoroacetic acid (TFA), carboxymethylcellulose (CMC), and (2-hydroxypropyl)-β-cyclodextrin (HPβCD) were purchased from Sigma-Aldrich Korea Co. (Yongin, Kyunggi-do, Korea). Thioctic acid-d5 (TA-d5) was obtained from Toronto Research Chemicals Inc. (Ontario, Canada). Ketamine hydrochloride was purchased from Yuhan Co. (Seoul, Republic of Korea). Xylazine hydrochloride was purchased from Bayer Korea Ltd. (Seoul, Republic of Korea). HPLC-grade acetonitrile and water were purchased from J. T. Baker Chemical Co. (Phillipsburg, NJ, U.S.A.).
AnimalsSpecific pathogen-free (SPF) 9-week-old male Sprague-Dawley (SD) rats were purchased from Koatech Co. (Pyeontak, Kyonggi-do, Republic of Korea). Animals were housed individually in the Korea University (KU) College of Pharmacy Animal Facility and acclimatized for 1 week in temperatures of 23–25°C, with a relative humidity of 40–70% and 12 h light/dark cycle before the study began. Animals had free access to rat chow and water. A jugular vein catheter (Braintree Scientific Inc., Braintree, MA, U.S.A.) was surgically implanted in the right jugular vein under Ketamine–Xylazine anesthesia. Animals were then allowed to recover for 4 d.
Dosing FormulationsThe doses of GMP and PDT were 0.5 and 72 mg/kg, respectively. These values were obtained by body surface area-based interspecies conversion of the human doses of GMP (5 mg) and TA (600 mg) using a conversion factor of 6.2 and human body weight of 60 kg.19) Dosing formulations were prepared at 0.05 and 7.2 mg/mL for GMP and PDT, respectively, based on 10 mL/kg dose volume. For the preparation of GMP suspension, GMP was first suspended in 0.5% (w/v) aqueous CMC or 0.1 M phosphate buffer (pH 5.7 or 7.0) containing 0.5% (w/v) CMC followed by sonication for 30 min at room temperature. The GMP/PDT suspension was prepared in the same manner using 7.2 mg/mL PDT dissolved in 0.5% (w/v) aqueous CMC. GMP solution was prepared by dissolving 5 mg/mL in DMA, which was then diluted to 0.05 mg/mL with 5% (w/v) aqueous HPβCD. GMP/PDT solution was prepared in the same manner by diluting the DMA stock solution of GMP to 0.05 mg/mL with 7.2 mg/mL PDT dissolved in 5% (w/v) aqueous HPβCD. PDT was completely soluble in both the GMP suspension and solution. PDT solutions were prepared at 7.2 mg/mL in 0.5% (w/v) aqueous CMC or 5% (w/v) aqueous HPβCD.
Pharmacokinetics StudiesAnimal studies were approved by the Institutional Animal Care and Use Committee at KU. Animals fasted overnight with free access to water were dosed via oral gavage with 10 mL/kg GMP solution, GMP/PDT solution, GMP suspension, or GMP/PDT suspension. The doses of GMP and PDT were 0.5 and 72 mg/kg, respectively. About 400 µL of serial blood samples were collected from the jugular vein catheter into BD Microtainer plasma separator tubes (BD Korea, Seoul, Republic of Korea) at time points 0, 0.25, 0.5, 0.75, 1, 2, 4, 6, 8, 10, 12, and 24 h after dosing. Animals were fed again 2 h after dosing. Blood samples were centrifuged at 6000×g for 5 min under refrigeration and stored in a freezer until analysis.
Bioanalytical MethodAn analytical method for simultaneous quantification of GMP and TA in rat plasma samples was developed using a LC-MS/MS system consisting of Agilent 1290 Infinity HPLC system equipped with vacuum degasser, binary pump, thermostatted well-plate autosampler and thermostatted column compartment (Agilent Korea, Seoul, Republic of Korea) and Agilent 6460 Triple Quadrupole LC/MS system equipped with Jet Stream ESI source (Agilent Korea). GPZ and TA-d5 were used as the internal standard (IS) for GMP and TA, respectively. Chromatographic separation was performed on a Phenomenex Luna C18 column (2.0×50 mm, 3.0 µm) with a Phenomenex SecurityGuard C18 guard column (4×20 mm) maintained at 30°C. The mobile phase consisted of 10 mM aqueous ammonium acetate (A) and acetonitrile (B): 0–2 min 5% (v/v) B, 2–3 min to 95% (v/v) B and 3–5 min 95% (v/v) B. Total run time including a 3-min equilibration time was 8 min. The flow rate was 0.4 mL/min. The injection volume was 5 µL. Detection of the analyte ions was performed in the multiple reaction monitoring (MRM) mode, monitoring the following precursor>product ion transitions: m/z 491>352 and 446>321 in the positive ion mode for GMP and GPZ (IS), respectively, and m/z 205>171 and 210>174 in the negative ion mode for TA and TA-d5 (IS), respectively. The source parameters, gas temperature (°C), gas flow (L/min), nebulizer (psi), and ion spray voltage (kV) were set at 350, 12, 45, and 3.5, respectively. The dwell time was set at 50 ms for each transition. The fragmentor voltage was set at 135, 135, 100, and 100 for GMP, GPZ, TA, and TA-d5, respectively. The collision energy was set at 8, 8, 5, and 5 for GMP, GPZ, TA, and TA-d5, respectively.
Stock solutions of the analytes were prepared at 1 mg/mL in acetonitrile and stored in a freezer until use. Working solutions were prepared by diluting the stock solutions in 50% aqueous acetonitrile. Standard and quality control (QC) samples were prepared by spiking 45 µL of rat plasma with 5 µL of the working solutions containing GMP and TA. Each 45-µL aliquot of the plasma samples from rat pharmacokinetics studies was added with 5 µL of 50% (v/v) aqueous acetonitrile to match the matrix with the standard and QC samples. Each of these plasma samples were added with 250 µL of acetonitrile containing 100 ng/mL GPZ and TA-d5 as the IS for GMP and TA, respectively. The mixtures were then vortexed for 10 min followed by a 10-min sonication. After refrigeration for 1 h, the mixtures were centrifuged for 20 min at 2063×g. The supernatant (230 µL) was then transferred to an 8-strip well plate and evaporated at 40°C under vacuum. The residue was reconstituted with 150 µL of 50% (v/v) aqueous acetonitrile and centrifuged for 20 min at 2063×g, and 130 µL of the supernatant were transferred to a 96 well plate for LC-MS/MS analysis.
Calibration curves were constructed in the concentration ranges 0.78–50 ng/mL (7 levels) and 31.25–4000 ng/mL (8 levels) for GMP and TA, respectively. Linearity of the analytical method was assessed by the correlation coefficient (r2) of linear calibration curves. The lower limit of quantification (LLOQ) was established as the lowest calibration standard giving an acceptable accuracy and precision. The analyte peak area at LLOQ was greater than 5 times that of a blank plasma sample. Signal-to-noise ratio (SNR) of the analyte peak at LLOQ, calculated using route mean square (RMS) noise, was >10. Three levels of QC samples prepared for each analyte were used to assess accuracy and precision of the assay: 2, 10, and 40 ng/mL for GMP and 100, 500, and 3000 ng/mL for TA. Accuracy was assessed by relative error (%RE) of the observed concentrations of the QC samples from their nominal concentrations. A %RE of ±15% at each level of the QC samples was considered acceptable except for LLOQ (±20%). Precision was determined by analyzing each QC samples 5 times in a single run or in three consecutive days, and the coefficient of variation (%CV) of ±15% at each level of the QC samples was considered acceptable except for the LLOQ (±20%). Recovery was determined as % of the analyte peak area of the QC samples versus those in pure solutions prepared in deionized water.
Solubility of GMP in Dosing FormulationsGMP suspensions and solutions were prepared at 0.05 mg/mL in the absence or presence of PDT (7.2 mg/mL) as described above. They were filtered using Whatman Mini-Uniprep™ filter (PTFE membrane, 0.45 µm). The filtrate was mixed with same volume of 50% (v/v) aqueous acetonitrile before analysis. The Agilent 1290 Infinity HPLC system equipped with a vacuum degasser, quaternary pump, thermostatted column compartment, thermostatted autosampler, and a diode array detector was used for sample analysis. Chromatographic separation was achieved on an Agilent Zorbax Eclipse Plus C18 column (4.6×100 mm, 3.5 µm) maintained at 45°C. The gradient elution was run at 1.0 mL/min with a mixture of 0.1% (v/v) TFA in water (A) and 0.1% (v/v) TFA in acetonitrile (B): 0–1.5 min 5% (v/v) B, 1.5–6 min to 95% (v/v) B, and 6–10 min 95% (v/v) B. Total run time, including a 3 min equilibration time, was 13 min. The injection volume was 5 µL, and the detector was set at 230 nm.
Data Analysis and StatisticsPharmacokinetic parameters were calculated by noncompartmental analysis using PK Solver.20) The apparent terminal elimination rate constant (λ) was estimated by regression of the terminal log-linear portion of the plasma concentration–time profiles; t1/2 was calculated as the quotient of ln(2) and λ. Onset of the terminal log-linear phase was determined by visual inspection. Area under the plasma concentration–time curve (AUC) was calculated using the linear trapezoidal method. Cmax and tmax were obtained by visual inspection of the plasma concentration data. Statistical analysis was carried out by one-way ANOVA with Bonferroni post-hoc test using GraphPad Prism version 4.00 for Windows (GraphPad Software Inc., San Diego, CA, U.S.A.). A p<0.05 was considered to be significant.
RESULTS
Development of Bioanalytical MethodA bioanalytical method for simultaneous quantification of GMP and TA in rat plasma was developed using a LC-electrospray ionization (ESI)-MS/MS system. Representative full scan and product ion mass spectra are shown in Fig. 2. GMP ionized efficiently under positive ion mode, yielding the [M+H]+ and [M+Na]+ ions at m/z 491.1 and 513.1, respectively. GPZ, the IS for GMP, yielded the [M+H]+, [M+Na]+, and [M+K]+ ions at m/z 446.2, 468.2 and 484.1, respectively. TA and TA-d5 (IS) ionized under negative ion mode, yielding the [M−H]− ions at m/z 205.1 and 210.1, respectively. The quasi-molecular ion for each analyte was selected as the precursor ion for MS/MS analysis and the most abundant product ion as the quantifier ion for MRM analyses: m/z 491>352, 446>321, 205>171, and 210>174 for GMP, GPZ, TA, and TA-d5, respectively. Representative MRM chromatograms are shown in Fig. 3. No significant endogenous interfering peaks for the analytes were observed in the chromatograms of the blank rat plasma. All the calibration curves were found to be linear in the calibration ranges (i.e., 0.78–50 and 31.25–4000 ng/mL for GMP and TA, respectively) with r2>0.99. The LLOQ was 0.78 and 31.25 ng/mL for GMP and TA, respectively. The assay accuracy expressed as %RE ranged from −0.4–3.8% and −5.5–0.6% for GMP and TA, respectively. The assay precision expressed as %CV ranged from 1.9–9.5% and 1.4–6.4% for GMP and TA, respectively. The recovery ranged 89.7–100.4% and 92.0–96.8% for GMP and TA, respectively.
Effect of PDT Co-administration on the Pharmacokinetics of GMP Following a Single Oral Dose in RatsThe effect of PDT co-administration (72 mg/kg) on the pharmacokinetics of GMP was studied following a single oral dose of GMP (0.5 mg/kg) as a suspension or solution in rats. GMP solution could not be prepared in water containing as much as 10% (v/v) co-solvent such as DMA due to its poor aqueous solubility. It was, therefore, prepared in 5% (w/v) aqueous HPβCD solution despite the fact that the formation of HPβCD inclusion complex could affect the absorption of GMP. The plasma exposure (i.e., Cmax and AUC) of GMP was significantly greater (p<0.05) when dosed as a solution than as a suspension (Table 1; Fig. 4A), suggesting dissolution-limited absorption of GMP when given as a suspension. The oral plasma exposure of GMP decreased significantly (p<0.05) when the suspension was co-administered with PDT (Table 1, Fig. 4A). No significant changes (p>0.05) were observed in other pharmacokinetic parameters such as t1/2 and tmax (Table 1). When GMP was given as a solution, the co-administration of PDT had no significant effect on the plasma concentration-time profile (Fig. 4A) and the pharmacokinetic parameters of GMP (Table 1).
Table 1. Pharmacokinetic Parameters of GMP in Rats Following a Single Oral Dose GMP Alone or in Combination with PDT
| Parameter (unit) | GMP suspension | GMP solution |
|---|
| −PDT | +PDT | −PDT | +PDT |
|---|
| tmax (h) | 1.7±0.5 | 1.3±0.5 | 1.1±0.6 | 0.8±0.4 |
| Cmax (ng/mL) | 20.2±1.1 | 4.4±0.7* | 492.6±147.6* | 389.3±140.9# |
| AUClast (ng·h/mL) | 76.3±21.1 | 14.3±4.6* | 1074.6±250.0* | 960.9±313.1# |
| AUCinf (ng·h/mL) | 86.3±22.4 | 16.4±4.5* | 1092.2±249.0* | 1097.4±317.8# |
| t1/2 (h) | 3.3±1.0 | 2.2±1.3 | 2.0±1.1 | 3.4±1.0 |
| N | 9 | 4 | 8 | 8 |
GMP was dosed orally at 5 mg/kg as a suspension in 0.5% (w/v) aqueous CMC or as a solution in DMA/5% (w/v) aqueous HPβCD (1 : 99, v/v) alone or in combination with 72 mg/kg PDT. PDT was soluble in both the GMP suspension and the solution. Statistical significance was assessed by one-way ANOVA: * Significantly different (p<0.05) versus the group dosed with GMP suspension alone, # Significantly different (p<0.05) versus the group dosed with GMP suspension+PDT. Data are mean±S.D.
The effect of co-administration of GMP (0.5 mg/kg) suspension or solution on the pharmacokinetics of TA was studied following a single oral dose of PDT (72 mg/kg) in rats. No significant differences (p>0.05) were observed in the plasma pharmacokinetic profiles of TA whether PDT was dosed in the vehicle used for the GMP suspension [0.5% (w/v) aqueous CMC] or solution [DMA/5% (w/v) aqueous HPβCD=1/99 (v/v)] (Table 2, Fig. 4B). Co-administration of GMP given either as a suspension or a solution had no significant effect (p>0.05) on the plasma concentration–time profile (Fig. 4B) and the pharmacokinetic parameters of TA (Table 2), except that the tmax was slightly longer (p<0.05) when PDT was co-administered with GMP solution compared with other cases (Table 2).
Table 2. Pharmacokinetic Parameters of TA in Rats Following a Single Oral Dose PDT Alone or in Combination with GMP
| Parameter (unit) | GMP suspension | GMP solution |
|---|
| −GMP | +GMP | −GMP | +GMP |
|---|
| tmax (h) | 0.3±0.2 | 0.3±0.1 | 0.3±0.1 | 0.6±0.3* # |
| Cmax (ng/mL) | 2520.9±1083.8 | 3141.3±1310.4 | 2752.3±1730.4 | 2042.4±979.5 |
| AUClast (ng·h/mL) | 2242.0±908.2 | 2387.0±707.9 | 2590.1±1389.7 | 2506.9±1147.4 |
| AUCinf (ng·h/mL) | 2350.7±868.2 | 2663.4±1005.1 | 2754.6±1356.8 | 2651.3±1062.2 |
| t1/2 (h) | 1.5±0.5 | 3.9±3.7 | 1.8±1.6 | 1.8±2.1 |
| N | 8 | 9 | 10 | 8 |
PDT was dosed orally at 72 mg/kg in 0.5% (w/v) aqueous CMC or DMA/5% (w/v) aqueous HPβCD (1 : 99, v/v) alone or in combination with 0.5 mg/kg GMP. GMP was given as a suspension in 0.5% (w/v) aqueous CMC or as a solution in DMA/5% (w/v) aqueous HPβCD (1 : 99, v/v). PDT was soluble in both vehicles. Statistical significance was assessed by one-way ANOVA: * Significantly different (p<0.05) versus the group dosed with PDT alone in the vehicle for GMP solution, #Significantly different (p<0.05) versus the group dosed with PDT+GMP suspension. Data are mean±S.D.
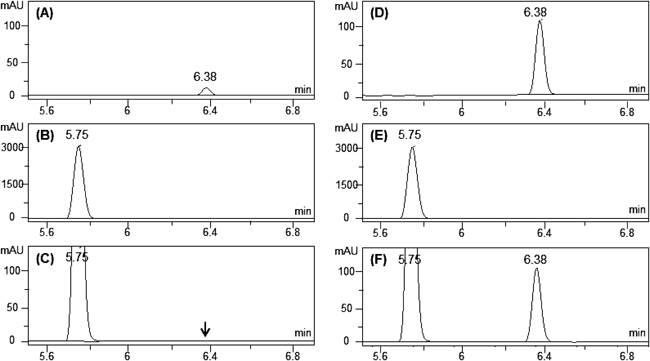
Dosing formulations for the rat pharmacokinetics studies were analyzed with a HPLC/UV system to see if PDT affected the solubility of GMP. GMP suspensions were prepared at 0.05 mg/mL in the absence or presence of 7.2 mg/mL PDT (6.0 mg/mL as TA) using 0.5% (w/v) aqueous CMC as the vehicle. GMP solutions were prepared at the same concentration using DMA 5% (w/v) aqueous HPβCD (1/99, v/v). PDT was soluble in both vehicles. The pH values of the vehicles were 6.82–6.87, which remained unchanged in the GMP suspension and solution prepared without PDT. The pH values dropped significantly (p<0.05) to 5.57–5.58 in all the dosing formulations containing PDT (i.e., PDT alone, GMP suspension+PDT, and GMP solution+PDT). Each dosing formulation was then filtered with 0.45 µm PTFE membrane and the filtrate was analyzed by a HPLC/UV system. Representative HPLC/UV chromatograms of the dosing formulations are shown in Fig. 5, with the peaks for GMP and TA appearing at 6.38 and 5.75 min, respectively. The peak area of GMP suspension was about 1/10 of the solution (Fig. 5A, 5D), indicating that GMP was incompletely dissolved in the suspension; the concentration of GMP in the suspension was ca. 4.8 µg/mL. GMP was undetectable (i.e., <0.2 µg/mL) when PDT was dissolved together in the GMP suspension (Fig. 5C). PDT, on the other hand, had no significant effect on the GMP solubility in the solutions as the peak areas remained unchanged in the absence and presence of PDT (Figs. 5D, 5F). No significant differences were observed among the peak areas of TA in all dosing formulations containing PDT (Figs. 5B–D, F).
Effect of pH of Dosing Suspensions on the Pharmacokinetics of GMP Following a Single Oral Dose in RatsGMP suspensions were prepared at 0.05 mg/mL in pH 5.7 or 7.0 phosphate buffer each containing 0.5% (w/v) CMC. The solubility of GMP was then determined, as described above, by HPLC/UV analysis following filtration. The peak area of GMP in the suspension at pH 7.0 was 99.8±9.8 mAU·s (n=3), which is significantly greater than the peak area of the pH 5.7 buffer, which was 43.7±8.7 mAU·s (n=3). These results suggest that the solubility of GMP was about 2-fold lower at pH 5.7 than at pH 7.0. The plasma pharmacokinetics of GMP was then determined following a single oral dose of GMP suspensions prepared in pH 5.7 or 7.0 phosphate buffer in rats. The GMP plasma level was maintained above the LLOQ for 8 h following a dose of the suspension at pH 7.0, which allowed us to determine the pharmacokinetic parameters (Table 3, Fig. 6). The plasma concentration of GMP in the suspension at pH 5.7 was all below the LLOQ during the entire sampling period after the dose was administered (Table 3, Fig. 6).
Table 3. Pharmacokinetic Parameters of GMP in Rats Following a Single Oral Dose of GMP Suspension Prepared in pH 7.0 or 5.7 Phosphate Buffer Containing 0.5% (w/v) CMC
| Parameter (unit) | pH 7.0 | pH 5.7 |
|---|
| tmax (h) | 1.8±0.5 | ND |
| Cmax (ng/mL) | 19.7±2.8 | ND |
| AUClast (ng·h/mL) | 57.1±4.3 | ND |
| AUCinf (ng·h/mL) | 63.8±7.3 | ND |
| t1/2 (h) | 1.7±0.2 | ND |
| N | 4 | 4 |
GMP was given orally at 0.5 mg/kg as a suspension in pH 5.7 or 7.0 phosphate buffer containing 0.5% (w/v) CMC. ND: not determined due to low plasma levels (i.e., plasma GMP concentrations were all below LLOQ). Data are mean±S.D.
DISCUSSION
A LC-MS/MS bioanalytical method has been developed for simultaneous quantification of GMP and TA in rat plasma in the current study. The accuracy, precision, linearity, selectivity, and recovery of the developed bioanalytical method were all within acceptable ranges. This method was successfully applied to the pharmacokinetic studies of the analytes after the oral administration of the GMP and PDT to rats.
Our current work has shown that the absorption of GMP following oral dosing as a suspension was significantly limited by dissolution in the rat’s gastrointestinal tract. The co-administration of PDT with GMP suspension decreased the plasma exposure (as represented by the plasma Cmax and AUC) by 80% following oral dosing, which was likely caused by a decrease in the oral absorption of GMP since the disposition kinetics (represented by the t1/2) were not significantly affected by the co-administration of PDT. We then compared the dissolved concentration of GMP in the suspensions prepared with or without PDT to see if GMP’s dissolution decreased. Our results showed that PDT significantly lowered the dissolved concentration of GMP in the suspensions, suggesting that the decreased oral absorption of GMP suspension was likely due to its lower solubility in the dosing formulation.
Our studies also showed that PDT lowered the pH of GMP suspension from 7 to 5.6, and the GMP solubility was decreased by a similar pH change. This suggests that the decrease in the oral absorption of the GMP suspension by PDT co-administration was likely due to the GMP’s decreased solubility, which was caused by a pH change in the dosing formulation. GMP is a weak acid (pKa=6.2) and practically insoluble in water.21) These results demonstrate that GMP would be more soluble in an aqueous solution at a neutral or basic pH, which is consistent with our results.
To see if the pH-dependent solubility of GMP was responsible for the PDT’s effect on the oral absorption of GMP, we studied the effect of the pH change (caused by PDT) on the solubility and oral pharmacokinetics of GMP in the rat. As expected, GMP was more soluble at pH 7 than at 5.7 in an aqueous solution. Furthermore, the oral plasma exposure of GMP suspension at pH 7 was shown to be substantially higher than that of suspension at pH 5.7 in the rat.
Although the clinical relevance and implication of our findings remains to be demonstrated due to differences in the physiological conditions in the gastrointestinal tract between rat and human, the results of the current study suggest a possibility for a potential interaction between GMP and PDT in the intestinal absorption in human.
In summary, a reliable LC-MS/MS bioanalytical method for simultaneous quantification of GMP and TA has been developed and successfully applied to pharmacokinetics studies of the drugs in rats. Our results demonstrated a pharmacokinetic drug–drug interaction between GMP and PDT upon oral co-administration in the rat, which may be relevant for combination oral solid dosage products of the two drug substances.
Acknowledgments
This work was supported in part by Leading Industry Development Program for Chungcheong Economic Region, Ministry of Knowledge and Economy, and Basic Science Research Program through the National Research Foundation of Korea (NRF) funded by the Ministry of Science, ICT & Future Planning (Grant No. NRF-2014R1A4A1007304).
Conflict of Interest
The authors declare no conflict of interest.
REFERENCES
- 1) McCall AL. Clinical review of glimepiride. Expert Opin. Pharmacother., 2, 699–713 (2001).
- 2) Moon JS, Ha KS, Yoon JS, Lee HW, Lee HC, Won KC, BETA study group. The effect of glargine versus glimepiride on pancreatic β-cell function in patients with type 2 diabetes uncontrolled on metformin monotherapy: open-label, randomized, controlled study. Acta Diabetol., 51, 277–285 (2014).
- 3) Leclercq-Meyer V, Akkan AG, Marchand J, Malaisse WJ. Effects of glimepiride and glibenclamide on insulin and glucagon secretion by the perfused rat pancreas. Biochem. Pharmacol., 42, 1634–1637 (1991).
- 4) Malerczyk V, Badian M, Korn A, Lehr KH, Waldhausl W. Dose linearity assessment of glimepiride (Amaryl) tablets in healthy volunteers. Drug Metabol. Drug Interact., 11, 341–357 (1994).
- 5) Rosenkranz B, Profozic V, Metelko Z, Mrzljak V, Lange C, Malerczyk V. Pharmacokinetics and safety of glimepiride at clinically effective doses in diabetic patients with renal impairment. Diabetologia, 39, 1617–1624 (1996).
- 6) Biewenga GP, Haenen GR, Bast A. The pharmacology of the antioxidant lipoic acid. Gen. Pharmacol., 29, 315–331 (1997).
- 7) Packer L, Witt EH, Tritschler HJ. α-Lipoic acid as a biological antioxidant. Free Radic. Biol. Med., 19, 227–250 (1995).
- 8) Khamaisi M, Rudich A, Potashnik R, Tritschler HJ, Gutman A, Bashan N. Lipoic acid acutely induces hypoglycemia in fasting nondiabetic and diabetic rats. Metabolism, 48, 504–510 (1999).
- 9) Wiznitzer A, Ayalon N, Hershkovitz R, Khamaisi M, Reece EA, Trischler H, Bashan N. Lipoic acid prevention of neural tube defects in offspring of rats with streptozocin-induced diabetes. Am. J. Obstet. Gynecol., 180, 188–193 (1999).
- 10) Evans JL, Goldfine ID. α-Lipoic acid: a multifunctional antioxidant that improves insulin sensitivity in patients with type 2 diabetes. Diabetes Technol. Ther., 2, 401–413 (2000).
- 11) Haak E, Usadel KH, Kusterer K, Amini P, Frommeyer R, Tritschler HJ, Haak T. Effects of α-lipoic acid on microcirculation in patients with peripheral diabetic neuropathy. Exp. Clin. Endocrinol. Diabetes, 108, 168–174 (2000).
- 12) Teichert J, Hermann R, Ruus P, Preiss R. Plasma kinetics, metabolism, and urinary excretion of α-lipoic acid following oral administration in healthy volunteers. J. Clin. Pharmacol., 43, 1257–1267 (2003).
- 13) Kim KS PY, Song HN, Lee IS, Kim JW. PCT/KR2010/003954 Patent (2010).
- 14) Kim K, Shin DS, Kwon HJ, Park YJ, Cho K, Yu KW, Lee IS, Noh J, Song HN, Kim DY, Kim JW. PCT/KR2011/004004 Patent (2011).
- 15) Salem II, Idrees J, Al Tamimi JI. Determination of glimepiride in human plasma by liquid chromatography-electrospray ionization tandem mass spectrometry. J. Chromatogr. B Analyt. Technol. Biomed. Life Sci., 799, 103–109 (2004).
- 16) Chakradhar L, Kallem R, Karthik A, Sundari BT, Ramesh S, Mullangi R, Srinivas NR. A rapid and highly sensitive method for the determination of glimepiride in human plasma by liquid chromatography-electrospray ionization tandem mass spectrometry: application to a pre-clinical pharmacokinetic study. Biomed. Chromatogr., 22, 58–63 (2008).
- 17) Durrani AI, Schwartz H, Schmid W, Sontag G. α-Lipoic acid in dietary supplements: Development and comparison of HPLC-CEAD and HPLC-ESI-MS methods. J. Pharm. Biomed. Anal., 45, 694–699 (2007).
- 18) Chng HT, New LS, Neo AH, Goh CW, Browne ER, Chan EC. A sensitive LC-MS/MS bioanalysis assay of orally administered lipoic acid in rat blood and brain tissue. J. Pharm. Biomed. Anal., 51, 754–757 (2010).
- 19) Food and Drug Administration. Guidance for Industry. Estimating the maximum safe starting dose in initial clinical trials for therapeutics in adult healthy volunteers. FDA (2005).
- 20) Zhang Y, Huo M, Zhou J, Xie S. PKSolver: An add-in program for pharmacokinetic and pharmacodynamic data analysis in Microsoft Excel. Comput. Methods Programs Biomed., 99, 306–314 (2010).
- 21) Ahad HA, Sreeramulu J, Hima Bindu V. Design and evaluation of sustained release matrix tablets of glimepiride based on combination of natural and synthetic polymers. Int. J. Appl. Biol. Pharm. Technol., 1, 770–777 (2010).