Regular Articles
Use of Flow Cytometry for Quantitative Analysis of Metabolism of Viable but Non-culturable (VBNC) Salmonella
2015 Volume 38 Issue 9 Pages 1255-1264

Details
2015 Volume 38 Issue 9 Pages 1255-1264
A simple and rapid assay method for analysis of the metabolic activity of viable but non-culturable (VBNC) Salmonella was established. An environmental isolate of Salmonella Enteritidis (SE), grown to the logarithmic phase, rapidly lost its culturability during incubation with 1–10 mM H2O2 in Luria–Bertani (LB) medium. To assess the viability of the bacteria, we measured 3 different metabolic activities: Respiratory activity by 5-cyano-2,3-ditolyl-tetrazolium chloride (CTC) reduction, glucose uptake assessed with 2-[N-(7-nitrobenz-2-oxa-1,3-diazol-4-yl)amino]-2-deoxyglucose (2-NBDG), and DNA synthesis activity evaluated by 5-ethynyl-2′-deoxyuridine (EdU) incorporation. These activities were analyzed by both confocal laser-scanning microscopy and flow cytometry, together with colony-formation assays on LB-agar plates. The results showed that some of the H2O2-treated SE cells were in the VBNC state and that the extent of H2O2-induced decrease in each metabolic activity varied according to the activity. That is, glucose-uptake activity was not markedly changed, being kept at the highest level; whereas the respiratory activity was less than that of the glucose-uptake, and DNA synthesis activity was the lowest among them. These results suggest that the VBNC state might be characterized by different metabolic activities that vary and correspond to the kind and strength of the stress, threatening bacterial survival in an adverse environment.
Salmonella is one of the most frequent causes of food-borne diseases in Japan, and is detected not only in food but also in the natural environment, such as air-borne dust, manure, river water, soil, and so on.1–5) Among Salmonella spp., Salmonella enterica serovar Enteritidis (SE) is a common cause of salmonellosis and sometime causes mass food poisoning in Japan6) and the United States,1) although fatalities due to salmonellosis are relatively low. In consideration of the strong infectivity of Salmonella to the host, a better understanding and an appropriate risk management of environmental Salmonella would seem to be necessary for controlling the spreading of Salmonella to foods in general.
Since Colwell et al. first reported their pioneering study showing the existence of viable but non-cuturable (VBNC) bacteria,7) many researchers have reported on the physiology of these VBNC bacteria. Also, results have been published concerning experimental conditions that might induce VBNC bacteria, such as low temperature and nutritional starvation,8–10) osmotic shock,11,12) oxidative stress,13,14) sunlight exposure,15) etc. Nowadays, the VBNC phenomenon is recognized as one of the physiological states, other than spore formation, of certain bacteria that survive under a stressful environment.16–18)
Various methods for detection of VBNC bacteria have been developed. For example, the direct viable counting method detects protein-synthesizing bacteria in the presence of yeast extract and nalidixic acid, the former promoting protein synthesis and the latter inhibiting cell division.19) This method seems suitable for microscopic analysis to detect viable cells, because only viable cells can “elongate but not duplicate.” However, 6 or more hours are needed to obtain suitable results. Another method utilizes 5-cyano-2,3-ditolyl-tetrazolium chloride (CTC) reduction,20,21) which is a way to detect respiratory-active cells within a shorter time. This method involves the reduction of non-fluorescent CTC to fluorescent formazan by succinate dehydrogenase and subsequent detection of the latter by epifluorescence microscopy or flow cytometry. Yet another one is a genetic-based method using reverse-transcriptase polymerase chain reaction (PCR) techniques.22–25) Since the half-life of most bacterial mRNAs is only 3–5 min,26) continuous expression of certain target mRNAs by viable cells seems to be an indicator of viability. The combination of PCR and propidium monoazide is effective for excluding amplification of cDNAs from mRNAs of dead and membrane-compromised bacteria.23,25) The most popular method is the SYTO 9/propidium iodide (PI) double-staining method, which detects intact bacterial cell membranes27,28) and is commercially available as BacLight Bacterial viability kit (Invitrogen™, Life Technologies).
We previously reported the combination of a CTC-reduction assay and confocal laser scanning microscopy as a method for evaluating the induction and resuscitation of VBNC Salmonella cells.14) This method is suitable for the visual estimation of an individual cell being either viable or dead, although much time is required to analyze a sufficient number of samples, especially for enumeration of bacterial cells.
In this paper, we report an easier and more rapid method using flow cytometric analysis for analysis of VBNC cells treated with hydrogen peroxide (H2O2). Three kinds of metabolic activities were assayed: respiratory activity determined with CTC-reduction, glucose-uptake activity assessed by 2-[N-(7-nitrobenz-2-oxa-1,3-diazol-4-yl)amino]-2-deoxyglucose (2-NBDG) uptake, and DNA synthesis activity evaluated in terms of 5-ethynyl-2′-deoxyuridine (EdU) incorporation. The results showed that this new method was easy and rapid, yielding reproducible results. Our findings also suggested the presence of cells in different stages in a VBNC cell population, which stages were dependent on the strength of the stress.
An environmental isolate of S. Enteritidis (SE) clone, SE Cl#15-1, obtained from CAF Laboratories29) (Hiroshima, Japan), was used throughout this study. The bacteria were cultured overnight in 10 mL of Luria–Bertani (LB) medium (Difco™, Becton, Dickinson and Company, Franklin Lakes, NJ, U.S.A.) in a 50-mL tube at 37°C, with shaking at 150 strokes/min and then suspended in fresh LB medium at OD550 of 0.05. Optical density was measured with a UV-150-02 spectrophotometer (Shimadzu, Kyoto, Japan). Thereafter they were incubated at 37°C with shaking at 150 strokes/min for 105 min until the growth had reached the mid-logarithmic phase. The cultured bacteria were harvested by centrifugation at 2850×g for 20 min in a swing rotor-equipped KUBOTA 8920 centrifuge (KUBOTA Corporation, Tokyo, Japan) at 4°C, then washed twice with 10 mL of ice-cold phosphate-buffered saline without calcium and magnesium, pH 7.5, phosphate buffered saline (PBS) (−), and finally suspended in ice-cold PBS (−) at OD550 of 6.30 (approximately 1×10⁹ cfu/mL).
Exposure to Oxidative StressThe cultured bacteria were suspended in a 50-mL tube containing 10 mL of fresh LB medium to which H2O2 (Wako Pure Chemical Industries, Ltd., Osaka, Japan) had been added at a final concentration of 1–10 mM. The cells (1×10⁷ cfu/mL) were then incubated at 37°C for 60 min, with shaking at 150 strokes/min, for exposure to the oxidative stress. After incubation, 30 mL of ice-cold PBS (−) was added to the cells, which were then chilled on ice to stop further stress. Next, the bacteria were harvested by centrifugation as described above, and subsequently resuspended in 10 mL of ice-cold PBS (−). A 100-µL aliquot of each sample was taken for the evaluation of culturability. For further analysis, the remainder of each sample was concentrated by centrifugation at 18100×g for 5 min at 4°C in an angle rotor-equipped TOMY MX-160 centrifuge (Tomy Seiko, Tokyo, Japan), and the cells were then resuspended in 1 mL of fresh M9 minimal medium (Difco™) without glucose.
Colony-Formation Assay for the Evaluation of CulturabilityH2O2-treated SE cells were serially diluted with ice-cold PBS (−), and 25-µL aliquots of them were plated onto LB-agar plates, which were then incubated at 37°C overnight. The number of resultant colonies was counted as colony-forming unit (cfu), which was used as an indicator of culturability.
CTC-Reduction Assay for the Evaluation of Respiratory ActivityThe CTC-reduction assay was performed with the reagents of a Bacstain CTC Rapid Staining Kit (Dojindo, Kumamoto, Japan) according to the manufacturer’s protocol. CTC reduction is an indicator of bacterial aerobic respiration.20,21) In this assay, H2O2-treated SE cells were stood still for 60 min in an incubator at 37°C with the reagents of a Bacstain CTC Rapid Staining Kit for flow cytometry. They were then washed with 500 µL of PBS (−) by centrifugation at 18100×g for 5 min at 4°C. Then the resultant cell pellet was fixed by resuspending the cells in 1 mL of 4% (w/v) paraformaldehyde/PBS (−) (Wako Pure Chemical Industries, Ltd.) on ice and stood for 30 min. After fixation, the cells were centrifuged as described above to remove the fixative and resuspended again in 1 mL FACS Buffer composed of PBS (−), 0.05% (w/v) bovine serum albumin (BSA), and 0.1% (w/v) sodium azide, and then analyzed by flow cytometry.
The cells were also processed for microscopic observation by using a microscopy-optimized staining reagent (Bacstain CTC Rapid Staining Kit for microscopy, Dojindo). Several different procedures were needed, including removal of staining solution, resuspending the cells in 40 µL of PBS (−), and placing the cells into the wells of a sterile, poly-L-lysine-coated 8-well glass slide. The cells were allowed to adhere to the glass slide by being stood for 30 min on ice, and then they were fixed with 40 µL of 4% (w/v) paraformaldehyde/PBS (−) on ice for 30 min. Cellular DNA was stained with 5 µL of 20 µg/mL DAPI (4′,6-diamino-2-phenylindole lactate; Sigma-Aldrich), after which the slide was rinsed twice with PBS (−). Perma Fluor Mountant Medium (ThermoFisher Scientific, Waltham, MA, U.S.A.) was then applied to the slide, which was sealed with a cover glass.
2-NBDG Uptake Assay for the Evaluation of Glucose-Uptake Activity2-NBDG (Life Technologies, Carlsbad, CA, U.S.A.) uptake was assayed to estimate the glucose uptake activity of the H2O2-treated SE cells. In this assay, the cells were incubated with 5 µM 2-NBDG in the presence of 2 mM 2,4-dinitrophenol (DNP; Sigma, St. Louis, MO, U.S.A.) in 1 mL M9 medium without glucose at 37°C for 20 min in the dark. DNP was added to prevent degradation of 2-NBDG.30) After incubation, the cells were washed twice with 1 mL PBS (−) by centrifugation at 18100×g for 5 min at 4°C. Then the resultant cell pellet was resuspended in 900 µL of FACS Buffer, and thereafter the cells were fixed by the addition of 100 µL of 37% (w/v) formaldehyde containing 10% (v/v) methanol (final concentrations: 3.7% (w/v) formaldehyde, 1% (v/v) methanol, Wako Pure Chemical Industries, Ltd.) on ice for 5 min. After fixation, the cells were immediately analyzed for glucose-uptake activity by flow cytometry.
Preparation of the microscopic measurement of the cells with 2-NBDG was also performed as described above, but without fixation.
EdU Incorporation AssayThe activity of macromolecule synthesis is a well-known criterion for bacterial cell viability. To ascertain the level of DNA synthesis in H2O2-treated SE cells, EdU incorporation assay using a commercially available detection kit, “Click-it® EdU Alexa Fluor® 488 Flow Cytometry Assay Kit (Life Technologies)” was performed. The method is basically similar to the 5-bromo-2′-deoxyuridine (BrdU) incorporation assay but is more suitable for visualization. In this assay, DNase I treatment is used to expose the epitope of the BrdU label together with subsequent reaction with fluorochrome-conjugated anti-BrdU antibody; whereas the EdU incorporation assay just requires a single reaction for coupling the EdU with fluorochrome in the presence of copper(I) by the Click reaction.31) The assay was performed by according to the manufacturer’s instructions. In this assay, the H2O2-treated SE cells were incubated at 37°C for 45 min with 10 µM EdU in 1 mL of M9 medium without glucose contained in a 15-mL conical tube to allow incorporation of EdU into newly synthesized DNA. The reaction was terminated by fixation of the cells by the addition of 10 mL of 90% (v/v) methanol followed by incubation on ice for 30 min. Then the cells were centrifuged at 2850×g for 20 min at 4°C, and the resultant cell pellet was resuspended with 1% (w/v) BSA/PBS (−) and transferred into a microcentrifuge tube. The cells were centrifuged at 18100×g for 5 min at 4°C, and the pellet was resuspended with 100 µL of 0.5% (v/v) TritonX-100/PBS (−), followed by incubation at room temperature for 30 min to permeabilize the cell membrane. Finally, the cells were centrifuged and washed once with 1 mL of 1% (w/v) BSA/PBS (−). The cell pellet was resuspended in 500 µL Click-iT® reaction cocktail (Life Technologies), and incubated at room temperature for 30 min to label EdU with Alexa Fluor® 488. The cells were centrifuged and washed once with 1 mL 1% (w/v) BSA/PBS (−) as described above, suspended in 1 mL of FACS Buffer, and analyzed by flow cytometry.
Preparation of the microscopic measurement of the cells with EdU was also performed as described above.
LIVE/DEAD Bacterial Viability AssayThe loss of membrane integrity was detected by using BacLight Bacterial Viability Kit (Life Technologies). The assay was performed by according to the manufacturer’s instructions. In this assay, the H2O2-treated SE cells were incubated at room temperature for 15 min in the dark with 0.55 µM SYTO 9 and 3.3 µM PI in 1 mL PBS (−). Then the cells were centrifuged and bacterial cell pellet was suspended with 50 µL PBS (−). Five microliters of aliquots were applied on the slide and sealed with cover glass.
Confocal Laser Scanning MicroscopyThe metabolic activity of the cells was observed by using a confocal laser-scanning microscope (LSM510; Carl Zeiss, Oberkochen, Germany) equipped with a water-cooled UV laser (80 mW), an air-cooled Argon ion laser (30 mW) and a He/Ne ion laser (5 mW) with LSM5 software (Carl Zeiss). The excitation source for DAPI was the 364-nm UV beam from the UV laser; and that for Alexa Fluor® 488, CTC-formazan, and 2-NBDG was the 488-nm blue beam from the Argon ion laser. The blue-fluorescence emission from DAPI was collected through a BP 385–470 band-pass filter, the green-fluorescence emission from Alexa Fluor® 488 and 2-NBDG was collected through an LP 505 long-pass filter, and the red-fluorescence emission from CTC was collected through an LP 650 long-pass filter. For LIVE/DEAD Bacterial viability assay, SYTO 9 and PI were excited by 488-nm blue beam. The green-fluorescence emission from SYTO 9 was collected through a BP 530–580 band-pass filter and the red-fluorescent emission from PI was collected through an LP 610 long-pass filter. The obtained data were processed by using ImageJ software.32)
The metabolic activity of the viable bacterial cells was determined by the following formula:
 |
Flow cytometric measurements were conducted on a cell sorter (FACS Aria III; BD Biosciences, San Jose, CA, U.S.A.) equipped with a solid-state laser (488 nm-emission; 20 mW) and a He/Ne ion laser (633 nm-emission; 18 mW) with BD FACSDiva software (BD Biosciences). Excitation source for Alexa Fluor® 488, CTC-formazan, and 2-NBDG was the 488-nm blue beam from the solid-state laser. Prior to the analysis, the cell suspension was serially diluted to about 107 cells/mL with FACS Buffer and sieved through a 200-µm nylon mesh to avoid clogging of the fluid system. The green-fluorescence emission from Alexa Fluor® 488 and 2-NBDG was collected in the FITC channel (BP 530/30 filter); and the red-fluorescence emission from CTC, in the PerCP channel (BP 675/20 filter). Forward angle light scatter (FSC) and side angle light scatter (SSC) were collected in the FSC detector and SSC channel (BP 488/10 filter), respectively. For each sample run, 10000 events were collected. The detection threshold was adjusted for FSC to eliminate noise, and the gate was set on the FSC–SSC dot plot to exclude debris. Each metabolic activity was calculated from the metabolically-positive population as viable cells obtained from the measurement processed with BD FACSDiva software.
Statistical AnalysisSignificance of differences between 2 groups was analyzed by performing Student’s t-test. For comparison of more than 2 groups with comparable variances, one-way ANOVA and the Tukey–Kramer’s post hoc test were carried out.
As shown in Fig. 1, SE cells showed markedly reduced culturability that occurred in a biphasic H2O2 concentration-dependent manner; i.e., the cfu value mildly decreased by 1.3 logs after treatment with 1 mM H2O2 but drastically dropped by 3.6 logs with 3 mM and became zero with 10 mM. These results indicated the reproducibility of our previous data,14) and therefore we used this method throughout the present study.

Mid-logarithmic SE cells were incubated for 60 min in LB medium containing the indicated concentration of H2O2 as described in the text. The culturability (cfu/mL) was determined by plating the cells on LB agar plates in duplicate. The culturability of heat-killed SE cells, as negative control, was not detected. Results are shown as the mean±S.E. for 3 independent experiments (** p<0.001 vs. 0 mM).
We next examined the respiratory activity of the H2O2-treated SE cells by using the CTC-reduction assay, which is a method to analyze bacterial respiratory activity,20,21) and was used as one of the criteria of the viability of SE cells in this study. The measurement of respiratory activity was performed by both flow cytometry and the direct counting method using confocal laser-scanning microscopy.
Figure 2A shows images of H2O2-treated SE cells acquired by confocal laser scanning microscopy. A respiratory-active cell, which has an active electron transport system as well, is indicated by the arrow in the figure. Such cells showed an accumulation of fluorescent CTC-formazan particles at the cell edge. On the contrary, the respiratory-inactive cell, indicated by the arrowhead in the figure, did not accumulate the formazan. A summary in graphic form of microscopic enumeration of the respiratory-active population is shown in Fig. 2B. According to this analysis, H2O2-treated SE cells lost their respiratory activity in a biphasic H2O2 dose-dependent manner; the cells showed decreased respiratory activity at 1 mM and 3 mM H2O2 (63% and 61% positive at 1 mM and 3 mM, respectively), but largely at 10 mM H2O2 (23% positive at 10 mM).

(A) Confocal laser-scanning micrographs of the cells stained with CTC/DAPI are shown. Respiratory-active cells alone accumulated insoluble CTC-formazan particles (arrow) at the edge of individual cells, whereas all cells were stained blue with DAPI (arrowhead). Respiratory-inactive cells correspond to those stained with DAPI but without CTC; namely, they appeared blue alone. (B) Summary of the respiratory-active population as seen by CTC/DAPI double staining acquired from photomicrographs in “A.” The activity of heat-killed SE cells, as negative control, was not detected. Photomicrographs are representative images from repeated experiments, and the summary shows the mean±S.E. for 3 independent experiments.
Figure 3A shows cytograms indicating the distribution of the respiratory-active subpopulation of H2O2-treated SE cells measured by flow cytometry. Ten-thousand events are shown in each dot plot, which shows the fluorescent intensity of CTC-formazan on the horizontal axis and the side light scatter on the vertical axis, which scatter reflects the internal complexity of the cells. The non-fluorescent population (indicated as “P2” in each cytogram) was gated off by an unstained sample (data not shown). Fluorescent (respiratory active) and non-fluorescent (respiratory inactive) populations were clearly distinguished by this gating.

(A) Cytograms of CTC-stained cells are shown. The horizontal axis indicates the fluorescence intensity of CTC-formazan; and the vertical axis, side-light scatter intensity. The respiratory-active subpopulation was gated in the right rectangle (P3); and the inactive subpopulation, in the left one (P2). (B) Summary of respiratory-active (CTC-staining positive) subpopulation as seen by CTC-staining acquired from the cytograms in “A.” The activity of heat-killed SE cells, as negative control, was not detected. Cytograms are typical data from repeated experiments, and the graphic summary shows the mean±S.E. for 3 independent experiments (** p<0.001 vs. 0 mM).
Figure 3B summarizes the population in these cytograms. Similar to the results obtained by the microscopic analysis, the H2O2-treated SE cells lost their respiratory activity in a dose-dependent manner; i.e., the cells showed much decreased respiratory activity at 1 mM and 3 mM H2O2 (25% and 38% positive at 1 mM and 3 mM, respectively), and then much more decreased activity at 10 mM H2O2 (0.90% positive at 10 mM). Comparing Figs. 2 and 3, the relative number of cells in the respiratory-positive population seems to differ between the flow cytometric and the microscopic analyses in CTC-reduction assay, due to the different principles of these detection methods.
Glucose-Uptake Activity Analyzed by Flow Cytometry Using 2-NBDGWe examined 2-NBDG uptake by H2O2-treated Salmonella as another method for the evaluation of the viability of the VBNC cells. 2-NBDG is an analogue of glucose with NBD-fluorescence and has been used for measuring glucose uptake.33–35)
Figure 4A shows images of H2O2-treated SE cells that had been examined for the subsequent incorporation of 2-NBDG. The green cells (indicated by an arrow) were those with 2-NBDG uptake, which cells were the major population in all of the samples after treatment with 0–10 mM H2O2. Inactive cells, colored blue (indicated by the arrowhead), were observed to have been fewer than the active, green cells after treatment with 0–3 mM H2O2; although the number of them was as much as about 56.7% even after 10 mM H2O2-treatment (Fig. 4B).

(A) Confocal laser-scanning micrographs of the cells stained with 2-NBDG/DAPI are shown. Glucose uptake-positive cells were stained green with 2-NBDG (arrow). All cells appeared blue when stained with DAPI, but uptake-inactive cells were stained blue only (B) Summary of the respiratory-active population as seen by 2-NBDG/DAPI double staining acquired from photomicrographs in “A.” The activiy of heat-killed SE cells, as negative control, was not detected. Photomicrographs are representative images from repeated experiments, and the graphic summary shows the mean±S.E. for 3 independent experiments.
Figure 5A shows the distribution of the subpopulations concerning glucose-uptake among H2O2-treated SE cells assayed by flow cytometry. Again, 10000 events are shown in each dot plot, with the horizontal axis indicating the fluorescence intensity of 2-NBDG and the vertical axis, the side light scatter, which reflects internal complexity of the cells. The non-fluorescent population (indicated as “P2” in each cytograms) was gated as the non-stained sample. Fluorescent and non-fluorescent subpopulations, i.e., active and inactive ones for glucose uptake, were clearly distinguished.

(A) Cytograms of after staining with 2-NBDG. The horizontal axis indicates the fluorescence intensity of 2-NBDG; and the vertical axis, the side light scatter intensity. The glucose uptake-active subpopulation was gated in the right rectangle (P3); and inactive subpopulation, in the left rectangle (P2). (B) Graphic summary of the glucose uptake-active (2-NBDG staining positive) subpopulation shown as relative (%) to the total cells based on the results in “A.” The activity of heat-killed SE cells, as negative control, was not detected. Cytograms are typical data from repeated experiments, and the graphic summary shows the mean±S.E. for 3 independent experiments (* p<0.01 vs. 0 mM).
Figure 5B summarizes the cytograms shown in Fig. 5A. Compared with the microscopic analysis shown in Fig. 4B, the results of these cytograms showed no significant differences in the distribution of the cells with 2-NBDG uptake. Besides, it seems remarkable that H2O2 treatment did not severely decrease the glucose-uptake activity, which was 44% of the control even after treatment with 10 mM H2O2; whereas it decreased the CTC-reduction activity much more (Figs. 2B, 3B). These results suggest that glucose-uptake might have been more tolerant to H2O2 treatment than aerobic respiration.
Measurement of DNA Synthesis Activity by Flow Cytometry and EdU Incorporation AssayFigure 6A shows images of SE cells that had incorporated EdU after pretreatment with 0–10 mM H2O2. The cells with DNA synthesis activity are colored green (indicated by the arrow), and corresponded to the major population of the samples without H2O2 treatment. However, after 3–10 mM H2O2 treatment, the population of the inactive cells (indicated by the arrowhead) increased dramatically, reaching 96.0% with 3 mM and 99.8% with 10 mM H2O2 (Fig. 6B).

(A) Confocal laser-scanning micrographs of SE cells stained with EdU-Alexa Fluor® 488 are shown. DNA synthesis-active cells (shown in green, arrow) were positive when stained with EdU-Alexa Fluor® 488. Inactive cells were not stained (arrowhead). (B) Summary of the DNA synthesis-active population as seen by EdU-Alexa Fluor® 488 staining acquired from photomicrographs in “A.” The activity of heat-killed SE cells, as negative control, was not detected. Photomicrographs are representative images from repeated experiments, and the graphic summary shows the mean±S.E. for 3 independent experiments (** p<0.001 vs. 0 mM).
Figure 7A shows cytograms giving the distribution of the DNA synthesis-positive subpopulation of the H2O2-treated cells as analyzed by flow cytometry. The subpopulation of cells with DNA synthesis disappeared almost entirely after treatment with more than 3 mM H2O2. Figure 7B gives a graphic summary of the results seen in the cytograms. Control cells without H2O2 treatment and those treated with 1 mM H2O2 showed high activity of DNA synthesis as 82% and 68% positive populations, respectively; but DNA-synthesizing cells with 3 mM or 10 mM H2O2 treatment were much fewer in number, representing only 0.62% and 0.16% positive cells, respectively. These results suggest that H2O2 severely inhibited DNA synthesis activity at higher concentrations.

(A) Cytograms of EdU-Alexa Fluor® 488-stained cells are shown. The horizontal axis indicates the fluorescence intensity of Alexa Fluor® 488; and the vertical axis, the side-light scatter intensity. The DNA synthesis-active subpopulation was gated in the right rectangle (P3); and the inactive subpopulation, in the left rectangle (P2). (B) Summary of the DNA synthesis-active (EdU-Alexa Fluor® 488 staining positive) subpopulation analyzed from the cytograms in “A.” The activity of heat-killed SE cells, as negative control, was not detected. Cytograms are typical data obtained from repeated experiments, and the graphic summary shows the mean±S.E. for 3 independent experiments (** p<0.001 vs. 0 mM).
In this study, we assessed glucose uptake, succinate dehydrogenase, and DNA synthesis by flow cytometry (Figs. 3, 5, 7) together with the colony-forming activity shown in Fig. 1. We determined the VBNC population as the “metabolically active but non-culturable” population. As shown in Fig. 8A, susceptibility of the cells to H2O2 treatment varied among the methods employed; i.e., 1 mM H2O2 reduced cfu’s to 5.1% (the culturable cells) of the non-treated control; 3 mM H2O2, to 0.4%; and 10 mM H2O2, to 0.00001%. However, a much larger population of the cells showed activities of “viable cells” at each concentration of H2O2; although sizes of the populations varied considerably among the biological activities, with glucose-uptake being the largest, CTC-reduction, middle, and DNA synthesis, the smallest. These results seemed to be common between Figs. 8A and B, and so the results suggest that VBNC state might be divided differently according to the metabolic activities by which they were estimated.
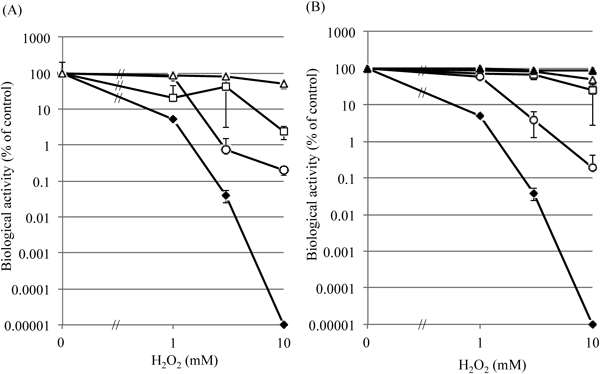
Relative values of the culturability (closed diamonds), DNA-synthesis activity (open circles), glucose-uptake activity (open triangles), and the respiratory activity (open squares) are shown relative to the control (intact logarithmic SE cells treated with 0 mM H2O2). Each relative value was calculated from the data shown in Figs. 1, 3, 5 and 7, corresponding to flow cytometry (A) and from the data of Figs. 1, 2, 4 and 6, obtained by microscopy (B). The results of LIVE/DEAD Bacterial viability assay by microscopy are also shown in (B) with closed triangles.
We also performed LIVE/DEAD BacLight bacterial viability assay only by microscopy, because flow cytometric analysis of these SE cells after staining without fixation is not allowed in our university due to the biosafety-related regulation. The results showed that 85.8±7.1% of 10 mM-H2O2-treated SE cells were “Viable” (Fig. 8B), showing considerably higher value than the other criteria, probably due to inefficient permeability and staining of PI toward membrane-damaged cells after H2O2-treatement.
In this study, we used 3 types of fluorescent dyes for detection of viable-cell characteristics. These dyes are based on different staining mechanisms to assign metabolic activities of viable cells including VBNC cells. Using these dyes we succeeded in estimating 3 different metabolic activities: respiratory activity (CTC reduction), glucose uptake (2-NBDG uptake), and DNA synthesis (EdU incorporation). We showed that the extents of the decrease in these metabolic activities in VBNC cells seemed to differ from each other, with the DNA synthesis activity being the most sensitive to H2O2 among them and decreasing the most. As for the respiratory activity, at 3 mM H2O2 it dropped from the control level when assayed by flow cytometry, but not when assayed microscopically at that same concentration of H2O2 (Figs. 8A vs. B). Glucose-uptake activity was maintained higher than the others at all doses of H2O2 in this experiment, and no significant difference was observed between flow cytometry and microscopy. These results suggest the presence of different subpopulations in VBNC Salmonella, implying that H2O2-treated Salmonella cells did not lose biological activities of living cells en bloc, but instead lost their DNA-synthesis activity first, then CTC-reducing activity, and finally glucose-uptake activity with far less loss. These results also suggest that VBNC state was either linked to cell death or maintaining the “viable” state in response to the strength of a stress like H2O2.
Besides, the results in this study revealed a difference between results for the CTC-reduction assay obtained by flow cytometric and microscopic analysis (Figs. 2B, 3B). It seems to be a problem based on these assay methods to detect CTC-formazan particles inside of the bacterial cell. One reason of the difference might have been due to the different principle of detection between a flow cytometer and a microscope, especially confocal laser-scanning microscope. While flow cytometry can detect a CTC-formazan-positive-cell as a particle en bloc, wherever CTC-formazan is localized in the cell. Confocal laser-scanning microscopy detects the CTC-formazan only at the place on the particle that localized on the focal plane of microscope between the depths of the bacterial cell volume. These differences might affect the apparent activity of CTC-reduction of the bacterial cells. Z-axis scanning of confocal micrograms might solve the problem.
It also should be noted that this difference might have been due to a difference in the sensitivities of the CTC-reduction assay kits used in these assays. As described in Materials and Methods, we used 2 different CTC-staining kits, one suitable for flow cytometry and the other, for microscopic observations. These kits contain different enhancing reagents for CTC-fluorescence, with the microscopy-optimized kit showing a stronger enhancing effect than the flow cytometry-optimized one so that microscopy obtains high-contrasted micrographs. Although it seems to be difficult to declare which method is more suitable for the analysis, flow cytometry seems to be easy to obtain one accurate result concerning its point.
In addition, this is the first report of the EdU incorporation assay being applied to bacterial cell analysis by flow cytometry; although Felluro et al.36) reported the microscopic application of this probe labeling.
Berney et al.15) showed the inactivation pattern of such vital cell functions of solar-light or UV-A light-exposed Escherichia coli as ATP synthesis activity, culturability, efflux via pump, glucose uptake, and membrane potential. Their precise study revealed that these activities decreased with different patterns against the fluency of UV-irradiation, and they also suggested the presence of a VBNC subpopulation during these treatments. Although they used different stress from ours in their experiments, they supposed the presence of many stages in the VBNC state.
The mechanism of the decrease in the respiratory activity might have been due to attack by hydrogen peroxide radicals generated by the Fenton reaction between H2O2 and iron (Fe2+). DNA synthesis (EdU incorporation) seems to be sensitive to oxidative stress,37) and our results (Figs. 6–8) also showed sensitivity of Salmonella to H2O2 in this regard.
Glucose-uptake activity was maintained at a high level even by treatment with 10 mM H2O2 (Figs. 4, 5), probably since it involves simpler biological systems than the other activities. By contrast, replication-related metabolisms are composed of a series of complex biochemical reactions that might have various targets impacted by oxidative stresses.
These entire assay methods examined in this present study provide us some keys to assign the properties of the physiological state of VBNC bacteria. Imamura et al. reported the presence of multiple phase of VBNC state in Vibrio cholerae induced by low tempereature.38) Our results also suggest that the VBNC state is not characterized with a single property but is composed of multiple stages of “step-by-step” manner in response to the strength and the type of the stresses, such as oxidative stress.
As described in Introduction, various methods for the detection of VBNC bacteria have been developed recently, and the most widely used one is the SYTO 9/PI double-staining method. This method is utilized by the LIVE/DEAD BacLight Bacterial Viability Kit (Life Technologies), detecting both dead (membrane-damaged) cells by PI staining and total cells by SYTO 9 staining. The principle of this method is based on the properties of PI, a dead-cell marker, which unable to penetrate into intact cells but is able to do so into damaged cells by the help of its cationic group, resulting in the intercalation with the double-helix of DNA.39)
Our study also showed a possibility of isolation of VBNC cells based on multiple kinds of metabolic activity, by sorting metabolically active but non-culturable subpopulation by a cell-sorting equipment. It seems to be of an advantage comparing to current techniques to isolate VBNC bacteria, using dead-cell marker such as PI. Isolation of metabolically active population specifically seems to be useful for promoting study of underlying mechanisms of VBNC state, separating by such multiple categories as “respiratory active but non-culturable,” “glucose-uptake acitive but non-culturable” etc. It would also lead to further analyses with high sensitivity with low background. Furthermore, application of these methods should be useful for improvement of the risk management for the safety of foods from pathogenic VBNC cells.
This work was in a part supported by a Grant-in-Aid for the Promotion of Science (21590141) from the Ministry of Education, Culture, Sports, Science and Technology of Japan.
The authors declare no conflict of interest.