Regular Articles
Determination and Pharmacokinetic Study of Pachymic Acid by LC-MS/MS
2015 Volume 38 Issue 9 Pages 1337-1344
Details
2015 Volume 38 Issue 9 Pages 1337-1344
Poria cocos is a well-known medicinal plant widely used in China and other East Asian countries owing to its various therapeutic effects. Pachymic acid (PA) is a bioactive lanostrane-type triterpenoid from Poria cocos. In this paper, a method of high-performance liquid chromatographic (LC) coupled with triple quadrupole tandem mass spectrometry (QQQ-MS/MS) was developed and validated to investigate the concentration of PA in rat plasma. Samples were prepared by a liquid–liquid extraction, and chromatographic separation was achieved with a Phenomenex Gemini C18 column (50 mm×2.0 mm i.d.) using a mobile phase consisting of acetonitrile and 0.05% formic acid (85 : 15, v/v) at a flow rate of 0.3 mL/min. The detection was performed on an Applied Bio-Systems API 4000 MS/MS with an electrospray ionization (ESI) inlet in negative multiple reaction monitoring (MRM) mode. Standard curves of samples in plasma were linear (R2=0.9948) over the concentration range of 5–500 ng/mL, and acceptable accuracy and precision were achieved. The lower limit of quantification and detection were 5 and 0.5 ng/mL, respectively. The method was used successfully to study the pharmacokinetics of PA in rats for oral administration. The main pharmacokinetic parameters of elimination half-life (t1/2), area under the plasma concentration–time curve from time zero to infinity (AUC0→∞), plasma clearance (CL), and apparent volume of distribution (Vd) for the PA group were 4.96±1.33 h, 1466.9±361.7 ng·h/mL, 6.82±1.73 L/h, and 48.85±9.47 L, respectively. This LC-MS/MS method can be developed further for clinical investigation of PA-containing products.
Because of their low toxicities and high levels of effectiveness against many diseases, traditional Chinese medicines (TCMs) have played an important role in the health of the Chinese people for thousands of years. In addition, they have gained ever-increasing global attention owing to the desirability of their bioactive compounds for the discovery of novel drug candidates. Poria cocos, which is also known as Fu Ling, is often used in TCM for its diuretic and sedative effects.1) P. cocos alone or in combination with other herbs is often used to treat diabetes as well as other disorders.2–4) The main ingredients of this herbal medicine include a group of triterpenoid compounds. Pachymic acid (PA) is one of the major components in P. cocos and plays an important role in various pharmacological effects. For example, PA has shown anti-inflammatory,5) anti-apoptotic, and anti-immunologic rejection effects.6) In addition, it has exhibited cytotoxicity against a human colon carcinoma cell line.1,7) Furthermore, PA has been shown to induce apoptosis of human prostate cancer cells by reducing prostaglandin synthesis and AKT activity,8,9) to stimulate glucose uptake,10) and to inhibit the phospholipase A2 family of arachidonic acid-producing enzymes.11) Therefore, further pharmacodynamic and pharmacokinetic studies of P. cocos are required to better understand its effects.
The limited ability to recognize bioactive chemicals and the uncertainty of quality of herbal products severely hinder the development of TCMs. The accurate identification of target chemicals from a single herb, or from a formulation having a combination of different herbs, is a real challenge. Currently, many kinds of fingerprint analyses have been used to assess herbal quality, including thin-layer chromatography, collision energy (CE), gas chromatography, and liquid chromatography (LC).12–14) Among them, high-performance liquid chromatography (HPLC) equipped with a diode-array detector (DAD) is frequently applied to determine the chemical composition and has become a routine method for the quality control of TCM products. In recent years, mass spectrometry (MS) has been used for TCM analysis, especially for qualitative analysis. Recently, the development of HPLC coupled with electrospray ionization multistage tandem MS (LC-ESI-MS/MS) has demonstrated its value for analyzing the major bioactive constituents of TCMs and their metabolites in vivo owing to its high sensitivity, good separation, and rapid screening capability relative to other separation and identification techniques.15,16)
In order to obtain useful information regarding the pharmacokinetic properties of PA to guide its rational administration in the clinic and to control the safety and effects of health foods containing P. cocos, a pharmacokinetics study of PA in vivo is urgently required. However, to the best of our knowledge, prior biochemical characterization research has not produced sufficient data regarding the pharmacokinetic profile of PA. Therefore, in the present study, we used LC coupled with triple quadrupole tandem mass spectrometry (QQQ-MS/MS) to reveal the amount of PA in rat plasma and its related pharmacokinetic profile. Thorough method validation (e.g., selectivity, linearity, limit of quantification (LOQ), intra- and interday precision and accuracy, recovery, matrix effects, and stability) was performed in accordance with the Bio-Analytical Method Validation recommendations of the U.S. Food and Drug Administration.17) Thus, the relative bioavailability of PA in rats following the oral administration of PA was determined. The results supplied a tool for analyzing different levels of chemicals in sophisticated TCM formulae simultaneously.
Glycyrrhetinic acid (GA; >98.5%), provided by the National Institute for the Control of Pharmaceutical and Biological Products (Beijing, China), was selected as the internal standard (IS; Fig. 1). Acetonitrile (HPLC-grade) was purchased from Merck (Darmstadt, Germany), and formic acid was purchased from Sigma (St. Louis, MO, U.S.A.). Water purified by a Milli-Q water purification system (Millipore, Milford, MA, U.S.A.) was used. Solid-phase extraction cartridges (Phenomenex Strata-X cartridge, 3 mL and 60 mg) were purchased from Phenomenex Corporation (U.S.A.).

Analyses were carried out using an Agilent 1200 LC system equipped with a quaternary delivery system, a degasser, and an auto-sampler. The LC separation was performed using a Phenomenex Gemini C18 column (50 mm×2.0 mm i.d., 5 µm). The mobile phase consisted of acetonitrile and 0.05% formic acid (85 : 15, v/v) at a flow rate of 0.3 mL/min. The mobile phase was filtered through 0.45-µm Millipore filters before use. The injection volume was 5 µL, PA was detected at 210 nm, and the system was operated 35°C.
An Applied Biosystems API 4000 triple quadrupole spectrometer (ABI-SCIEX, Toronto, Canada) equipped with an ESI source was used. Analyses were conducted in negative-ion mode, and the operating parameters were optimized as follows: collision and nebulizing gas, high-purity nitrogen (N2); capillary voltage, 4.5 kV; drying gas flow rate, 10 L/min; drying gas temperature, 350°C; the nebulizer gas, curtain gas, auxiliary gas, and collision gas parameters were set at 10, 35, 30, and 30 psi, respectively. For full-scan MS analysis, the spectra were recorded in the range of m/z 50–1500. Ion detection was performed in multiple reaction monitoring (MRM) mode wherein the m/z 527.4→527.4 [M−H]− transition for PA and the m/z 469.2→469.2 [M−H]− transition for GA were monitored. The data were acquired and quantitated with Analyst software, version 1.4.1 (Applied Biosystems, MDS Sciex, Toronto, Canada). The outcomes of selected ion monitoring (SIM) mode and MRM mode were compared. Selectivity indicates whether endogenous constituents may interfere with the assay. We assessed potential analyte interference in the LC peak region with six different blank rat plasma samples using the proposed extraction procedure and LC-MS/MS conditions. Quality control (QC) stock solutions of PA (1 mg/mL) and GA (1 mg/mL) were prepared by dissolving the standards in acetonitrile, respectively. The stock solution of PA was further diluted with the mobile phase to obtain a series of working solutions with a concentration range of 5–500 ng/mL. The IS working solution (3000 ng/mL) was also prepared with the mobile phase and stored at 4°C. In the prestudy validation experiment and the pharmacokinetic study, standards of the PA and GA working solutions were used to spike blank plasma for calibration curves and QC samples.
Plasma calibration standards containing 0, 5, 10, 20, 100, 200, and 500 ng/mL PA were prepared individually by spiking an appropriate amount of the working standard solution in rat plasma. Low-, medium-, and high-concentration QC samples were made at 10, 100, and 450 ng/mL of PA, respectively. All of the solutions were stored at 4°C and brought to room temperature before use.
Sample PreparationPA and the IS were extracted from plasma by protein precipitation with ethyl acetate. A 100-µL aliquot of plasma and 20 µL of the IS (3000 ng/mL) were vortexed for 30 s and then centrifuged (15000×g) for 5 min. Finally, the upper layer was transferred into a new glass tube and dried with nitrogen at 40°C. The dried residue was redissolved in 100 µL of acetonitrile, and 10 µL of the solution was injected into the LC-MS/MS system for analysis after centrifugation.
Method ValidationLinearity and QuantificationsThe calibration curves of the plasma samples were obtained by plotting the ratio of the peak area of PA to that of the IS against the nominal concentration of calibration standards (0, 5, 10, 20, 100, 200, and 500 ng/mL), respectively. The results were fitted by linear regression analysis using 1/χ2 as a weighting factor. The calibration curves had a correlation coefficient (R2) greater than 0.99. Unknown concentrations were computed from the linear regression equation of the peak area vs. concentration. The lowest limit of quantification (LLOQ) served as the lowest concentration on the calibration curve that could be determined quantitatively with acceptable precision (<20% difference from known concentrations) and accuracy (within ±20% variation across like samples).
Precision and AccuracyValidation samples were prepared and analyzed to evaluate the intra- and interday precision and accuracy. Precision in the working dose range was determined by replicate analyses of plasma samples (n=5) spiked with three concentrations (10, 100, and 450 ng/mL) of PA. To determine intra-day variance, quintuplicate assays were performed on the same samples at different times on 1 d. Interday variance was determined by assaying the spiked samples in quintuplicate on five consecutive days. The criteria for data acceptability included a precision of within ±15% relative standard deviation (R.S.D.) and accuracy within ±15% deviation from the nominal values. Except for the LOQ, which had ±20% cut-offs, the accuracy was assayed by comparison of the calculated mean concentrations to nominal concentrations.
Matrix EffectsThe matrix effects in rat plasma, not due to the analytes, may cause ion inhibition or enhancement of the signal. The assessment of matrix effects was determined by comparing the response of analytes dissolved in blank rat plasma sample (the final solution of blank plasma after extraction) with that of analytes resolved in the mobile phase. The matrix effect for PA was determined at a quality control (QC) of low, medium, and high concentrations (10, 100, and 450 ng/mL, respectively), whereas the matrix effect for the IS at 3000 ng/mL was determined in five replicate samples. The variability (R.S.D.) of the matrix effect at each concentration should be less than 15%.
Extraction RecoveryThe recovery of PA was tested at low, medium, and high concentrations (10, 100, and 450 ng/mL, respectively) through liquid–liquid extraction, whereas the recovery of the IS was determined at a single concentration of 3000 ng/mL. Recoveries were calculated by comparing the mean peak area of the extracted QC sample with that of the standard solution without preparation at the same concentrations.
StabilityStability studies were conducted with six replicate QC samples at each concentration (10, 100, and 450 ng/mL). Four types of PA stability were assessed: (a) sample preparation stability: samples were assessed after storage for 4 h at room temperature; (b) freeze/thaw stability: samples were assessed after three freeze-thaw cycles (−80°C for ≥12 h; (c) stability of treated plasma samples in the autosampler: QC samples were left in the autosampler for 24 h before being injected for analysis; and (d) long-term stability: samples were assessed after the plasma samples were stored at −80°C for 30 d.
AnimalsThirty-six male Wistar rats (300±20 g body weight) were obtained from Guangdong Experimental Animal Center (Guangzhou, China). They were separated into three groups (6 males and 6 females per group) as follows: the pure PA group, the P. cocos herbal extract group, and the Wulingsan (WLS) group. The rats were housed and maintained in a regulated environment at 25±2°C and a relative humidity of 60±5% under a 12 h light/12 h dark cycle. The rats had free access to water and were fed a normal diet during the acclimatization period of 1 week. The study was approved by the Animal Ethics Committee of Guangdong Pharmaceutical University.
Pharmacokinetics StudyThe three groups of rats were given PA alone (10 mg/kg), P. cocos (4 g/kg, containing 10.2 mg/kg of PA), and WLS (containing 10.2 mg/kg of PA) by oral administration, respectively. On the day before the pharmacokinetic study, a blood-sampling polyethylene tube (i.d., 0.58 mm; o.d., 0.965 mm; Becton Dickinson; Sparks, MD, U.S.A.) was implanted into the right jugular vein under general anesthesia (20% urethane, 1.5 g/kg). Blood samples (0.25 mL) were collected via the retroorbital plexus and placed into microcentrifuge tubes containing anti-coagulant (0.1% heparin) at 0, 0.083, 0.167, 0.25, 0.75, 1, 1.5, 2, 4, 8, 12, and 24 h after the rats received oral drug administration. The samples were centrifuged immediately at 3000×g for 10 min and then stored frozen at −80°C until analysis. Plasma concentrations of PA are expressed as mean±standard deviation (S.D.). Plasma samples (100 µL) were spiked with the IS and processed using the same sample preparation procedures.
Noncompartmental pharmacokinetic data relating to the absorption, distribution, and elimination rate of PA were calculated by using the NONMEM Program, version 1.1 (GloboMax Inc., Ellicott City, MD, U.S.A.). The maximum plasma concentration (Cmax) and time to reach peak concentration (tmax) were obtained directly from the experimental data. The elimination half-life (t1/2β) was calculated as 0.693/β, where β is the elimination rate constant calculated from the terminal linear portion of the log plasma concentration vs. time curve. The area under the plasma concentration vs. time curve from time zero to infinity (AUC0→∞) was estimated using the log-linear trapezoidal rule.
In order to develop a sensitive and specific LC-MS/MS method for quantification of PA in rat plasma, some potential influencing factors were investigated and optimized. According to the chemical structure of PA, the negative-ion mode was found to be more appropriate for its detection. The negative-ion mode ESI MS of PA and the IS in full-scan Q1 mode showed a deprotonated molecular ion [M−H]− as the base peak, m/z 527.4 amu for PA and m/z 469.2 amu for the IS (Fig. 1). Testing various CE values for PA and the IS revealed no specific abundant [M−H]− fragment ions.
Optimization of MS conditions was carried out. First, SIM and MRM mode were compared. When selected ions (at the aforementioned m/z values) were used to quantify PA and the IS in the rat plasma samples, we observed high background noise in the chromatogram with a LOQ >20 ng/mL in SIM mode, indicating that SIM mode may not be suitable for quantification of these compounds in rat plasma samples. However, in MRM mode, we achieved an approximately 10-fold improvement of sensitivity for the measurements of PA (m/z 527.4→527.4 [M+HCOO]−) and the IS (m/z 469.2→469.2 [M−H]−) compared to those in SIM mode, and the LLOQ decreased to 2 ng/mL. Therefore, quantification was performed using the MRM mode. Then, the compound parameters Declustering potential (DP), Collision energy (CE), Entrance potential (EP), and Collision exit potential (CXP) were optimized to −64 V, −20 V, −10 V, and −15 V for PA and to −66 V, −25 V, −10 V, and −15 V for GA, respectively. Therefore, we selected [M−H]− molecular ions (m/z 527.4→527.4 for PA and m/z 469.2→469.2 for the IS) for our MRM detection with negative-ion mode ESI.
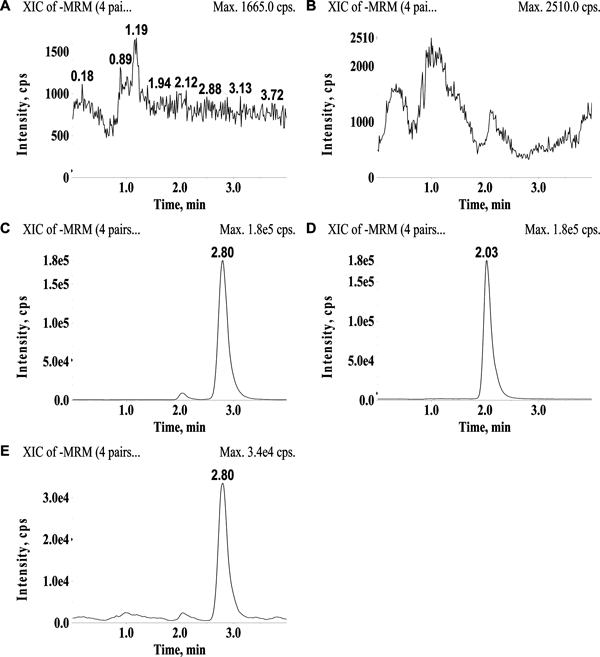
Method ValidationAssay SpecificityThe retention times of PA and the IS were 2.80 min and 2.04 min, respectively, and there were no interfering peaks at these retention times in the blank plasma sample, indicating that our method exhibited good specificity and selectivity (Fig. 2). Typical chromatograms of a drug-free plasma sample, a drug-free plasma sample spiked with PA and the IS, and a rat plasma sample obtained after oral administration of PA are shown in Fig. 2.
Matrix effects are another potential factor determining assay specificity. In the present work, the results of our matrix effect analysis with low-, middle-, and high-concentration QC samples are shown in Table 1. The matrix effect values for PA at each QC level (10, 100, 450 ng/mL) were 106.3%, 97.3%, and 103.8%, respectively. In addition, the matrix effect value for the IS was 97.1%. All of these values were within the acceptable limit, indicating that no significant matrix effects were observed in any of the rat plasma samples.
| Added concentration | Determined concentration (ng/mL) | Matrix effect (%) | R.S.D. (%) |
|---|---|---|---|
| PA (ng/mL) | |||
| 10 | 10.63±0.55 | 106.3 | 5.2 |
| 100 | 97.25±6.85 | 97.3 | 7.0 |
| 450 | 467.33±14.58 | 103.8 | 3.1 |
| GA (ng/mL) | |||
| 250 | 242.75±12.48 | 97.1 | 5.1 |
PA, pachymic acid; GA, glycyrrhetinic acid; IS, internal standard.
In our experiments, we used different liquid–liquid extraction methods to test the recovery. Various extraction agents such as ethyl acetate, diethyl ether, dichloromethane, and hexane were used to test the extraction recovery of PA in rat plasma. Interestingly, the extraction recovery was less than 75% with diethyl ether, dichloromethane, and hexane but greater than 75% with ethyl acetate in all plasma concentrations of PA. Under these conditions, the recovery of the IS in rat plasma was 78.6±4.64%. The determination of the recovery of PA and the IS in rat plasma was consistent, precise, and reproducible over five replicate experiments for each sample. The results of the extraction recovery tests are summarized in Table 5.
Linearity and QuantificationsGood linearity was obtained in the range of 5–500 ng/mL for PA. The mean (±S.D.) regression equation was Y=0.0088X−0.0337 (n=5), where Y refers to the peak area ratio of PA to the IS, and X refers to the concentration of PA in the plasma. The correlation coefficient (R2) of the calibration curve was 0.9948. The current assay had a lower limit of detection of 0.5 ng/mL (S/N≥3) and a LLOQ of 5 ng/mL. The accuracy of the LOQ was within ±8.2%, and the precision was <5.7%. The method was found to be sufficiently sensitive for the pharmacokinetic analysis of PA in rat plasma.
Precision and AccuracyThe precision and accuracy of the method were also defined by examining both intra- and inter-assay variabilities. The precision and accuracy values for both intra- and inter-day plasma sample assays are shown in Table 2. The results indicated that the values were within the acceptable range and that the method was accurate, reliable, and reproducible.
| Added concentration (ng/mL) | Intra-day | Inter-day | ||||
|---|---|---|---|---|---|---|
| Determined concentration (ng/mL) | Precision (%) | Accuracy (%) | Determined concentration (ng/mL) | Precision (%) | Accuracy (%) | |
| 10 | 9.77±0.37 | 3.6 | 97.7 | 11.06±0.71 | 6.6 | 111.1 |
| 100 | 95.5±4.81 | 5.0 | 95.5 | 98.1±4.14 | 4.2 | 98.1 |
| 450 | 462.71±27.51 | 5.9 | 102.8 | 447.35±16.58 | 3.5 | 99.5 |
The stability of PA was carried out by comparing the results under different storage conditions (Table 3). Our stability experiments indicated that PA was stable in rat plasma after being stored at room temperature for at least 4 h, undergoing three freeze-thaw cycles, and when stored at −80°C for 30 d. In addition, the treated samples were found to be stable when left in the autosampler for 24 h before being injected. The results indicated that PA was stable under all of these conditions.
| Conditions | Added concentration (ng/mL) | Determined concentration (ng/mL) | Precision (%) | Accuracy (%) |
|---|---|---|---|---|
| Short-term stability | 10 | 9.57±0.63 | 6.6 | 95.7 |
| 100 | 106.43±4.47 | 4.2 | 106.3 | |
| 450 | 474.81±15.58 | 3.3 | 105.5 | |
| Freeze and thaw stability | 10 | 10.82±0.58 | 5.6 | 108.2 |
| 100 | 97.14±5.18 | 5.3 | 97.1 | |
| 450 | 442.94±17.33 | 3.9 | 98.2 | |
| Post-preparative stability | 10 | 10.11±0.31 | 3.0 | 101.3 |
| 100 | 102.46±2.77 | 2.3 | 102.5 | |
| 450 | 458.27±8.39 | 1.8 | 101.8 | |
| Long-term stability | 10 | 9.24±0.87 | 9.4 | 92.4 |
| 100 | 96.39±5.52 | 5.7 | 96.3 | |
| 450 | 433.62±18.74 | 4.2 | 96.4 |
The method presented was successfully used to quantify PA in 36 rat plasma samples taken from rats orally administered with PA alone (10 mg/kg), P. cocos (4 g/kg), or WLS. The sensitivity and specificity of the assay were sufficient for accurate characterization of the pharmacokinetics of PA in rat plasma. The mean plasma concentration vs. time profiles of PA after oral administration in rats are summarized in Fig. 3, and the main pharmacokinetic parameters of PA calculated by a noncompartmental model are listed in Table 4. The t1/2β values for the PA, P. cocos, and WLS groups were 4.96±1.33, 6.65±1.89, and 6.92±1.36 h, respectively. The results indicated that PA was rapidly absorbed into the rat body and eliminated slowly, especially when administered in isolation. The Cmax values of PA in the three groups were 333.4±138.8, 398.4±176.7, and 265.7±125.6 ng/mL, respectively. As shown in Table 4, the major pharmacokinetic parameters differed significantly between the PA alone and WLS groups, indicating that the delivery of PA in WLS affected the absorption and elimination of PA in rats. The AUC can determine the pharmacokinetic properties of drugs. Meanwhile, elimination rate constant (β), t1/2β, and AUC0→∞ differed significantly between the PA alone and P. cocos groups, indicating that other constituents in P. cocos affect the elimination of PA specifically.

| Parameter | PA | P. cocos | WLS |
|---|---|---|---|
| β (h−1) | 0.1396±0.038 | 0.1044±0.032* | 0.1002±0.0268* |
| t1/2β (h) | 4.96±1.33 | 6.65±1.89* | 6.92±1.36* |
| tmax (h) | 0.75±0.14 | 0.83±0.12 | 1.05±0.22* |
| Cmax (ng/mL) | 333.4±138.8 | 398.4±176.7 | 265.7±125.6* |
| AUC0→∞ (ng·h/mL) | 1466.9±361.7 | 2042.8±478.9* | 2398.8±433.5* |
| Vd (L) | 48.85±9.47 | 48.34±10.55 | 42.86±8.83* |
| CLtot (L/h) | 6.82±1.73 | 5.02±1.49 | 4.29±0.98* |
PA, Pachymic acid; WLS, Wulingsan; β, elimination rate constant; t1/2β, elimination half-life; tmax, time to reach peak concentration; Cmax, maximum plasma concentration; AUC0→∞, area under the plasma concentration vs. time curve from time zero to infinity; Apparent volume of distribution (Vd,); Total plasma clearance (CLtot), ; * p<0.05 vs. PA alone; Cmax and Tmax were obtained directly from experimental observations.
In the present study, a simple, rapid, and sensitive method was successfully developed to determine PA in rat plasma using LC-MS/MS; GA was used as the IS. The method was then applied to a pharmacokinetic study of PA after its oral administration in three different groups of rats. Stable PA and GA ion forms were observed with negative-ion mode ESI, probably because the triterpenoids possessed weak lipophilicity.18,19) MRM mode produced better sensitivity than SIM mode. Thus, based on our optimized parameters, we selected [M−H]− molecular ions (m/z 527.4→527.4 for PA and m/z 469.2→469.2 for the IS) with MRM detection and negative-ion mode ESI.
PA is a natural triterpenoid with a carboxylic acid group on the molecular skeleton. We tested several mobile phases with various solvent systems and buffers, including acetonitrile–0.05% formic acid, acetonitrile–0.05% acetic acid, acetonitrile–0.05% phosphoric acid, methanol–0.05% formic acid, and methanol–water, to determine the optimal retention time, resolution, and sensitivity. The results indicated that acetonitrile was a suitable protonic solvent for the negative-ion mode detection of PA. It provided a stable signal for the determination of PA and had no influence on the MS/MS parameters. When formic acid was added to the mobile phase, the peak shape was more symmetrical and could be separated from endogenous compounds. As a component of the mobile phase, 0.05% aq. formic acid had a strong effect on the separation of PA. Therefore, a mobile phase consisting of acetonitrile and 0.05% aq. formic acid (85 : 15, v/v) was chosen as an appropriate mobile phase for separation of the compounds. The method was also checked with various C18 chromatographic columns from different manufacturers. Preliminary experiments indicated that, under our LC conditions, the Phenomenex Gemini C18 110 A column (50 mm×2.0 mm, 5.0 µm) was better than the Alltima C18 (150 mm×2.1 mm, 5.0 µm) and DikmaSpursil C18 (150 mm×2.1 mm, 5.0 µm) columns in terms of response, retention time, and peak shapes owing to its narrow internal diameter. PA was detected at a λmax of 210 nm by scanning spectral analysis under the mobile phase conditions described above.
LC13) and LC-MS20) methods have been developed for the determination of PA in the dried sclerotium of P. cocos. In particular, QQQ-MS/MS can achieve high sensitivity and selectivity without the need to establish a baseline chromatographic separation of target analytes from each other by using the MRM scan mode. This method greatly facilitates the quantification of chemical markers in complex matrices with only a small amount of sample. Additionally, our LC-MS/MS method is the first method to report a LLOQ for PA that is below 5 ng/mL.
We compared sample pretreatment extraction methods and found that protein precipitation with acetonitrile or methanol resulted in a low extraction recovery (<20%) and strong interference from endogenous substances in the plasma. Next, we determined that liquid–liquid extraction was preferable to extract PA. We found that liquid–liquid extraction with ethyl acetate as the solvent produced better extraction recovery than diethyl ether, dichloromethane, or hexane, presumably due to the high solubility of PA in ethyl acetate (Table 5).
| Solvent | Concentration (ng/mL) | Recovery (%) | Precision (%) |
|---|---|---|---|
| Ethyl acetate | 10 | 74.7±6.38 | 8.5 |
| 100 | 80.51±5.57 | 6.9 | |
| 450 | 82.8±3.88 | 4.7 | |
| Diethyl ether | 10 | 73.45±5.66 | 7.7 |
| 100 | 73.81±6.93 | 9.4 | |
| 450 | 75.44±4.14 | 5.5 | |
| Dichloromethane | 10 | 70.57±5.33 | 7.9 |
| 100 | 67.72±5.18 | 7.6 | |
| 450 | 73.81±4.88 | 6.6 | |
| Hexane | 10 | 66.34±6.92 | 10.5 |
| 100 | 70.59±4.39 | 6.1 | |
| 450 | 67.77±3.92 | 5.7 |
In this study, the method was successfully applied to quantify PA in the plasma of three groups of rats orally administered with PA. According to the concentrations and time points, concentration–time profiles were established. The plasma drug concentration vs. time results revealed there were some differences in PA absorption and elimination between the three groups. Compared to the P. cocos and WLS groups, the pure PA group had significantly more rapid absorption and elimination rates and a significantly smaller AUC0→∞ value. These findings may be due to other ingredients in P. cocos and WLS that affect the pharmacokinetic properties (i.e., absorption, bile extraction, and/or intestine reabsorption) of PA. These effects may prolong the systemic presence of PA, which was reflected by a larger AUC0→∞ value, and thus prolong its efficacy. It is also important to note that coexisting constituents in herbal extracts can interact with inducers or inhibitors of cytochrome enzymes.21)
The results reported herein provide important information for studying PA drug interactions in vivo. PA has been shown to be effective at inhibiting phospholipase A2, preventing tumor cell growth, inhibiting DNA topoisomerase II, and exhibiting anti-emetic activity. The present results also provide a useful foundation for future studies regarding the mechanisms responsible for the bioactivity of PA and the development of modified or supplemented versions of this compound that may be safer or have greater efficacy clinically.
A simple, rapid, and sensitive method was established and validated for the determination of PA in rat plasma by LC-MS/MS with negative-ion mode ESI. The sample was prepared by a liquid–liquid extraction, and chromatographic separation was achieved with a Phenomenex Gemini C18 column (50 mm×2.0 mm i.d.) using a mobile phase consisting of acetonitrile and 0.05% formic acid (85 : 15, v/v) at a flow rate of 0.3 mL/min. Quantification was performed using MRM of the transitions m/z 527.4→527.4 for PA and m/z 469.2→469.2 for the IS, respectively. Then, the method was validated by showing good linearity, specificity, no matrix effects, accuracy, precision, extraction recovery, and stability of PA in the plasma samples. Finally, the concentration vs. time profiles were established to study the pharmacokinetics and bioavailability of PA in rats. This LC-MS/MS method can be further developed for clinical investigation of PA.
This article was funded by two foundation projects: The National Natural Science Foundation of China (81403179) and the Foundation of Education Department of Guangdong (2013LYM0046, 2014KQNCX135).
The authors declare no conflict of interest.