Abstract
We examined whether calcium alginate (Ca-Alg) reduces blood cholesterol levels in rats fed a high-cholesterol diet. First, we examined taurocholate adsorption in vitro by various types of sodium alginate (Na-Alg). High molecular-weight, guluronic acid-rich Na-Alg showed the greatest adsorption of taurocholate, and therefore the corresponding Ca-Alg was chosen for the in vivo study. Rats were fed a high-cholesterol diet or a Ca-Alg-containing diet for 2 weeks. Body weight and diet intake were measured, and the general condition of the animals was monitored during this period. After 14 d, the plasma concentration of cholesterol, portal plasma concentration of bile acid, and bile acid in feces were measured. The plasma concentration of cholesterol was significantly reduced in rats fed a 2% Ca-Alg-containing diet. Furthermore, the portal concentration of bile acid was significantly lowered in the 2% Ca-Alg group. A tendency for a Ca-Alg concentration-dependent increase in fecal excretion of bile acid was also seen, although it was not statistically significant. While several changes in biochemical parameters and histopathological findings were observed, all the values remained within the physiological range. These results indicate that Ca-Alg is effective in reducing plasma cholesterol. A possible mechanism would be enhanced fecal excretion of bile acid due to reduced intestinal reabsorption, which in turn might stimulate bile acid synthesis from cholesterol in the liver, leading to a decrease in plasma cholesterol.
Heart disease and cerebrovascular disease account for about one-quarter of all deaths in Japan,1) and a major factor in their etiology is considered to be dyslipidemia.2–4) Indeed, dyslipidemia can be considered predominantly a modern lifestyle-related disease.5,6) Therefore, there is considerable interest in food additives or health foods that decrease cholesterol absorption or promote cholesterol excretion. Possible candidates include alginate (Alg), a cationic intercellular polysaccharide derived from brown seaweed.7,8)
We have compared the effects of sodium alginate (Na-Alg) and calcium alginate (Ca-Alg) in promoting excretion and decreasing absorption of Sr and cesium (Cs) in rats.9) Both additives increased the excretion of Sr, though Cs concentration was significantly reduced only in the Ca-Alg group. We also measured the plasma concentration of cholesterol in that study, and interestingly found that Ca-Alg has a greater cholesterol-lowering effect than Na-Alg.9)
At present, Na-Alg is widely used as a food additive (thickening agent) and as a health food to decrease blood cholesterol and inhibit weight gain.10–12) However, sodium intake is associated with hypertension,13) and Ca-Alg may be preferable to Na-Alg, if it has an equivalent pharmaceutical effect. Therefore, in this study we first examined various types of Na-Alg to evaluate their bile acid-absorbing ability in vitro. Based on the results, we selected high-molecular-weight, guluronic acid-rich Ca-Alg for the in vivo study to examine its cholesterol-lowering effect in rats given a high-cholesterol diet.
MATERIALS AND METHODS
Chemicals and AnimalsCholesterol, sodium cholate, cholesterol E-test WAKO and total bile acid-test WAKO were purchased from Wako Pure Chemical Industries, Ltd. (Osaka, Japan). [G-3H]Taurocholic acid was purchased from PerkinElmer, Inc. Life Sciences (MA, U.S.A.). High-molecular-weight Ca-Alg rich in guluronic acid and various types of Na-Alg, i.e., high-molecular-weight Na-Alg containing guluronic acid and mannuronic acid (Na-Alg HMW-G+M), high-molecular-weight Na-Alg rich in guluronic acid (Na-Alg HMW-G), high-molecular-weight Na-Alg rich in mannuronic acid (Na-Alg HMW-M), low-molecular-weight Na-Alg containing guluronic acid and mannuronic acid (Na-Alg LMW-G+M), low-molecular-weight Na-Alg rich in guluronic acid (Na-Alg LMW-G), and low-molecular-weight Na-Alg rich in mannuronic acid (Na-Alg LMW-M), were supplied by Kimica Corporation (Tokyo, Japan). Colestimide, a cationic polymer used to treat hypercholesterolemia, was purchased from Mitsubishi Tanabe Pharma (Osaka, Japan). Normal rat diet (CE-2) was supplied by Clea Japan Inc. (Tokyo, Japan). All other chemicals and solvents were analytical-grade commercial products.
The animal study was performed according to the Guidelines for the Care and Use of Laboratory Animals at Takasaki University of Health and Welfare and approved by the Committee of Ethics of Animal Experimentation of the University. Specific-pathogen-free male Wistar rats at six weeks of age were purchased from SLC Japan (Hamamatsu, Japan), housed 2 animals per cage in a room kept under controlled conditions (temperature of 23±3°C, humidity of 50±20%) with a 12-h light/dark cycle, and given free access to food and water.
In Vitro ExperimentsSolutions containing 2 nM [G-3H]taurocholic acid, 0.1 μM sodium taurocholate, and various types of Na-Alg (3 mg) in 1600 µL phosphate-buffered saline were incubated at room temperature for 30 min, and then passed through an Amicon Ultra 10k (Merck Millipore, Darmstadt, Germany) at 7500×g for 15 min. The amount of taurocholic acid in the filtrate was determined by radioactivity measurement using a liquid scintillation counter (LSC-6100; Aloka, Wallingford, CT, U.S.A.). It should be noted that in vitro absorption assay of cholesterol was not carried out because cholesterol did not pass through the filter (either because of micelle formation or adsorption on the filter).
In Vivo ExperimentsOne week after purchase, rats weighing 113 to 152 g were randomized into 6 groups (n=6 each): normal diet group; high-cholesterol diet group (0.5% (w/w) cholesterol, 0.25% (w/w) sodium cholate); three Ca-Alg-containing diet groups (0.5% (w/w) cholesterol, 0.25% (w/w) sodium cholate, 0.5, 1 or 2% (w/w) Ca-Alg) and a colestimide-containing diet group (0.5% (w/w) cholesterol, 0.25% (w/w) sodium cholate, 0.5% (w/w) colestimide). Rats received the appropriate diet for two weeks. Body weight and diet intake were measured and the general condition of the animals was monitored during this period.
After 7 d and 14 d, 0.5 mL of blood was withdrawn from the jugular vein with a heparinized syringe under anesthesia induced with diethyl ether, and centrifuged at 1700×g for 10 min to obtain plasma. After 14 d, 0.6 mL of blood was collected from the portal vein after laparotomy under anesthesia, and the plasma concentration of cholesterol was measured. Feces (n=2 rats/cage) were collected during the final 24 h of the feeding period, dried in a lyophilizer, then pulverized and heated in ethanol for two hours at 70°C. The heating process was repeated four times, and bile acid in the pooled extract was measured.
In accordance with the original Folch method,14) 2000 µL of chloroform–n-methanol (2 : 1, v/v) was added to a 5 mL tube containing 100 mg liver. Samples were homogenized in a Polytron homogenizer (Kinematica, Lucerne, Switzerland), and incubated overnight at 4°C. Four hundred microliters of KCl 0.8% was added and the samples were vortexed and incubated for 1 h at 4°C. Then, 500 µL of the lower phase was evaporated under vacuum. The residue was taken up in 500 µL chloroform–n-methanol (2 : 1, v/v), and a 100 µL aliquot of the solution was evaporated under vacuum. The residue was taken up in 100 µL of isopropanol, and the cholesterol concentration was determined.
For safety monitoring, blood samples withdrawn after 14 d were used for the measurement of biochemical parameters, namely aspartate aminotransferase (AST), alanine aminotransferase (ALT), total cholesterol (Cho), triglyceride (TG), phospholipid (PL), non-esterified fatty acid (NEFA), high density lipoprotein (HDL), low density lipoprotein (LDL), blood glucose (GLU), Ca, Na, potassium (K), and chloride (Cl).
After blood sampling, the animals were euthanized by exsanguination (n=3 each). Heart, liver, lung, kidneys, spleen, submandibular glands, parotid glands, mesenteric lymph nodes, stomach, intestines, testes, epididymis, thyroid glands, adrenal glands, white adipose, tissue and brown adipose tissue were removed and immediately fixed in 10% neutral buffered formalin. The tissues were immersed in paraffin, and cut at 4 µm thickness. The slices were stained with hematoxylin and eosin, and examined microscopically.
Analytical MethodsBiochemical parameters were measured with commercial kits using an automated analyzer (BioMajesty™ JCA-MB6050, JEOL Ltd., Tokyo, Japan) and blood testing apparatus (XT-2000iV, Sysmex Corporation, Kobe, Japan). DeterminerL TGII BMS was purchased from Kyowa Medex Co., Ltd. (Tokyo, Japan). Oculusauto CRE was purchased from Shino-Test Corporation (Tokyo, Japan). Analysis kits for other biochemical parameters were purchased from Wako Pure Chemical Industries, Ltd.
Statistical AnalysisData are expressed as the mean±standard deviation (S.D.). Statistical comparisons were made using the Dunnet test and the Williams test. Values of p<0.05 were considered significant.
RESULTS
In Vitro ExperimentsThe amount of bile acid adsorbed by high-molecular-weight Na-Alg was greater than the amount adsorbed by low-molecular-weight Na-Alg. The recovery of bile acid in the filtrate was least (less than 20% of the control) in the case of Na-Alg HMW-G (Table 1). We therefore selected Ca-Alg HMW-G for the in vivo experiment.
Table 1. Comparison of the Adsorption Capacity of Different Types of Na-Alg, in Terms of Adsorption Rate of Taurocholic Acid
| Taurocholic acid adsorption rate |
|---|
| (% of control) |
|---|
| Control | | 0.0±26.2 |
| Low MW | M+G | 54.8±10.4 |
| M-rich | −0.1±48.1 |
| G-rich | 26.4±14.4 |
| High MW | M+G | 78.7±1.7** |
| M-rich | 35.6±42.5 |
| G-rich | 82.1±3.5** |
The data are mean±S.D. (n=3). The significance of differences from the control was determined by means of Dunnett’s test. ** p<0.05. We used filters that had adsorbed excess amounts of taurocholate (cold) in advance.
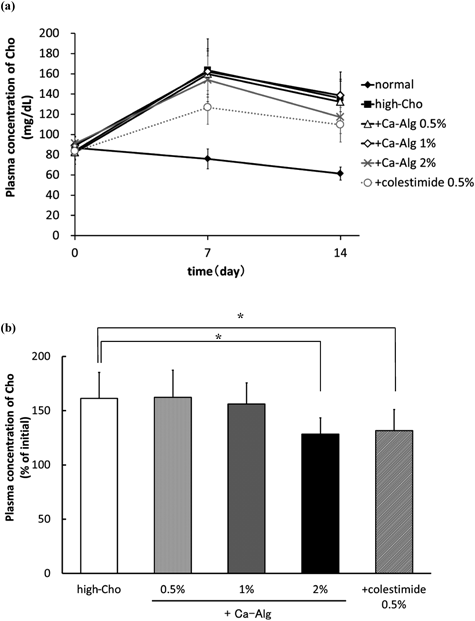
Plasma concentration of cholesterol was increased at one week in all groups except the control group (fed a normal diet). In the group fed colestimide-containing diet, the extent of the increase was less than in the others. Between one and two weeks, the plasma concentration of cholesterol declined in all groups, and the group fed the Ca-Alg 2% diet showed the greatest decrease during this period (Fig. 1a). In the groups fed diets containing Ca-Alg, the increase of cholesterol concentration over the 2-week period appeared to be inversely dependent on the concentration of Ca-Alg in the diet. In the groups fed Ca-Alg 2% diet and colestimide-containing diet, the plasma concentrations of cholesterol at 2 weeks were 128.5±14.8% and 131.4±19.6% of the initial value, respectively, and were significantly lower than that in the group fed high-cholesterol diet alone (161.3±24.0% of initial value) (Fig. 1b).
Plasma Concentration of Other Biochemical Parameters in RatsAfter one week, PL concentration in plasma of the colestimide-containing diet group was significantly lower than that of the high-cholesterol diet group, but no difference was observed at two weeks. No marked difference in any other biochemical parameters related to lipid metabolism was observed among the groups (Table 2).
Table 2. Body Weight, Cumulative Amount of Diet Intake and Biochemical Parameters in Rat Plasma during Two-Week Feeding Period
| Parameter | Time (d) | Normal | High-Cho | +Ca-Alg 0.5% | +Ca-Alg 1% | +Ca-Alg 2% | +Colestimide 0.5% |
|---|
| Body weight (g) | 0 | 133±13 | 132±13 | 132±13 | 132±10 | 132±11 | 131±6 |
| 7 | 175±14 | 174±13 | 169±12 | 174±7 | 172±12 | 170±5 |
| 14 | 202±15 | 196±13 | 196±13 | 199±4 | 199±16 | 195±6 |
| Cumulative amout of diet intake (g/body) | 0 | 0.0±0.0 | 0.0±0.0 | 0.0±0.0 | 0.0±0.0 | 0.0±0.0 | 0.0±0.0 |
| 7 | 107±3.9 | 104±2.8 | 99.8±1.8 | 106±1.7 | 102±8.6 | 96.1±2.8 |
| 14 | 224±7.2 | 213±6.1 | 211±6.7 | 219±6.5 | 219±17 | 205±6.8 |
| TG (mg/dL) | 0 | 40.8±12.3 | 68.3±7.7 | 59.0±40.1 | 59.7±24.3 | 64.3±27.7 | 54.0±19.8 |
| 7 | 78.8±22.5 | 86.2±32.7 | 65.0±16.9 | 86.8±28.7 | 71.0±34.2 | 81.0±7.2 |
| 14 | 43.8±17.9 | 44.0±52.7 | 30.0±9.3 | 39.5±18.4 | 31.5±11.5 | 39.0±11.5 |
| LDLC (mg/dL) | 0 | 11.4±1.6 | 11.4±2.5 | 10.9±1.1 | 11.9±1.1 | 11.5±2.1 | 12.5±1.4 |
| 7 | 10.2±1.4 | 21.0±7.3 | 18.2±4.4 | 20.5±4.7 | 18.7±4.6 | 13.6±2.0 |
| 14 | 7.3±0.9 | 11.4±3.8 | 11.4±2.0 | 13.4±2.8 | 12.3±2.6 | 8.8±1.6 |
| HDLC (mg/dL) | 0 | 52.6±7.3 | 47.0±0.9 | 44.6±6.0 | 51.6±3.8 | 53.8±7.9 | 48.2±2.7 |
| 7 | 45.5±5.8 | 40.1±3.7 | 39.0±6.3 | 41.6±3.1 | 42.8±5.0 | 36.3±4.3 |
| 14 | 43.9±5.0 | 39.5±2.9 | 41.7±6.7 | 43.2±2.9 | 46.0±8.2 | 36.2±4.7 |
| PL (mg/dL) | 0 | 163.2±16.6 | 166.0±13.7 | 155.0±22.0 | 169.7±10.8 | 173.8±9.9 | 156.2±15.6 |
| 7 | 153.0±18.7 | 156.5±17.6 | 148.8±6.0 | 160.3±5.2 | 154.8±12.0 | 138.3±9.3* |
| 14 | 134.7±14.7 | 130.8±22.0 | 129.8±11.6 | 141.5±5.2 | 139.7±9.7 | 117.5±10.0 |
| NEFA (µEq/L) | 0 | 0.45±0.09 | 0.49±0.10 | 0.45±0.11 | 0.46±0.19 | 0.47±0.15 | 0.45±0.12 |
| 7 | 0.55±0.05 | 0.66±0.15 | 0.64±0.20 | 0.64±0.09 | 0.66±0.11 | 0.57±0.04 |
| 14 | 0.73±0.26 | 0.56±0.18 | 0.58±0.17 | 0.65±0.16 | 0.55±0.18 | 0.62±0.23 |
| Na (mmol/L) | 0 | 141.0±2.3 | 141.0±3.1 | 141.3±2.8 | 141.4±3.0 | 142.2±1.9 | 141.4±4.9 |
| 7 | 138.2±1.9 | 139.8±1.5 | 138.4±1.3 | 138.6±1.2 | 139.4±1.8 | 138.7±2.2 |
| 14 | 142.1±1.1 | 142.9±1.1 | 144.4±7.1 | 144.0±4.4 | 141.8±1.0 | 142.2±1.5 |
| K (mmol/L) | 0 | 9.1±2.3 | 9.2±1.7 | 8.5±1.8 | 8.3±2.0 | 8.2±1.3 | 8.1±1.7 |
| 7 | 7.6±0.7 | 6.9±0.4 | 6.5±0.5 | 7.0±0.4 | 6.4±0.5 | 6.9±0.7 |
| 14 | 4.2±0.5 | 4.1±0.3 | 4.1±0.6 | 4.1±0.4 | 4.0±0.2 | 4.2±0.2 |
| Ca (mmol/L) | 0 | 9.5±1.0 | 7.8±2.3 | 8.6±0.7 | 9.2±1.0 | 10.3±1.1* | 10.0±0.5* |
| 7 | 10.2±0.2 | 11.1±0.1 | 10.8±0.3 | 10.6±0.2 | 10.9±0.2 | 10.5±0.7 |
| 14 | 8.7±1.7 | 10.4±0.7 | 10.2±0.5 | 10.7±0.6 | 10.6±0.2 | 10.2±0.5 |
| Cl (mmol/L) | 0 | 101.5±2.0 | 101.1±2.1 | 101.5±2.8 | 101.7±2.8 | 101.6±1.5 | 102.1±3.3 |
| 7 | 99.5±2.0 | 99.3±1.8 | 98.4±1.2 | 98.1±1.7 | 99.4±0.8 | 99.3±1.7 |
| 14 | 99.7±1.0 | 99.1±1.5 | 100.9±5.5 | 100.2±2.7 | 98.1±1.3 | 99.4±1.1 |
| Cre (mg/dL) | 0 | 0.19±0.02 | 0.17±0.06 | 0.20±0.01 | 0.20±0.01 | 0.19±0.01 | 0.19±0.01 |
| 7 | 0.21±0.01 | 0.23±0.01 | 0.21±0.01* | 0.22±0.01 | 0.23±0.02 | 0.21±0.01 |
| 14 | 0.22±0.03 | 0.27±0.02 | 0.25±0.02 | 0.27±0.02 | 0.26±0.02 | 0.26±0.01 |
| ALP (U/L) | 0 | 2193±100 | 1903±617 | 2079±257 | 2135±209 | 2201±262 | 2195±130 |
| 7 | 2101±61 | 2745±228 | 2489±253 | 2613±104 | 2498±297 | 2533±234 |
| 14 | 1742±370 | 2185±244 | 2210±311 | 2129±204 | 2130±276 | 2286±190 |
| GLU (mg/dL) | 0 | 152.8±8.8 | 127.5±40.1 | 147.8±11.7 | 144.8±12.3 | 155.3±10.2 | 148.5±8.1 |
| 7 | 169.2±11.1 | 157.3±11.9 | 154.3±9.4 | 161.7±4.2 | 170.7±10.6 | 159.8±17.8 |
| 14 | 88.5±46.3 | 136.0±27.3 | 130.5±18.3 | 142.3±16.4 | 140.2±16.3 | 105.2±14.0* |
| ALT (U/L) | 0 | 42.5±6.7 | 32.3±11.1 | 37.8±6.0 | 38.7±3.7 | 43.0±6.2 | 38.7±6.6 |
| 7 | 42.5±4.5 | 64.7±45.0 | 53.2±9.4 | 55.5±16.2 | 62.2±18.0 | 39.3±8.4 |
| 14 | 40.7±10.6 | 46.2±9.5 | 45.5±8.4 | 49.2±6.9 | 50.0±6.5 | 44.7±10.2 |
| AST (U/L) | 0 | 75.8±6.0 | 66.7±19.7 | 82.2±6.1* | 73.7±4.1 | 74.0±3.4 | 77.8±5.8 |
| 7 | 75.7±6.0 | 117.8±80.4 | 103.7±30.6 | 94.3±18.2 | 97.8±19.5 | 74.3±6.9 |
| 14 | 71.5±16.3 | 72.8±10.9 | 77.3±13.3 | 76.8±7.0 | 73.3±5.9 | 75.2±3.5 |
The data are mean±S.D. (n=6). The significance of differences between the high-Cho group and the Ca-Alg containing groups or the colestimide group was determined by means of Dunnett’s test. * p<0.05.
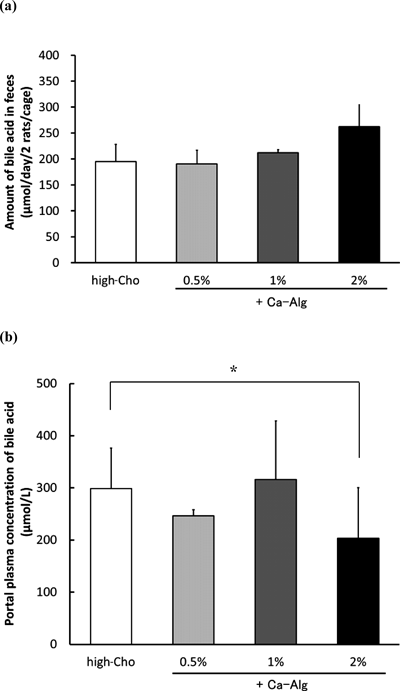
Bile acid excretion in feces tended to increase depending on the concentration of Ca-Alg in diet (high-cholesterol diet alone, 194.8±33.6; Ca-Alg 0.5%, 190.8±26.2; Ca-Alg 1%, 212.1±5.8; Ca-Alg 2%, 262.2±82.2 µmol/d/2 rats/cage), but the differences were not statistically significant (Fig. 2a). In the group fed the 2% Ca-Alg diet, the portal plasma concentration of bile acid was significantly decreased to 203.4±97.0 µmol/L, compared to the high-cholesterol diet group (298.7±77.8 µmol/L) although the decrease did not appear to be strictly dose-dependent (Fig. 2b).
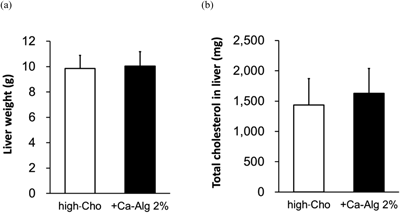
Liver Weight Gain and Total Cholesterol in LiverThere was no difference in liver weight gain (high-cholesterol diet alone, 9.8±1.0; Ca-Alg 2%, 10.0±1.1 g) or total cholesterol in liver (high-cholesterol diet alone, 1437±432; Ca-Alg 2%, 1629±407 mg) between the groups fed high-cholesterol diet and Ca-Alg 2% diet (Fig. 3).
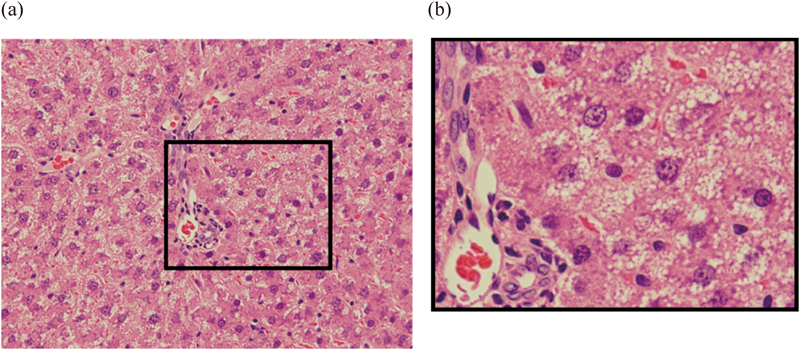
Safety AssessmentThere were no significant differences in weight gain or diet intake among the groups during the 2-week experimental period (Table 2). No change in general physiological condition was observed in any animal in any of the groups. After two weeks, GLU concentration in plasma of the colestimide-containing diet group was significantly lower than that of the high-cholesterol diet group. Several differences, including in initial values, were observed among other parameters, but all values were within normal physiological ranges (Table 2). Microvesicular steatosis was increased in the high-cholesterol diet group and in the Ca-Alg containing groups, but remained within the physiological range (Table 3, Fig. 4).
Table 3. Histological Findings in Rat Liver and Kidney after Two-Week Feeding Period
| Normal | High-Cho | Ca-Alg | Colestimide |
|---|
| 0.5% | 1% | 2% | 0.5% |
|---|
| Histological findings | 1 | 2 | 3 | 1 | 2 | 3 | 1 | 2 | 3 | 1 | 2 | 3 | 1 | 2 | 3 | 1 | 2 | 3 |
| Liver |
| Microvesicular steatosis in periportal hepatocyte | — | — | — | ± | ± | ± | — | ± | ± | ± | ± | ± | — | ± | ± | — | ± | — |
| Kidney |
| Basophilic renal tubules, focal | — | — | — | — | — | — | — | — | — | ± | — | — | — | — | — | ± | — | — |
| Angiectasis | — | — | — | — | — | — | — | — | — | — | ± | — | — | — | — | — | — | — |
| Deposition of hyaline drop | — | — | — | — | — | — | — | — | — | ± | ± | — | ± | — | — | — | — | — |
Grade of changes: —; no, —/±; within normal range, ±; slight. Cho: cholesterol.
DISCUSSION
There are several kinds of Alg, namely low- and high-molecular-weight types containing mainly β-D-mannuronic acid (M-rich), mainly α-L-guluronic acid (G-rich) or both (M+G).8) In order to identify the best Ca-Alg for the in vivo experiment, we first carried out an in vitro study to compare the taurocholate absorption capacity of these types. For this, we used Na-Alg, because Ca-Alg is virtually insoluble in water. Taurocholate was selected based on preliminary experiments with colestimide, because cholesterol failed to pass through the filter. Based on the results, we chose high-molecular-weight G-rich Ca-Alg, which is commercially available, for the in vivo experiments.
When 2% Ca-Alg diet was given to rats for two weeks, the portal plasma concentration of bile acid was significantly lowered; further, the amount of bile acid in feces was increased in all Ca-Alg groups (though without statistical significance). Therefore, Ca-Alg appears to promote excretion of bile acid in feces, presumably by binding to the bile acid and inhibiting its intestinal reabsorption. Moreover, the increase of plasma cholesterol level at 2 weeks was significantly reduced in the 2% Ca-Alg group, to a level similar to that in the 0.5% colestimide group. We speculate that reduced reabsorption of bile acid caused a decrease of bile acid concentration in the portal vein, which in turn would induce increased bile acid synthesis from cholesterol in the liver, with a concomitant reduction of cholesterol concentration in plasma.
It is well known that 95% of bile acid eliminated via the bile duct to the intestine is reabsorbed into the body,15,16) and gastric–hepatic circulation is the main supply source to maintain bile acid homeostasis in the body. Therefore, inhibition of reabsorption of bile acid by Ca-Alg may be an efficient mechanism for the reduction of plasma cholesterol.
We found no significant differences in weight gain, diet intake, or biological parameters among groups. Moreover, there was no change in total amount of cholesterol in the liver or liver weight gain. While several changes in biochemical parameters and histopathological findings were observed, all the values remained within the physiological ranges. Furthermore, the animals in all groups showed no apparent abnormalities. These results indicate that Ca-Alg is safe when taken daily for 2 weeks at the 2% concentration level. We could not confirm what types of lipoproteins were reduced by Ca-Alg treatment, because LDLC and HDLC fluctuated during the test period. Further study would be needed to resolve this issue.
In conclusion, our results indicate that 2% Ca-Alg in the diet reduces the increase of plasma cholesterol in high-cholesterol-fed rats. A possible mechanism would be enhanced fecal excretion of bile acid due to reduced intestinal reabsorption, which in turn might stimulate bile acid synthesis from cholesterol in the liver, leading to a decrease in plasma cholesterol. In this study, 2% Ca-Alg in the diet was found to be effective. Ca-Alg is convenient to take, because it is effective in solid form, unlike Na-Alg. Furthermore, Ca-Alg has been confirmed as safe for use as a food additive, and there is no risk of hypertension due to increased sodium intake. Therefore, Ca-Alg is expected to be suitable as an additive or functional food for long-term use.
Acknowledgment
This work was supported by JSPS Grant-in-Aid for Challenging Exploratory Research (KAKENHI) Grant Number 25560062.
Conflict of Interest
Chihiro Miyajima and Fumiyoshi Kasahara are employees of Kimica Corporation. The others have no conflict of interest.
REFERENCES
- 1) “Trends in leading causes of death, Summary of Vital Statistics.”: ‹http://www.mhlw.go.jp/english/database/db-hw/populate/dl/03.pdf›, Ministry of Health, Labour and Welfare, 10 March, 2015.
- 2) Kitamura A, Iso H, Naito Y, Iida M, Konishi M, Folsom AR, Sato S, Kiyama M, Nakamura M, Sankai T, Shimamoto T, Komachi Y. High-density lipoprotein cholesterol and premature coronary heart disease in urban Japanese men. Circulation, 89, 2533–2539 (1994).
- 3) Iso H, Naito Y, Sato S, Kitamura A, Okamura T, Sankai T, Shimamoto T, Iida M, Komachi Y. Serum triglycerides and risk of coronary heart disease among Japanese men and women. Am. J. Epidemiol., 153, 490–499 (2001).
- 4) Lida M, Ueda K, Okayama A, Kodama K, Sawai K, Shibata S, Tanaka S, Keijnkai T, Horibe H, Minowa M, Yanagawa H, Hashimoto T, NIPPON DATA80 Research Group. Impact of elevated blood pressure on mortality from all causes, cardiovascular diseases, heart disease and stroke among Japanese: 14 year follow-up of randomly selected population from Japanese (Nippon Data 80). J. Hum. Hypertens., 17, 851–857 (2003).
- 5) Teramoto T. Dietary Management in Japan Atherosclerosis Society (JAS) Guidelines for the Prevention of Atherosclerotic Cardiovascular Diseases in Japanese—2012 Version—. The Japanese Journal of Nutrition and Dietetics, 71, 3–13 (2013).
- 6) Abifadel M, Varret M, Rabès JP, Allard D, Ouguerram K, Devillers M, Cruaud C, Benjannet S, Wickham L, Erlich D, Derré A, Villéger L, Farnier M, Beucler I, Bruckert E, Chambaz J, Chanu B, Lecerf JM, Luc G, Moulin P, Weissenbach J, Prat A, Krempf M, Junien C, Seidah NG, Boileau C. Mutations in PCSK9 cause autosomal dominant hypercholesterolemia. Nat. Genet., 34, 154–156 (2003).
- 7) Davis TA, Volesky B, Mucci A. A review of the biochemistry of heavy metal biosorption by brown algae. Water Res., 37, 4311–4330 (2003).
- 8) Kimica Corporation Web.: ‹http://www.kimica-alginate.com/alginate/chemical_ structure.html›, 2009.
- 9) Idota Y, Harada H, Tomono T, Morimoto K, Kobayashi S, Kakinuma C, Miyajima C, Kasahara F, Ogihara T. Alginate enhances excretion and reduces absorption of strontium and cesium in rats. Biol. Pharm. Bull., 36, 485–491 (2013).
- 10) Nishizawa M, Kuda T, Yamagishi T, Tsuji K. Effect of depolymerized sodium alginate on the excretion of cholesterol from rats. J. Home Econ. Jpn., 48, 689–693 (1997).
- 11) Peters HP, Koppert RJ, Boers HM, Ström A, Melnikov SM, Haddeman E, Schuring EA, Mela DJ, Wiseman SA. Dose-dependent suppression of hunger by a specific alginate in a low-viscosity drink formulation. Obesity, 19, 1171–1176 (2011), Silver Spring.
- 12) Georg Jensen M, Kristensen M, Astrup A. Effect of alginate supplementation on weight loss in obese subjects completing a 12-week energy-restricted diet: a randomized controlled trial. Am. J. Clin. Nutr., 96, 5–13 (2012).
- 13) Stamler J, Rose G, Stamler R, Elliott P, Dyer A, Marmot M. INTERSALT study findings. Public health and medical care implications. Hypertension, 14, 570–577 (1989).
- 14) Folch J, Lees M, Sloane Stanley GH. A simple method for the isolation and purification of total lipids from animal tissues. J. Biol. Chem., 226, 497–509 (1957).
- 15) Peters AM, Walters JR. Recycling rate of bile acids in the enterohepatic recirculation as a major determinant of whole body 75SeHCAT retention. Eur. J. Nucl. Med. Mol. Imaging, 40, 1618–1621 (2013).
- 16) Galatola G, Jazrawi RP, Bridges C, Joseph AE, Northfield TC. Direct measurement of first-pass ileal clearance of a bile acid in humans. Gastroenterology, 100, 1100–1105 (1991).