Abstract
The aim of this study was to establish an appropriate inhalation method with a mometasone furoate dry powder inhaler (MF-DPI). Utilizing a tone-based inhalation training device, we investigated the maximum peak inspiratory flow rate time (Tmax PIFR) and peak inspiratory flow rate (PIFR) to determine whether either had an influence on lung deposition with use of an MF-DPI. A low tone indicated a PIFR of 28 L/min and a high tone that of 40 L/min, while 60 L/min was considered to be the standard. We established an inhalation profile in consideration of a human inhalation pattern, in which Tmax PIFR was set at 0.5 s (Tmax PIFR 0.5 s) and 2.5 s (Tmax PIFR 2.5 s). The reference cut-off value derived with a cascade impactor test was used for evaluation of the rate of delivered dose in the lung, which was the amount of drug from stage 3 to 7 at all PIFRs. We then investigated the relationship of the fine particle fraction (FPF) with the claimed dose at Tmax PIFR of 0.5 s and PIFR. There were no differences among the Tmax PIFR values for the doses emitted from the device or for the rate of delivered doses in stages 3–7. However, FPF for the claimed dose at 40 L/min was significantly lower than that at 60 L/min, which was dependent on PIFR. Our results showed that PIFR but not Tmax PIFR has an effect on lung deposition after inhalation with an MF-DPI.
A mometasone furoate dry powder inhaler (MF-DPI) is a device utilized for administration of inhaled corticosteroid, which is used for treatment of asthma. MF binds with high affinity to the corticosteroid receptor and has anti-inflammatory potency,1–3) and is formulated for delivery via a breath-actuated DPI using a Twisthaler®. Doses emitted from the device have been shown to be high, with flow rates ranging from 28.3 to 70 L/min.4) That study also revealed that the dose emitted from the device has a relationship with flow rate,4) though the relationship between dose and lung deposition amount is not clear. Furthermore, the mass median aerodynamic diameter (MMAD) of an MF-DPI is 2.0 µm, the smallest among available, thus it is characterized by the design of the particles used, which reach from the central to small airway. An inhalation training device (manufactured by Taisei Kako Co., Ltd.) that emits tones and is used in a manner similar to an MF-DPI has been produced to practice inhalation. This device produces a low tone at a peak inspiratory flow rate (PIFR) of 28 L/min and a high tone at that of 40 L/min. However, the relationship between PIFR-produced tones and the dose delivered to the lung has not been examined.
The rate of drug deposition in the lung has been examined in vitro in inhalation experiments. Those results revealed that PIFR actually sensed by patients was not reflected in those experimental results, as resistance to inhalation was not included in measured PIFR. In addition, individualized inhalation profiles can not be reproduced, because a vacuum pump is generally used for inhaling the drug in an in vitro setting. Hence, only PIFR values have been examined.
The time to reach maximum PIFR (Tmax PIFR) is extended in patients with respiratory dysfunction, such as chronic obstructive pulmonary disease and asthma.5,6) Thus, data regarding the rate of drug deposition in the lung in consideration of that influence is required for clinical application, though has not been reported. We previously developed an inhalation simulator that can reproduce a rising inspiratory flow rate similar to a human inhalation pattern.
The aim of the present study was to establish an appropriate inhalation method for MF-DPI using a training device. We investigated whether Tmax PIFR or PIFR, based on the tone produced by the training device, had an influence on lung deposition when using an MF-DPI. In addition, the rate of the delivered dose in the throat with a cascade impactor was evaluated, as well as that in the oral cavity and pharynx.
MATERIALS AND METHODS
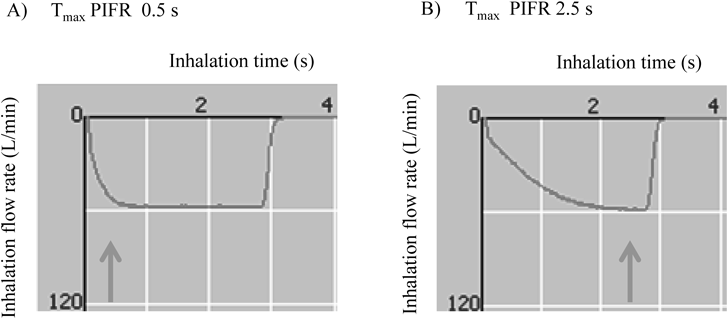
Calculation of Rate of Drug Deposition after Inhalation under Various ConditionsWe used an Asmanex® Twisthaler® 100 µg (MSD K.K., Tokyo, Japan) as the MF-DPI in the present study. In addition, we employed our previously developed inhalation simulator, which consists of a flow recorder placed in an air-tight box covering the MF-DPI and equipped with a cascade impactor, flow control system, and vacuum pump (Fig. 1). Flow rate in the monitor was recorded using the spirometer. The flow control system was installed with a small flow control valve and the inspiratory flow rate was controlled by a computer. The flow rate was increased stepwise using a computer program and inspiration time, Tmax PIFR, and PIFR were also controlled. However, PIFR was not decreased stepwise, because our aim was to elucidate the influence of Tmax PIFR on lung deposition. Thus, we developed the present flow control system to reproduce the inhalation profile and did not modify the cascade impactor. The doses delivered to the throat and at each stage were collected using a 50-mL mixture of methanol–water–acetonitrile (10 : 7 : 3) after a single inhalation from the MF-DPI at a dose of 100 µg for 3 s. MF doses in the collected samples were measured using high performance liquid chromatography. We considered that the Tmax PIFR value for patients with stable mild asthma was 0.5 s (Tmax PIFR 0.5 s), while that of those with stable severe asthma was considered to be 2.5 s (Tmax PIFR 2.5 s) (Fig. 2). PIFR at 28 L/min resulted in sounding of a low tone from the training device and 40 L/min sounded a high tone, while 60 L/min was considered to be the standard.
Influence of Tmax PIFR on Rate of Delivered Dose into LungIn general, a fine particle fraction (FPF) size of <5.0 µm was considered to be likely to reach the lung (from central to small airway). The cut-off diameters for each stage were calculated by substitution of PIFR in the relational equation at various PIFR values.7) However, it is uncertain whether this equation is reliable, because there is no evidence for a Tmax PIFR value of 2.5 s. Therefore, the reference cut-off value in the cascade impactor test was used for evaluation of the rate of the doses delivered into the lung and the amount of drug in stages 3 to 7 was assessed at each PIFR. In addition, we used a PIFR of 28.3 L/min for 5 s, which is the reference cascade impactor test.
We calculated the actual emitted dose from the device as a percentage of the label claim, the rate of delivered dose in stages 3–7 for the claimed dose, and the rate of delivered dose in stages 3–7 for the emitted dose using the apparatus and conditions described above. We compared between the rate of the delivered dose in stages 3–7 at Tmax PIFR values of 0.5 s and 2.5 s at PIFRs of 28, 40, and 60 L/min. Significance was determined using an unpaired t-test when comparing 2 groups with the software package JMP® 8.0 (SAS, Inc., Tokyo, Japan). A value of p<0.05 was considered to be significant.
Influence of PIFR on Rate of Dose into LungWe compared between the FPF of PIFR of 28, 40, and 60 L/min at a Tmax PIFR value of 0.5 s, which was considered to have scant influence on the cut-off value, because a Tmax PIFR of 0.5 s is a short amount of time to reach PIFR. The cut-off diameters for each stage were calculated by substitution of PIFR in the equation.7) The calculated cut-off values for each stage are shown in Table 1. The cumulative amount of drug in stages 3–7 was assessed by the cut-off value for FPF (<5.0 µm) at 28 L/min and 40 L/min, while that in stages 2–7 was assessed for FPF (<5.0 µm) at 60 L/min. Significance was determined using Tukey’s honestly significant difference test for multiple comparisons with the software package JMP® 8.0 (SAS, Inc., Tokyo, Japan). A value of p<0.05 was considered to be significant.
Table 1. Values for Each Cascade Impactor Stage at Flow Rates of 28, 40, and 60 L/min
| Stage | Cut-off value (µm) |
|---|
| 28 L/min | 40 L/min | 60 L/min |
|---|
| 0 | >11.06 | >9.25 | >7.56 |
| 1 | 7.04–11.05 | 5.89–9.25 | 4.81–7.56 |
| 2 | 4.73–7.03 | 3.95–5.88 | 3.23–4.80 |
| 3 | 3.32–4.72 | 2.78–3.94 | 2.27–3.22 |
| 4 | 2.11–3.31 | 1.77–2.77 | 1.44–2.26 |
| 5 | 1.11–2.10 | 0.93–1.76 | 0.76–1.43 |
| 6 | 0.65–1.10 | 0.55–0.92 | 0.45–0.75 |
| 7 | 0.43–0.64 | 0.36–0.54 | 0.30–0.44 |
RESULTS
Influence of Tmax PIFR on Rate of Delivered Dose into LungThe rates of delivered dose at each stage with a Tmax PIFR of 0.5 s and 2.5 s at 28, 40, and 60 L/min are shown in Table 2. In addition, those at the reference PIFR of 28.3 L/min for 5 s are shown in the right column. Furthermore, the dose emitted from the device as a percentage of label claim, the rate of the delivered dose in stages 3–7 for the claimed dose, and the rate of the delivered dose in stages 3–7 for the emitted dose at a Tmax PIFR of 0.5 and 2.5 s are shown in Fig. 3. For each emitted dose, the delivered doses in stages 3–7 for the claimed and the emitted doses were not different between Tmax PIFR 0.5 and 2.5 s. Moreover, there were no differences for the rate of delivered dose in stages 3–7 for the claimed doses, while there was a significant difference for the rate of emitted dose from the device between the reference cascade impactor test (at a PIFR of 28.3 L/min for 5 s) and a PIFR of 28 L/min for 3 s.
Table 2. Rate of Delivered Dose in Each Stage of Cascade Impactor with
Tmax PIFR of 0.5 and 2.5 s at 28, 40, 60 L/min, and 28.3 L/min (Reference)
| PIFR | 28 L/min | 40 L/min | 60 L/min | 28.3 L/min |
|---|
| Tmax PIFR | 0.5 s | 2.5 s | 0.5 s | 2.5 s | 0.5 s | 2.5 s | — |
|---|
| Rate of delivered dose (%) |
|---|
| Throat | 8.7 (2.0) | 10.4 (4.8) | 9.1 (1.6) | 11.4 (8.6) | 11.4 (2.4) | 15.2 (10.3) | 5.4 (1.5) |
| 0 | 10.5 (6.9) | 8.2 (5.0) | 8.3 (1.3) | 7.7 (2.6) | 11.9 (4.0) | 6.5 (3.1) | 7.0 (1.9) |
| 1 | 19.4 (5.8) | 12.7 (4.1) | 15.4 (4.5) | 12.8 (5.5) | 9.3 (1.5) | 13.4 (7.2) | 11.7 (1.7) |
| 2 | 11.2 (3.9) | 8.1 (7.6) | 11.3 (3.0) | 10.9 (5.8) | 9.9 (4.3) | 5.8 (2.2) | 7.0 (2.4) |
| 3 | 9.9 (6.2) | 3.9 (2.6) | 5.2 (1.8) | 5.0 (3.9) | 4.4 (2.2) | 2.9 (1.0) | 4.7 (2.0) |
| 4 | 3.9 (1.9) | 3.7 (1.8) | 3.5 (1.2) | 3.8 (1.6) | 6.2 (3.4) | 10.4 (5.7) | 2.0 (1.0) |
| 5 | 3.3 (2.2) | 3.6 (2.6) | 5.9 (2.0) | 5.6 (2.9) | 5.2 (1.9) | 7.5 (3.2) | 4.2 (2.9) |
| 6 | 3.9 (1.8) | 3.4 (2.2) | 5.4 (1.2) | 4.4 (1.7) | 6.2 (1.8) | 6.1 (2.0) | 3.0 (0.4) |
| 7 | 2.4 (1.0) | 4.0 (3.2) | 1.5 (0.5) | 2.0 (1.4) | 4.3 (1.3) | 3.5 (1.6) | 2.4 (0.2) |
| Rate of dose released form device (%) | 73.2 (16.0) | 57.8 (11.4) | 65.7 (5.6) | 63.6 (10.3) | 68.8 (12.0) | 71.4 (14.4) | 47.4 (2.7) |
| Rate of dose delivered in stages 3–7 for claimed dose (%) | 23.4 (8.4) | 18.5 (4.5) | 21.5 (3.1) | 20.9 (8.7) | 26.4 (9.5) | 30.4 (9.3) | 16.3 (4.7) |
| FPF (%) | 23.4 (8.4) | — | 21.5 (3.1) | — | 36.3 (10.5) | — | 16.3 (4.7) |
n=5, mean (S.D.), FPF; fine particle fraction.
FPF values for the claimed doses with PIFRs at 28, 40, and 60 L/min at a Tmax PIFR of 0.5 s are shown in Fig. 4. Those at 60 L/min were significantly higher than at 40 L/min (p=0.03), while there were no differences between the values obtained at 28 and 40 L/min (p=0.93), or between those obtained at 28 and 60 L/min (p=0.06).
DISCUSSION
Drug delivery performance is an index used for evaluating DPI formulations. In human trials, a radiolabeled drug is generally administered by subject inhalation, though there are concerns regarding safety. On the other hand, human inspiration patterns can not be reproduced in vitro, as inhalation is performed by a vacuum pump in laboratory conditions. We previously developed an in vitro experimental device that is able to control Tmax PIFR. It has been reported that most of the dose is emitted from a DPI device before reaching Tmax PIFR,8) thus indicating that drug deposition in the lungs might be affected by that value, though no findings have been reported to confirm that speculation. On the other hand, related studies have been presented. A relationship between Tmax PIFR and rate of carrier particle size released from the Rotahaler was shown.9) However, that study only measured the carrier particles released from the device, thus the results did not clearly reveal the relationship between Tmax PIFR and FPF. Moreover, another study measured FPF (% <5 µm) using laser diffraction and found it to be related with Tmax PIFR.10) Those findings showed that terbutaline FPF was dependent upon a Tmax PIFR of 60 L/min, when Tmax PIFR was in a range from 0.1 to 0.3 s, whereas there was no relationship with Tmax PIFR ranging from 0.3 to 0.5 s. The Tmax PIFR of examined patients was reported to be greater than 0.5 s,11) though that was not examined in that previous study. In addition, we speculated that Tmax PIFR would gradually shorten from the maximum at 2.5 s, though found no difference for the rate of delivered doses in stages 3–7 between 0.5 and 2.5 s. Consequently, we examined it only at 0.5 and 2.5 s.
The relationships between various inhalation flow profiles and drug dispersion have been examined,12) with high, sharp drug releasing pattern shown when Tmax PIFR was short. When Tmax PIFR was long, the drug releasing pattern had several peaks and was lower than that as compared to when Tmax PIFR was short. It was concluded that the inhalation flow profile and drug releasing pattern are related. Therefore, it is possible that the sum of the released drug and drug delivery in the lungs is the same when PIFR is the same and Tmax PIFR is different. In the future, it will be important to examine various factors that affect drug delivery into the lungs.
It is known that the PIFR of each patient has effects on drug delivery with a DPI5,6,11,13) and each pharmaceutical company has prepared their own DPI training device for confirming inspiratory flow rate. However, no previous study examined the relationship between PIFR of the training device and drug deposition in the lungs. In the present study, we investigated the effect of Tmax PIFR on drug deposition in the lungs at PIFR noted by a tone produced when using an MF-DPI training device.
As the result of future research, we hope to develop a cascade impactor without the need for a pre-separator. For doses of 200 and 400 µg, the MF-DPI delivered 40.8 and 36.7%, respectively, of the claimed delivered doses with particles sized <8.6 µm (stages 1–7) at 60 L/min.4) In the present study, 100 µg delivered at a Tmax PIFR of 0.5 and 2.5 s resulted in 45.6 and 49.6%, respectively, of the claimed delivered dose in stages 1–7 at 60 L/min. Thus, we think that the pre-separator is not necessary, as the results were quite similar.
The Tmax PIFR of asthma patients in a stable phase has been reported to be 0.5 s.11) Thus, we used Tmax PIFRs of 0.5 and 2.5 s as maximal values in the present study. Several studies set the inspiration time at 2 s by taking vital capacity into consideration, as the time required for a patient to strongly inhale with the DPI is approximately 2 s.4,14) On the other hand, it has been noted that the dose emitted from a DPI is not affected by inspiration time.8) Moreover, the average lung capacity of Japanese healthy adults is 3.5 L in males and 2.5 L in females. Thus, a Tmax PIFR of 2.5 s was set as the maximal value in the present study, while total inspiration time was set at 3 s. A PIFR of 28 L/min with the training device is equivalent to the maximum flow rate of a 3-year-old child with asthma, while that of 60 L/min is the same as that of an 8-year-old child with asthma.15) It is considered impossible for children younger than 3 years old to use a DPI. Accordingly, a PIFR of 28 L/min is considered reasonable for nearly all patients. In addition, we found no differences in the rate of delivered dose in stages 3–7 for the claimed dose with the reference cascade impactor at a PIFR of 28.3 L/min for 5 s as compared to that at 28 L/min for 3 s. However, the dose released from the device was significantly different between the reference cascade impactor test and each group, except for a PIFR of 28 L/min with a Tmax PIFR of 2.5 s. Also, the rate of the delivered dose in the throat by the reference cascade impactor test was lower as compared to the others, though the reason is unclear.
Since the emitted dose and rate of the delivered dose in stages 3–7 for the claimed dose, and that for the emitted dose from the device did not vary in regard to Tmax PIFR, it is suggested that drug delivery in the lungs by the MF-DPI might not be affected by Tmax PIFR. Thus, we concluded that PIFR exerts effects on drug delivery by an MF-DPI without dependence on inhalation pattern.
As for the effect of PIFR on drug delivery into the lungs, we considered that the doses emitted from the device are not affected by a PIFR in the range of 28–60 L/min and our findings were consistent with others previously reported.4) Meanwhile, the cut-off diameters were useful to calculate with the relational equation7) at a Tmax PIFR of 0.5 s. It was also suggested that FPF for the claimed dose was significantly lower at a flow rate of 40 L/min as compared to 60 L/min, and also tended to be lower at a flow rate of 28 L/min as compared to that of 60 L/min (p=0.06). Thus, PIFR was shown to affect drug deposition in the lung after inhalation with the MF-DPI.
Our results indicate that drug delivery into the lungs by the present MF-DPI was not affected by Tmax PIFR, but rather by PIFR. Furthermore, they confirmed that the MF-DPI is capable to emit a sufficient dose even at a low PIFR of 28 L/min, which produced a tone by the training device. In future studies, it will be necessary to clarify the mechanisms related to our results.
Acknowledgment
We thank Dr. Tetsuri Kondo for the valuable comments.
Conflict of Interest
Yasuyuki Shiraishi is Executive Director of Taisei Kako Co., Ltd. Hirokazu Mihashi is an employee of Taisei Kako Co., Ltd. The other authors have no conflict of interest to declare. A training device is manufactured by Taisei Kako Co., Ltd.
REFERENCES
- 1) Bousquet J. Mometasone furoate: an effective anti-inflammatory with a well-defined safety and tolerability profile in the treatment of asthma. Int. J. Clin. Pract., 63, 806–819 (2009).
- 2) Johnson M. Development of fluticasone propionate and comparison with other inhaled corticosteroids. J. Allergy Clin. Immunol., 101, S434–S439 (1998).
- 3) Valotis A, Högger P, Neukam K, Elert O, Human receptor kinetics, tissue binding affinity, and stability of mometasone furoate. J. Pharm. Sci., 93, 1337–1350 (2004).
- 4) Yang TT, Li S, Wyka B, Kenyon D. Drug delivery performance of the mometasone furoate dry powder inhaler. J. Aerosol Med., 14, 487–494 (2001).
- 5) de Boer AH, Winter HMI, Lerk CF. HMIW, Lerk CF. Inhalation characteristics and their effects on in vitro drug delivery from dry powder inhalers Part 1. Inhalation characteristics, work of breathing and volunteers’ preference in dependence of the inhaler resistance. Int. J. Pharm., 130, 231–244 (1996).
- 6) Burnell PK, Small T, Doig S, Johal B, Jenkins R, Gibson GJ. Ex-vivo product performance of Diskus and Turbuhaler inhalers using inhalation profiles from patients with severe chronic obstructive pulmonary disease. Respir. Med., 95, 324–330 (2001).
- 7) Taki M, Marriott C, Zeng XM, Martin GP. Aerodynamic deposition of combination dry powder inhaler formulations in vitro: a comparison of three impactors. Int. J. Pharm., 388, 40–51 (2010).
- 8) Bisgaard H, Klug B, Sumby BS, Burnell PK. Fine particle mass from the Diskus inhaler and Turbuhaler inhaler in children with asthma. Eur. Respir. J., 11, 1111–1115 (1998).
- 9) Chavan V, Dalby R. Effect of rise in simulated inspiratory flow rate and carrier particle size on powder emptying from dry powder inhalers. AAPS PharmSci, 2, E10 (2000).
- 10) Martin GP, Marriott C, Zeng XM. Influence of realistic inspiratory flow profiles on fine particle fractions of dry powder aerosol formulations. Pharm. Res., 24, 361–369 (2007).
- 11) Tarsin WY, Pearson SB, Assi KH, Chrystyn H. Emitted dose estimates from Seretide Diskus and Symbicort Turbuhaler following inhalation by severe asthmatics. Int. J. Pharm., 316, 131–137 (2006).
- 12) Kondo T, Hibino M, Ohe M, Akazawa K, Tanigaki T, Kato S. Feasibility of instruction of dry powder inhaler usage showing inhalation flow profile and drug dispersion. The Journal of the Japan Society for Respiratory Care and Rehabilitation, 25, 222–224 (2015).
- 13) Selroos O, Borgström L, Ingelf J. Performance of turbuhaler((R)) in patients with acute airway obstruction and COPD, and in children with asthma: understanding the clinical importance of adequate peak inspiratory flow, high lung deposition, and low in vivo dose variability. Treat. Respir. Med., 5, 305–315 (2006).
- 14) Yokoyama H, Yamamura Y, Ozeki T, Iga T, Yamada Y. Analysis of relationship between peak inspiratory flow rate and amount of drug delivered to lungs following inhalation of fluticasone propionate with a Diskhaler. Biol. Pharm. Bull., 30, 162–164 (2007).
- 15) Amirav I, Newhouse MT, Mansour Y. Measurement of peak inspiratory flow with in-check dial device to simulate low-resistance (Diskus) and high-resistance (Turbohaler) dry powder inhalers in children with asthma. Pediatr. Pulmonol., 39, 447–451 (2005).