Abstract
Cytochrome P450 enzymes (CYPs) are involved in the metabolism of various substances in the liver and small intestine and show markedly higher expression levels in the liver compared to other organs. The liver exhibits a remarkable capacity to regenerate. After excision of 70% of the liver, the organ can regenerate to its original size in approximately 1 week. Unlike the normal liver, in the injured liver, hepatic stem cells known as oval cells are considered to play an important role in regeneration. However, the role of CYPs in liver regeneration remains unclear. In the present study, we investigated the role of CYPs in the regeneration of injured liver. Liver injury was induced by 4-week repeated doses of 3,5-diethoxycarbonyl-1,4-dihydrocollidine (DDC) in the diet. Next, both DDC-fed mice and control diet (containing no DDC)-fed mice were subjected to 70% hepatectomy, and the hepatic gene expression patterns measured during regeneration were analyzed. Mice with DDC-induced liver injury expressed the oval cell markers cytokeratin 19 (CK19) and epithelial cell adhesion molecule (EpCAM), and partial hepatectomy increased the expression levels of CYP2R1 and CYP26A1 as well as the hepatoblast marker alpha-fetoprotein (AFP) in these mice. The results of this study suggest that CYP2R1 and CYP26A1 are important in the differentiation of oval cells into hepatoblast-like cells in the injured liver.
The adult liver consists of hepatic parenchymal cells (hepatocytes), hepatic sinusoidal endothelial cells, biliary epithelial cells, stellate cells, and Kupffer cells. Hepatic parenchymal cells occupy approximately 80% of the liver volume and play important roles in various liver functions, including nutrient storage, detoxification, metabolism, and excretion. The fetal liver, in contrast, is the major site of hematopoiesis.
The liver has the highest regenerative capacity of any organ in the body. After excision of 70% of the liver, the remnant liver regenerates to its original size in approximately 1 week through the hypertrophy or proliferation of the remaining tissue. Two major mechanisms have been proposed for liver generation: hypertrophy and proliferation of hepatocytes and differentiation of undifferentiated cells into hepatocytes.1) In the first mechanism, in a normal liver that has undergone partial hepatectomy, the remaining hepatocytes retain the potential for hypertrophy and proliferation for liver regeneration. In the second mechanism, in a liver that has been injured by drugs, the proliferative capacity of hepatocytes is reduced, and thus the hypertrophy or proliferation of hepatocytes is unlikely.1) Instead, some biliary epithelial cells dedifferentiate, likely into undifferentiated oval cells, which then proliferate and differentiate into hepatocytes to contribute to liver regeneration.
In rats in which hepatocyte proliferation is inhibited by 2-acethylaminofluorene, partial hepatectomy or administration of carbon tetrachloride results in the emergence of oval cells in the periportal region.2–5) Oval cells exhibit characteristics of both hepatocytes and biliary epithelial cells. These cells are considered to resemble hepatoblasts because they contain alpha-fetoprotein (AFP) and Delta like (DLK). In human liver diseases, albeit rarely, oval cells can be found around the Glisson’s capsule. It has been hypothesized that in the adult liver, hepatic stem cells resembling hepatoblasts and expressed around the Hering duct, at which the interlobular bile ducts connect to the bile canaliculi, are activated to become oval cells, contributing to liver regeneration. Mice that received a 4-week repeated dose of 3,5-diethoxycarbonyl-1,4-dihydrocollidine (DDC) in the diet showed the emergence of oval cells.4,6)
We previously demonstrated that in both the induction of differentiation of embryonic stem (ES) cells into hepatocytes experiments and the fetal mice experiments, the expressions of CYP2R1 and CYP26A1 were induced prior to the expression of DLK1, a hepatoblast marker.7) We suggested that CYP2R1 and CYP26A1 may play a role in hepatoblast cell differentiation during the development of the liver.
In this study, we considered whether CYP2R1 and CYP26A1 involved in differentiation from an undifferentiated cell, such as oval cells into hepatoblast in drug-induced hepatitis. This study investigated the roles of CYP2R1 and CYP26A1 in oval cell-mediated liver regeneration by analyzing the expression patterns of these CYPs following partial hepatectomy in mice with DDC-induced liver injury.
MATERIALS AND METHODS
Animal HandlingMale ICR mice (20–25 g, 6 weeks) were purchased from Japan SLC, Inc. (Tokyo Laboratory Animals Science Co., Ltd., Tokyo, Japan). The mice were kept at room temperature (r.t.) (24±1°C) and 55±5% humidity with 12 h of light (artificial illumination; 8 : 00–20 : 00). Food and water were available ad libitum. Each animal was used only once. The present study was conducted in accordance with the Guiding Principles for the Care and use of Laboratory Animals, as adopted by the Committee on Animal Research at Hoshi University.
Preparation of Mice with DDC-Induced Liver InjuryMice were fed a diet containing 0.1% DDC for 4 weeks to induce liver injury.4) The mice were divided into two groups: those subjected to 70% hepatectomy (partial hepatectomy (PH) group) and those subjected to laparotomy and subsequently suture without liver resection (sham group). On post-operative days 3 and 5, the liver was removed from the mice to analyze the expression levels of the hepatocyte markers CYP2R1 and CYP26A1. Separately, mice were fed a powder diet containing no DDC for 4 weeks, and 70% hepatectomy and sham groups were prepared for these mice in the same manner as for the DDC-fed mice (Fig. 1).
Liver Removal and Blood CollectionOn post-operative days 3 and 5, the mice were weighed and subjected to laparotomy under anesthesia with diethyl ether to remove the liver. The liver was weighed, and 100 mg each of tissue was removed for PCR from the right lobe and the caudate lobe. At the time of laparotomy, blood was collected from the inferior vena cava, which was incubated at 37°C for 60 min to prepare a serum sample.
Measurement of Aspartate Aminotransferase (AST) and Alanine Aminotransferase (ALT) ActivitiesThe activities of AST and ALT were measured using the transaminase CII-test kit (Wako, Japan).
Extraction of Total RNATotal RNA was extracted from the cells during the induction of the differentiation of ES cells into hepatocytes using TRI reagent (Life Technology, U.S.A.).
cDNA was synthesized from 1 µg purified total RNA using a High Capacity cDNA synthesis Kit. The concentration of the total RNA (µg/mL) was calculated, and the purity of the total RNA was evaluated by measuring its absorbance at 260 nm and 280 nm using a nanodrop (Thermo Fischer Scientific, Waltham, MA, U.S.A.) For each sample, 2.0 µL of 10×RT buffer, 0.8 µL of 25×deoxynucleotide triphosphate (dNTP) Mix, 2.0 µL of 10×RT Random Primer, 1.0 µL MultiScribe™ Reverse Transcriptase, 1.0 µL ribonuclease (RNase) Inhibitor, and 3.2 µL ultrapure water, which were all included in the High Capacity cDNA synthesis Kit (Applied Biosystems, U.S.A.), were mixed gently on ice to prepare the 2×Reverse Transcription (RT) Master Mix (Applied Biosystems, U.S.A.).
Semi-quantitative RT-PCRThe following reagents were added to each well of the PCR 8 Strip Tube: 0.1 µL TaKaRa Ex Taq, 2.5 µL of 10 Ex Taq buffer, 2.0 µL dNTP mixture, 1.25 µL dimethyl sulfoxide (DMSO), 1 µL cDNA solution, 2.5 µL forward primer (20 pmol/µL), 2.5 µL reverse primer (20 pmol/µL) and 13.15 µL ultrapure water. Using an iQ™ Thermal Cycler (Bio-Rad Laboratories, U.S.A.), samples were first denatured at 94°C for 2 min and then at 98°C for 10 s; then primer annealing was performed at 55 to 58°C for 30 s, followed by elongation at 72°C for 30 s. These steps constituted one cycle. After 30 to 35 cycles, an extension step was performed at 72°C for 1 min and 30 s to amplify the cDNA. The forward and reverse primers for the hepatocellular differentiation markers, α-fetoprotein (AFP), Delta like 1 (DLK1), albumin (ALB), and oval cell markers, cytokeratin 19 (CK19), epithelial cell adhesion molecule (EpCAM) and glyceraldehyde-3-phosphate dehydrogenase (GAPDH) as the housekeeping gene are listed in Table 1. After the PCR was completed, 2.5 µL of 10×loading buffer was added to the 25 µL PCR products, and the ssolution was mixed well. Agarose gel electrophoresis was performed with a 1.5% agarose gel and TAE buffer with 15 µL of PCR product/lane at r.t. for 30 min (Mupid-2 plus, TaKaRa Bio Inc., Japan). After electrophoresis, the agarose gel was soaked in EtBr solution, a nucleic acid stain solution, in the dark at r.t. for 15 min. The fluorescence images were visualized under UV transillumination and captured using a cooled CCD digital camera (LAS-3000mini, FUJIFILM Corporation, Tokyo, Japan), converted into digitized signals, and intensities of each band quantified by the Image J8) analysis software version 1.42q. (Wayne Rasband, NIH, U.S.A.). Signal intensities of CYP2R1, CYP26A1, CYP3A11, AFP, ALB, VK19, and EpCAM were normalized to those of GAPDH to produce arbitrary units of relative transcript abundance.
Table 1. RT-PCR Primer
| Target | Forward primer (5ʹ to 3ʹ) | Reverse primer (5ʹ to 3ʹ) | Product size (bp) | Annealing (°C) | Cycle |
|---|
| CYP2R1 | CCA TGG ATT GGC ATC TTA CC | CCC AAG AAG GTG TCC TGT TG | 361 | 55 | 35 |
| CYP26A1 | ACA TTG CAG ATG GTG CTT CA | TCA CCT CGG GGT AGA CCA | 376 | 58 | 35 |
| AFP | CAC TGC TGC AAC TCT TCG TA | CTT TGG ACC CTC TTC TGT GA | 300 | 58 | 40 |
| DLK1 | AAC ACA TCC TGA AGG TGT CC | TGG TCA TGT CAA TCT TCT CG | 273 | 58 | 40 |
| EpCAM | CGG CTC AGA GAG ACT GTG TC | GAT CCA GTA GGT CCT CAC GC | 368 | 58 | 35 |
| GAPDH | ACC ACA GTC CAT GCC ATC AC | TCC ACC ACC CTG TTG CTG TA | 452 | 55 | 35 |
The numerical data are expressed as the mean±standard deviation (S.D.). The significance of the differences were examined by Student’s t-tests for pairs of values. The results with values of p<0.05 were considered significant.
RESULTS
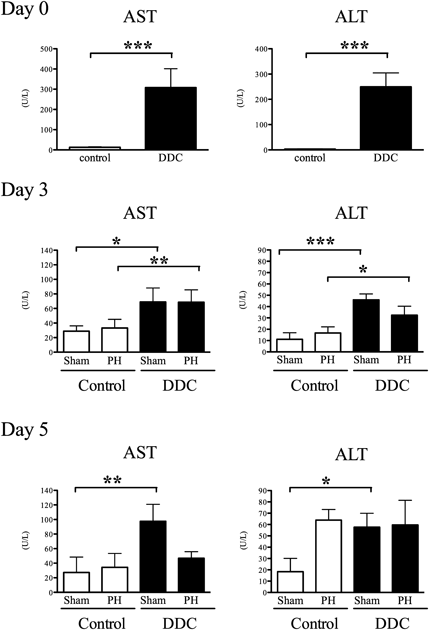
Partial Hepatectomy Enhances Liver Regeneration in Mice with DDC-Induced Liver InjuryMice were fed a diet containing 0.1% DDC or a control diet containing no DDC for 4 weeks.4) The mice were then subjected to 70% hepatectomy (PH group) or laparotomy only (sham group) (Fig. 1). To objectively evaluate the severity of liver injury, the activities of AST and ALT were measured.
On post-operative day 0, the AST and ALT activities in DDC-fed mice were higher than those in the control diet-fed mice, demonstrating that treatment with DDC induced liver injury. The severity of liver injury observed on post-operative day 0 remained nearly unchanged until post-operative day 5 (Fig. 2). In days 3 and 5, the AST and ALT was improved by discontinuation of administration of DDC9,10) (Fig. 2).
The degree of liver regeneration was evaluated by weighing the remnant liver and calculating the liver to body weight ratio. In control diet-fed mice, the liver to body weight ratio on post-operative day 5 was approximately 4-fold higher than on post-operative day 0 (Fig. 3). In DDC-fed mice, liver regeneration was also confirmed on post-operative day 5, although the increase in the ratio from days 0 to 5 was smaller (by approximately 1.5-fold) than in control diet-fed mice. Body weight was relatively stable during the 5-d observation period, at 42.95±1.80 g in control diet-fed mice and 40.12±2.37 g in DDC-fed mice.
It has been reported that the livers of DDC-fed compared with control diet-fed mice were markedly enlarged and DDC-induced liver injury led to similar significant increase of liver-to-body weight ratios.11)
Analysis of Expression Levels of CYP2R1 and CYP26A1 Following Partial Hepatectomy in Mice with Liver InjuryThe expression patterns of the hepatocyte differentiation markers CYP2R1 and CYP26A1 following partial hepatectomy in mice with liver injury were analyzed. On post-operative day 3, the oval cell markers CK19 and EpCAM were detected in DDC-fed mice of both the sham group and PH group, while neither of these markers, except for AFP were found in the corresponding groups of control diet-fed mice (Fig. 4A). These results suggest that oval cells, a type of hepatic stem cells, emerged following the induction of liver injury by DDC (Fig. 4B). The expression of AFP, a hepatoblast marker, in mice with liver injury was markedly higher in the PH group than in the Sham group,
Notably, CYP2R1 and CYP26A1 were highly expressed in only DDC-fed mice of the PH group, in which hepatoblasts emerged. The expression levels of the oval cell markers CK19 and EpCAM on post-operative day 5 in DDC-fed mice of the PH group were lower than those in the sham group (Fig. 5). These findings indicate that hepatectomy enhances the differentiation of oval cells into hepatoblasts in mice with DDC-induced liver injury, and that this differentiation is associated with increased expression of CYP2R1 and CYP26A1.
DISCUSSION
We previously found that CYP26A1 and CYP2R1 were transiently expressed during the differentiation from undifferentiated embryonic stem cells to hepatoblasts in a hepatic differentiation system, and suggested that CYP26A1 and CYP2R1 contribute to the differentiation into hepatocytes.7) In this study, we investigated whether the transient, high expression of CYP26A1 and CYP2R1 also occurred during differentiation from undifferentiated cells to hepatoblasts, using another differentiation system.
Mice were given DDC to cause liver injury, which induced oval cells, a type of undifferentiated cell. Using these oval cells, the expression patterns of CYP2R1 and CYP26A1 during differentiation into hepatoblasts were analyzed. Our results demonstrated that CYP26A1 and CYP2R1 were highly expressed during differentiation from undifferentiated cells, such as oval cells to hepatoblasts, indicating a potential role for CYP26A1 and CYP2R1 during cell differentiation into hepatoblasts.
CYP2R1 is expressed in the mouse liver and testis and is involved in the hydroxylation of vitamin D3 at position 25.12) At least six CYPs, including CYP2C11, CYP2D25, CYP2J3, CYP2R1, CYP3A4, and CYP27A1, have been identified as vitamin D25-hydroxylases. Among these, CYP2R1 is ubiquitously expressed in many animal species and hydroxylates both vitamin D2 and vitamin D3. The amino acid sequence of CYP2R1 is highly conserved over a wide range of animal species (e.g., 89% homology between mouse and human). The active form of the vitamin D receptor is responsible for regulating E-cadherin expression and therefore plays an important role in E-cadherin-mediated cell–cell transmission.13) This suggests that CYP2R1 accelerates liver regeneration by controlling the absolute amount of vitamin D.
CYP26A1 has been demonstrated to metabolize retinoic acid, which is the active form of vitamin A.14) Retinoic acid, which has an inhibitory effect on cell proliferation, has been used as an anticancer drug. Accordingly, CYP26A1 is considered to accelerate liver regeneration by metabolizing retinoic acid.
A recent report showed that when human induced pluripotent stem cell-derived hepatoblasts were transplanted in mice, the engrafted cells differentiated into hepatocytes in which normal metabolism occurred.15,16) Transplantation of induced pluripotent stem cell-derived hepatoblasts or hepatocytes differentiated from these cells into human recipients may be applied in the future.
The results of this study indicate that CYP2R1 and CYP26A1 are involved in the differentiation of not only embryonic stem cells, but also other undifferentiated cells into hepatoblasts. These findings may be important in selecting a cell source for future hepatocyte transplantation.
Acknowledgments
We thank Ms. Misa Iizuka, Ms. Konomi Oba, Ms. Mami Nakai, Ms. Saori Tomita, Ms. Tomoka Yasukawa, Mr. Osamu Kosaka, Mr. Hiroyuki Yoshida, for their technical assistance. The Ministry of Education, Culture, Sports, Science and Technology (MEXT) of Japan-Supported Program for the Strategic Research Foundation at Private Universities, 2014–2018, S1411019.
Conflict of Interest
The authors declare no conflict of interest.
REFERENCES
- 1) Miyaoka Y, Ebato K, Kato H, Arakawa S, Shimizu S, Miyajima A. Hypertrophy and unconventional cell division of hepatocytes underlie liver regeneration. Curr. Biol., 22, 1166–1175 (2012).
- 2) Fausto N, Campbell JS. The role of hepatocytes and oval cells in liver regeneration and repopulation. Mech. Dev., 120, 117–130 (2003).
- 3) Tanimizu N, Tsujimura T, Takahide K, Kodama T, Nakamura K, Miyajima A. Expression of Dlk/Pref-1 defines a subpopulation in the oval cell compartment of rat liver. Gene Expr. Patterns, 5, 209–218 (2004).
- 4) Wang X, Foster M, Al-Dhalimy M, Lagasse E, Finegold M, Grompe M. The origin and liver repopulating capacity of murine oval cells. Proc. Natl. Acad. Sci. U.S.A., 100 (Suppl. 1), 11881–11888 (2003).
- 5) Yasui O, Miura N, Terada K, Kawarada Y, Koyama K, Sugiyama T. Isolation of oval cells from Long-Evans Cinnamon rats and their transformation into hepatocytes in vivo in the rat liver. Hepatology, 25, 329–334 (1997).
- 6) Preisegger KH, Factor VM, Fuchsbichler A, Stumptner C, Denk H, Thorgeirsson SS. Atypical ductular proliferation and its inhibition by transforming growth factor beta1 in the 3,5-diethoxycarbonyl-1,4-dihydrocollidine mouse model for chronic alcoholic liver disease. Lab. Invest., 79, 103–109 (1999).
- 7) Ochiai W, Hirose A, Kawamura T, Komachi K, Yamamoto Y, Kitaoka S, Hatogai J, Kusunoki Y, Kon R, Ikarashi N, Sugiyama K. Role of the drug-metabolizing enzyme cytochrome P450 during mouse liver development. Biol. Pharm. Bull., 39, 2015–2021 (2016).
- 8) Schneider CA, Rasband WS, Eliceiri KW. NIH Image to ImageJ: 25 years of image analysis. Nat. Methods, 9, 671–675 (2012).
- 9) Ishida T, Kotani H, Miyao M, Kawai C, Jemail L, Abiru H, Tamaki K. Renal impairment with sublethal tubular cell injury in a chronic liver disease mouse model. PLoS ONE, 11, e0146871 (2016).
- 10) Nikam A, Patankar JV, Lackner C, Schock E, Kratky D, Zatloukal K, Abuja PM. Transition between acute and chronic hepatotoxicity in mice is associated with impaired energy metabolism and induction of mitochondrial heme oxygenase-1. PLoS ONE, 8, e66094 (2013).
- 11) Haybaeck J, Stumptner C, Thueringer A, Kolbe T, Magin TM, Hesse M, Fickert P, Tsybrovskyy O, Muller H, Trauner M, Zatloukal K, Denk H. Genetic background effects of keratin 8 and 18 in a DDC-induced hepatotoxicity and Mallory–Denk body formation mouse model. Lab. Invest., 92, 857–867 (2012).
- 12) Hrycay EG, Bandiera SM. Expression, function and regulation of mouse cytochrome P450 enzymes: comparison with human P450 enzymes. Curr. Drug Metab., 10, 1151–1183 (2009).
- 13) Peña C, García JM, Silva J, García V, Rodríguez R, Alonso I, Millán I, Salas C, de Herreros AG, Muñoz A, Bonilla F. E-Cadherin and vitamin D receptor regulation by SNAIL and ZEB1 in colon cancer: clinicopathological correlations. Hum. Mol. Genet., 14, 3361–3370 (2005).
- 14) Abu-Abed S, Dolle P, Metzger D, Beckett B, Chambon P, Petkovich M. The retinoic acid-metabolizing enzyme, CYP26A1, is essential for normal hindbrain patterning, vertebral identity, and development of posterior structures. Genes Dev., 15, 226–240 (2001).
- 15) Takebe T, Sekine K, Enomura M, Koike H, Kimura M, Ogaeri T, Zhang RR, Ueno Y, Zheng YW, Koike N, Aoyama S, Adachi Y, Taniguchi H. Vascularized and functional human liver from an iPSC-derived organ bud transplant. Nature, 499, 481–484 (2013).
- 16) Takebe T, Zhang RR, Koike H, Kimura M, Yoshizawa E, Enomura M, Koike N, Sekine K, Taniguchi H. Generation of a vascularized and functional human liver from an iPSC-derived organ bud transplant. Nat. Protoc., 9, 396–409 (2014).