Abstract
Article 25-2 of the Japanese Pharmacists’ Act was revised in June 2014, establishing the position of pharmacists as “advisors on the use of pharmaceuticals.” Prior to the Act’s revision, we investigated the perceptions of patients and pharmacists about pharmacists’ roles using a social science methodology. We also examined current opinions and necessary factors for the future growth and development of pharmacists. This questionnaire survey was conducted using an internet method. Patients and pharmacists answered 12 questions. Responses from 529 patients and 338 pharmacists were analyzed. For all items, pharmacists’ awareness of their roles exceeded patients’ awareness of the roles. In this study, the difference between pharmacist and patient awareness was larger than in similar research conducted in the United States. The greatest difference was observed in three items: “Understanding the effects of the drugs the patients are taking” (rate of high ratings: pharmacists 80.2%, patients 37.8%), “Understanding the health changes caused by the drugs dispensed to the patients” (pharmacists 80.2%, patients 28.4%), and “Consciously protecting patients from the adverse effects of drugs” (pharmacists 82.8%, patients 42.2%), indicating role discrepancy. Partition analysis indicated the three factors for a pharmacist to be regarded as a drug therapy or medication specialist: “The patient regards the pharmacist as his/her family or regular pharmacist,” “The pharmacist is making it easy for a patient to talk with him/her” and “The pharmacist is aware of a patient’s use of products other than prescribed drugs, such as over the counter (OTC) medications or health foods and nutritional supplements.” Future efforts are necessary to resolve role discrepancy and implement ongoing monitoring.
With the 1997 enforcement of Article 25-2 of the Pharmacists’ Act, pharmacists were positioned as information providers whose aim was to deliver safe and effective drug therapy for patients. Seventeen years later, in June 2014, Article 25-2 of the Pharmacists’ Act was revised, obligating pharmacists to provide patients not only with information but also instructions and guidance. Thus, this further clarified the role of pharmacists as advisors for the proper use of pharmaceuticals.
An overseas report investigated changes in pharmacists’ roles resulting from advancements in medical technologies and the subsequent revision of legal systems from sociological or sociopsychological perspectives.1)
In 2000, Assa and Shepherd used the interpersonal perception method of communication theory, derived from social psychology, to investigate perceptions held by pharmacists and patients about Pharmaceutical Care (P-Care) provided by American pharmacists.2) The interpersonal perception method compares the level of understanding and consent over specific tasks and particular issues between two individuals.3) The results revealed that pharmacists were unaware of patients’ lack of interest in P-Care. Furthermore, the authors reported that this gap was hampering the development of P-Care.
In 2007, with the role of pharmacists in America steadily changing from that of simple medication dispensing and compounding to that of patient advisors on drug therapy, Worley et al. used the sociological method of role theory to investigate and evaluate the gap between patients’ role expectations of pharmacists and pharmacists’ role cognition.4) Role theory regards occupations and titles/positions in society as “roles,” and studies the difference in expectations toward these roles held by the player of a particular role and those of society at large.5) The results showed no major differences between patients’ expectations and pharmacists’ cognitions regarding the usefulness of pharmacists’ information providing activities. However, the authors reported that patients held lower expectations than pharmacists about pharmacists’ role in managing patients’ drug administration and health maintenance. Therefore, they concluded that further research aimed at achieving congruence between the two perspectives was necessary.
Based on the views of role theory, Schommer and Gaither conducted factor analysis on the results of six periodic questionnaire surveys carried out between 1995 and 2010 to investigate how patients and pharmacists viewed the pharmacist role. The results showed that many pharmacists felt that they were pressed for time, which prevented them from providing patient care beyond simply dispensing medications.
On the other hand, the researchers reported that if a patient placed their trust in physicians’ advice on drug therapy, he/she did not acknowledge pharmacists as drug therapy advisors.6)
Irrespective of whether a study is based on interpersonal perception methods or role theory, it evaluates the services pharmacists offered to patients from the perspectives of patients and pharmacists. The primary goal is thus to identify gaps in perceptions on both sides and encourage both sides to work on narrowing such gaps.1)
In this study, we decided to investigate the perceptions held by pharmacists and patients on the role of the pharmacist as an advisor of pharmaceutical use immediately prior to the revision of Article 25-2 of the Pharmacists’ Act. A social science methodology was used to explore means of enhancing patients’ evaluations of pharmacists.
This study can provide basic information for examining changes in patients’ perceptions of the future roles played by pharmacists after the revision of Article 25-2 of the Pharmacists’ Act.
PATIENTS AND METHODS
This study describes the pharmacists’ and patients’ perceptions about the roles of pharmacists, and was conducted as part of research comparing pharmacists’ patient adherence instruction and registered dieticians’ nutrition education, using a social science methodology.
Questionnaire CreationUsing Worley et al.’s paper4) as a reference, we formulated a questionnaire on the role of the pharmacist as an advisor on pharmaceutical use. The questionnaire was created by five of the current study’s authors who have worked as pharmacists for twenty or more years.
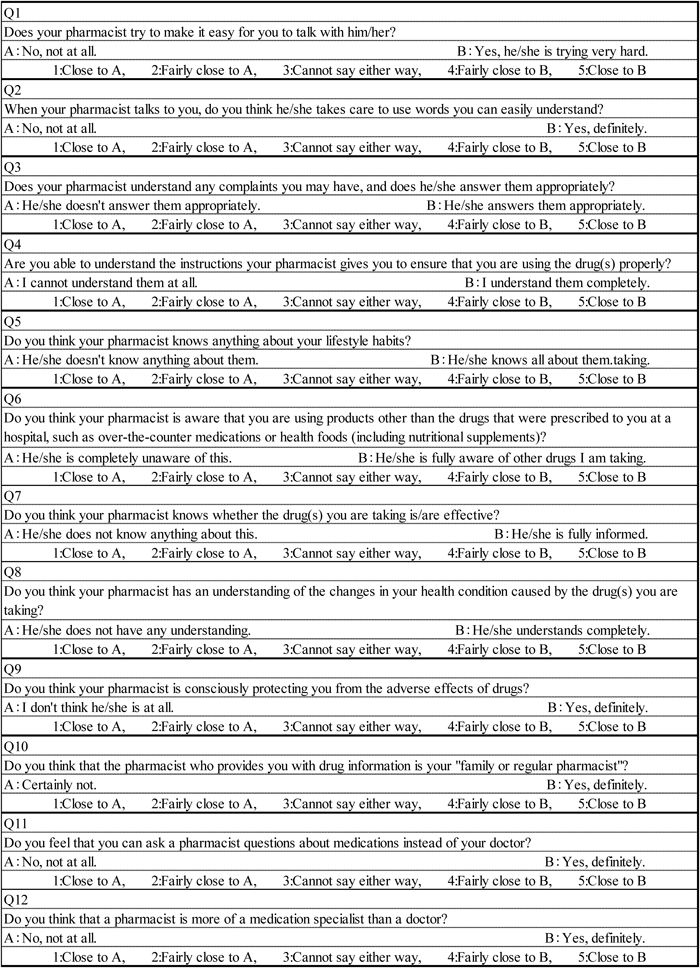
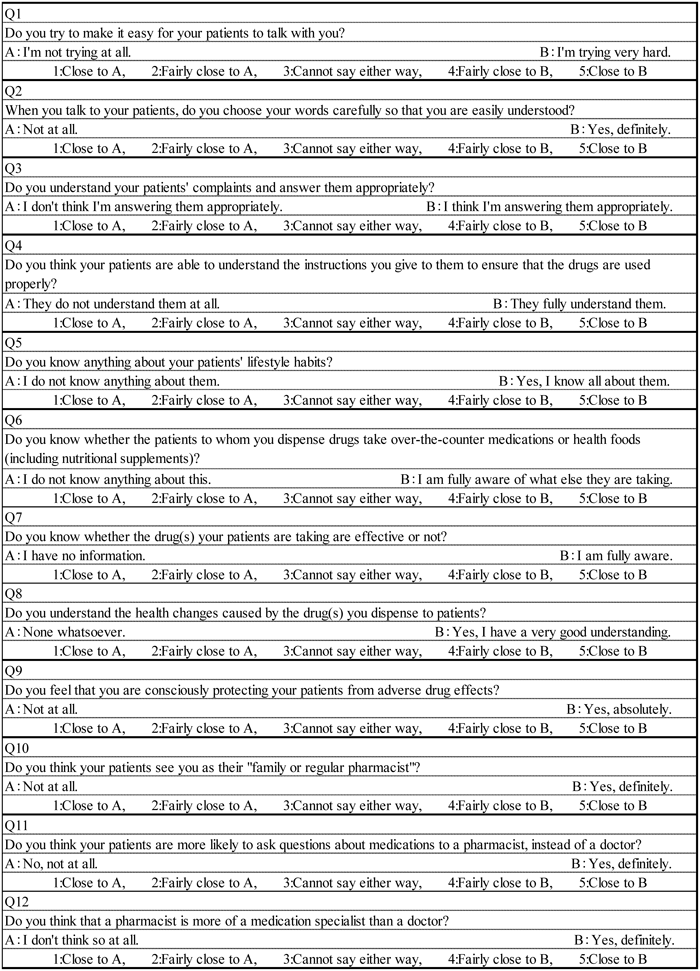
Questionnaires based on the interpersonal perception theory or role theory are generally created using questions about a particular issue that can be answered from both the patient’s and the pharmacist’s perspectives.1) Therefore, we created two questionnaires: one for patients and one for pharmacists (Figs. 1, 2). The answers were to be given on a 5-point scale, ranging from 1 to 5.
For convenience, the questionnaires were created by setting the following four types of dimensions: 1. “Communicating with the patient” (Q1–Q4), 2. “Understanding the patient” (Q5–Q8), 3. “A family or regular pharmacist” (Q9, Q10), and 4. “A medication specialist” (Q11, Q12). However, note that these are provisional classifications created by the researchers who felt they were necessary for evaluating a pharmacist as an advisor on pharmaceutical use. Thus, we once again extract and evaluate the factors after conducting a factor analysis of the results of the questionnaire survey.
Of the questions from Q1 to Q12, all questions other than Q4 evaluated the pharmacist, and only Q4 asked about the patient’s understanding. This is a dummy question to check the consistency of the respondents’ attitude in answering the questions.7,8) Therefore, we decided not to include the results of this particular question in the analysis.
Q11 and Q12 were posed to compare the pharmacists’ standpoint as a medication specialist with that of a physician. We hypothesized that the higher these ratings, the more pharmacists were recognized as medication specialists. It should be noted that, for each question, separate sentences were created to include both the patient and pharmacist (Table 1). Additionally, to increase the clarity of our findings, the question numbers are followed by the corresponding questions in parentheses in Results and Discussion.
Table 1. Comprehensive Representation of Questions for Both Patient and Pharmacist Surveys
| Expressions included in survey items for patients and pharmacists |
|---|
| Q1 | The pharmacist makes it easy for the patients to talk to him/her. |
| Q2 | The pharmacist talks by choosing his/her words carefully so that they are easily understood. |
| Q3 | The pharmacist understands complaints and responds appropriately. |
| Q4 | The patient is able to understand the instructions the pharmacist gives. |
| Q5 | The patient thinks that his/her pharmacist knows things about his/her lifestyle habits. |
| Q6 | The pharmacist knows that the patient takes OTC medications and other items. |
| Q7 | The pharmacist knows that the drug a patient is taking is effective. |
| Q8 | The pharmacist understands the health changes caused by the drug. |
| Q9 | The pharmacist is consciously protecting patients from the adverse effects of drugs. |
| Q10 | The patient regards his/her pharmacist as his/her family or regular pharmacist. |
| Q11 | The patient is more likely to ask questions about medications to a pharmacist than his/her doctor. |
| Q12 | The patient thinks that a pharmacist is more of a medication specialist than a doctor. |
We implemented the survey through internet research (Rakuten Research Inc., Company, Shinagawa, Tokyo, Japan). Respondents were registered monitors of Rakuten Research. The survey results were formatted in a manner that did not enable identification of respondents. Additionally, we have previously conducted research using the same type of internet survey.9–12)
PatientsBefore conducting the questionnaire, we screened individuals to collect respondents (patients) who had both the experience of undergoing patient adherence instructions from a pharmacist and nutrition education from a registered dietitian. After verifying these criteria, we were able to gather 1000 respondents, who completed the survey from March 27–31, 2014.
For this study, we identified patients who were currently receiving dispensing and patient adherence instructions on a periodic basis at community pharmacies. Specifically, we selected individuals who answered “yes” to the screening survey question, “Are you regularly receiving medication from a community pharmacy at the present time?”
Moreover, we excluded respondents who did provide an answer to any item, and those who had answered by selecting the same number for all twelve items. The rest were considered appropriate respondents, and their answers were analyzed.
PharmacistsAs with the patients, we conducted a screening survey to confirm individuals who would be able to answer the questionnaire as a pharmacist who had provided patient adherence instructions. Ultimately, a questionnaire survey was conducted targeting 870 individuals from April 21–25, 2014. Of the 870 respondents, those pharmacists who provided patient adherence instructions at community pharmacies were subject to analysis. Of these, we excluded those whose pharmacists’ license year of registration and the name of the Minister of Health and Welfare or the Minister of Health, Labour and Welfare at the time of registration did not match the records as these were deemed required information for answering the questionnaire. In addition, those did not answer any item, and those who selected the same number for all twelve items were excluded. The rest were considered suitable respondents and included in analysis.
Statistical AnalysisQuestionnaire Survey Comparisons and Investigative MethodsSurvey response results were compared and examined between the two groups using the Mann–Whitney U-test. Multi-group comparisons and investigations were analyzed with the Kruskal–Wallis test. Additionally, multiple comparisons were performed with the Scheffe test and the Steel–Dwass test. When significant differences were found for both the Scheffe and Steel–Dwass tests, the Scheffe test results were used.
Use of Average of Rank to Compare Differences in Responses Resulting from Patient and Pharmacist Characteristic DifferencesWhen a significant difference was found in the comparison between characteristics, the average of rank (AR-score) was utilized as a reference for the high and low comparison. AR-score is generally used as a statistical parameter to investigate the between-group differences with the Mann–Whitney U-test and the Kruskal–Wallis test.
Index for Comparisons of Pharmacists’ High and Low Assessments by Pharmacists and PatientsAR-scores were used to compare the high and low assessments of the pharmacist’s job by patients and pharmacists as well as between questions. As AR-score is a relative value, large and small comparisons cannot be completed for separately conducted test results. Accordingly, when comparing all patient and pharmacist responses, the Kruskal–Wallis test was performed for all patient and pharmacist responses to Q1–Q12, and the AR-score obtained from this test was used.
Additionally, we determined the rate of the number of responses for each rating (1–5) for each question item for the total number of respondents (529 patients, 338 pharmacists) and created a stacked bar graph. The total proportion of high rating responses (either a “4” or “5”) was defined as “rate of high ratings” (HR). Thus, both AR-score and HR were included in comparisons of patient and pharmacist assessments. There are reports of HR being used generally as an inter-group difference parameter for non-parametric testing.13,14)
Cronbach’s AlphaThe survey’s internal consistency was assessed using Cronbach’s alpha. When the alpha coefficient was 0.8 or higher, the measure was considered to have internal consistency.
Factor AnalysisFactor analysis was used to search for and construct concepts which consist of related survey items. Since it has the capacity to perform ordinal scale factor analysis, the R “mirt” software package was used. Additionally, number of factors was explored using the “psych” package. As the condition for analysis, the factor loading matrices with absolute values exceeding 0.6 were considered factors and analyses were carried out using varimax rotations.
Partition AnalysisIn order to find specific factors for the group of patients who assessed pharmacists highly as pharmaceutical experts, partition analysis was conducted. The survey response results (1–5) were analyzed as an ordinal scale. Through condition extraction, ordinal scale partition analysis is regarded as an operation to concentrate the population that includes more high ratings. Accordingly, to show the extent to which the extracted patient group rated pharmacists highly, that group’s HR was used as the objective variable.
Analyses for sections (1)–(5) were computed using the R Project for Statistical Computing (R Foundation for Statistical Computing, Vienna, Austria). Section (6) was analyzed using the Windows version of JMP5.1.2 (SAS Institute, Japan).
RESULTS AND DISCUSSION
Patient QuestionnairesOf the 1000 questionnaire subjects, 562 patients were currently receiving patient adherence instructions at community pharmacies. Of these, 529 were suitable respondents whose questionnaire responses were compiled and analyzed. Respondents’ resided within Japan’s 47 prefectures and can be broken down as follows: Kantō Region (36.2%), Kansai Region (18.7%), Chūbu Region (16.8%), Kyūshū/Okinawa Region (7.4%), Tōhoku Region (7.2%), Chūgoku Region (5.7%), Hokkaidō Region (4.9%), and Shikoku Region (3.1%). Table 2 shows the patient characteristics and the compilations of their questionnaire results. The Cronbach’s α coefficient was 0.88, indicating internal consistency.
Table 2. Patient Characteristics and Survey Results
| Attribute | Gender | Age | Duration of drug use (Year) | Number of disease |
|---|
| | Male/Female | ~39/40~64/65~ | Below 1/1~5/6~ | 1/2~ |
|---|
| n | 302/227 | 49/386/94 | 55/200/274 | 306/223 |
|---|
| Q1 | | NS | NS | NS | NS |
| Q2 | | p=0.006251 (M)<284 (F) | NS | NS | NS |
| Q3 | | NS | NS | NS | NS |
| Q4 | | NS | NS | NS | p=0.044254 (1)<278 (2~) |
| Q5 | | NS | NS | NS | NS |
| Q6 | | NS | NS | NS | NS |
| Q7 | | p=0.019278 (M)>248 (F) | NS | NS | NS |
| Q8 | | NS | NS | NS | NS |
| Q9 | | NS | NS | NS | NS |
| Q10 | | NS | NS | NS | NS |
| Q11 | | NS | NS | NS | p=0.016278 (1)>247 (2~) |
| Q12 | | NS | NS | NS | NS |
A comparison of the AR-scores among each attribute’s ranks/classes revealed that women showed higher values than men for Q2 (“The pharmacist talks by choosing his/her words carefully so that they are easily understood”), while men showed higher values than women for Q7 (“The pharmacist knows that the drug a patient is taking is effective”). No differences were found in relation to differences among age class or drug administration period. In terms of the number of diseases, patients who were taking drugs for one type of disease showed low values for Q4 (dummy question) and high values for Q11 (“The patient is more likely to ask questions about medications to a pharmacist than his/her doctor”).
The reasons for the significant differences seen between men and women for Q2 and Q7 are unclear, as are those for the significant difference found for the number of illnesses in Q4. On the other hand, the reason for a patient with one illness opting to consult a pharmacist rather than a physician is believed to be that patients usually consult a physician more frequently as the disease becomes more serious.
Pharmacist QuestionnairesOf the 870 respondents, 436 pharmacists were providing patient adherence instructions at community pharmacies. Of these, 338 were deemed to be suitable respondents. Respondents’ resided within Japan’s 47 prefectures and can be broken down as follows: Kantō Region (31.8%), Kansai Region (19.8%), Chūbu Region (17.4%), Kyūshū/Okinawa Region (11.1%), Chūgoku Region (6.2%), Tōhoku Region (6.2%), Hokkaidō Region (5.1%), and Shikoku Region (2.4%). Table 3 shows the pharmacist characteristics and their questionnaire results. The Cronbach’s α coefficient was 0.85, indicating internal consistency.
Table 3. Pharmacist Characteristics and Survey Results
| Attribute | Gender | Age | Career (Year) |
|---|
| | Male/Female | ①20s/②30s/③40s/④50s/⑤60s | Below 3/3~ |
|---|
| n | 174/164 | 22/135/104/60/17 | 26/312 |
|---|
| Q1 | | NS | NS | NS |
| Q2 | | NS | NS | NS |
| Q3 | | NS | p=0.042; 126(①)<182(③)**p=0.016; 126(①)<192(④)**p=0.038; 156(②)<192(④)** | NS |
| Q4 | | NS | NS | NS |
| Q5 | | NS | NS | NS |
| Q6 | | NS | NS | NS |
| Q7 | | NS | NS | NS |
| Q8 | | NS | NS | NS |
| Q9 | | NS | NS | NS |
| Q10 | | p=0.007183 (M)>155 (F) | p=0.039; 144(①)<207(④)**p=0.005; 152(②)<207(④)* | NS |
| Q11 | | NS | p=0.023; 128(①)<203(④)*p=0.033; 155(②)<203(④)* | NS |
| Q12 | | p=0.047179 (M)>159 (F) | p=0.027; 150(②)<192(④)** | NS |
NS: Not significant. * Scheffe test. ** Steel–Dwass test.
We examined the results of a gender-specific Mann–Whitney U-test, an age class-specific Scheffe and Steel–Dwass test, and a career-specific Scheffe and Steel–Dwass test, and obtained the following findings. For Q3 (“The pharmacist understands complaints and responds appropriately”): 20s<40s, 20s<50s, and 30s<50s. In Q10 (“The patient regards his/her pharmacist as his/her family or regular pharmacist”): women<men. In Q10 (“The patient regards his/her pharmacist as his/her family or regular pharmacist”): 20s<50s, and 30s<50s. Subsequently, for Q11 (“The patient is more likely to ask questions about medications to a pharmacist than his/her doctor”): 20s<50s, and 30s<50s. Finally, in Q12 (“The patient thinks that a pharmacist is more of a medication specialist than a doctor”): 30s<50s. Career-specific tests showed no significant differences in any of the items. Along with a rise in age, an increasing tendency was seen in a pharmacist’s awareness of executing his/her role as a pharmacist and being a specialist in drug therapy. This is likely because the higher the age, the higher a pharmacist’s sense of having acquired a role associated with his or her occupational identity.15)
Comparison between Patients and PharmacistsThe results of AR-score calculations are shown in Table 4 as well as in a stacked bar graph in Fig. 3. The values in parentheses in Table 4 represent HR (the rates from the bottom of Fig. 3 to the second level). The magnitude of the correlation between AR-score and HR was strong (r=0.989). As a result, we believe that it is valid to use AR-score or HR to compare patient and pharmacist questionnaire results.
Table 4. Pharmacist and Patient AR-Scores
| | Questionnaire item |
|---|
| n | Q1 | Q2 | Q3 | Q4 | Q5 | Q6 | Q7 | Q8 | Q9 | Q10 | Q11 | Q12 |
|---|
| Pharmacist | 338 | 7298 | 7195 | 6414 | 5680 | 4747 | 4724 | 6718 | 6646 | 7307 | 4762 | 5333 | 5981 |
| | (82.5) | (83.7) | (72.5) | (59.2) | (40.5) | (44.1) | (80.2) | (80.2) | (82.8) | (41.4) | (50.9) | (59.5) |
| Patient | 529 | 5354 | 6450 | 5286 | 7006 | 3092 | 3157 | 4434 | 3913 | 4875 | 4025 | 3731 | 4480 |
| | (50.7) | (74.1) | (49.9) | (77.5) | (19.1) | (24.6) | (37.8) | (28.4) | (42.2) | (32.7) | (24.4) | (34.0) |
| Difference | | 1944 | 745 | 1129 | −1326 | 1655 | 1568 | 2284 | 2733 | 2432 | 737 | 1602 | 1500 |
| | (31.9) | (9.6) | (22.6) | (-18.3) | (21.4) | (19.5) | (42.4) | (51.8) | (40.7) | (8.7) | (26.5) | (25.4) |
| Significance | | *** | *** | *** | *** | *** | *** | *** | *** | *** | *** | *** | *** |
The value in parenthesis means HR. *** p<0.001.
A significant difference was seen between the AR-scores of patient and pharmacist in all questionnaire items. Consequently, this indicates the presence of role discrepancy, which is a type of role conflict as defined by role theory5) (Table 4, Fig. 3).
Pharmacists showed high AR-scores for all the questions except Q4 (“The patient is able to understand the instructions the pharmacist gives”). Q4 was the only question where patients’ AR-scores surpassed those of pharmacists. This was because Q4 was the only question where respondents evaluated the role of the patient. This indicated that, as already stated in Materials and Methods, the questionnaire’s respondent provided appropriate answers (not aimlessly or carelessly).
Of the answers given, differences between the patient and pharmacist AR-scores were small for Q2 (“The pharmacist talks by choosing his/her words carefully so that they are easily understood”) and Q10 (“The patient regards his/her pharmacist as his/her family or regular pharmacist”). Regarding Q2 (“The pharmacist talks by choosing his/her words carefully so that they are easily understood”), both the pharmacists and patients gave the pharmacists high marks. On the other hand, for Q10 (“The patient regards his/her pharmacist as his/her family or regular pharmacist”), although the pharmacists underrated themselves, the difference from the patients’ evaluations was small. The reason the patients feel that pharmacists provided patient adherence instructions by choosing words carefully so that they are easily understood (Q2) was assumed to be because the core part of the 1997 Article 25-2 of the Pharmacists’ Act, was about the practice of a pharmacist’s patient adherence instructions. Thus, it is thought that after 17 years, the pharmacists’ communication/explanation skills have risen to a certain level. Although this was a watchword set forth in August 2005 by the Japan Pharmaceutical Association with the aim of consolidating the concept of “pharmacists who are trusted by the consumers,”16) in terms of patients seeing a pharmacist as his/her regular pharmacist (Q10), the results show that while pharmacists felt this had not sufficiently taken root, patients accepted it more than expected.
On the other hand, answers that showed large differences in AR-scores including Q7 (“The pharmacist knows that the drug a patient is taking is effective”), Q8 (“The pharmacist understands the health changes caused by the drug”), and Q9 (“The pharmacist is consciously protecting patients from the adverse effects of drugs”). Interestingly, these were the same items that had been identified as the “Responsible monitoring of patients” shown by the results of the factor analysis described in the following section. It will be important to resolve these discrepancies in order for pharmacists to fulfill their role as advisors on drug therapy.
Factor AnalysisTable 5 shows the results of factor analysis. Three factors were identified for both patients and pharmacists. For each factor, those having large factor loading values and whose contributions were relatively large are shown in bold.
Table 5. Results of Factor Analysis
| Patient | Pharmacist |
|---|
| Factor | Factor |
|---|
| Item | 1 | 2 | 3 | 1 | 2 | 3 |
|---|
| Q1 | 0.823 | −0.296 | 0.224 | 0.716 | −0.324 | 0.176 |
| Q2 | 0.870 | −0.120 | 0.083 | 0.811 | −0.237 | 0.103 |
| Q3 | 0.824 | −0.296 | 0.246 | 0.771 | −0.311 | 0.295 |
| Q5 | 0.116 | −0.683 | 0.314 | 0.081 | −0.524 | 0.577 |
| Q6 | 0.031 | −0.568 | 0.260 | 0.037 | −0.531 | 0.428 |
| Q7 | 0.306 | −0.851 | 0.108 | 0.248 | −0.835 | 0.101 |
| Q8 | 0.266 | −0.925 | 0.090 | 0.290 | −0.857 | 0.170 |
| Q9 | 0.547 | −0.536 | 0.190 | 0.487 | −0.627 | 0.131 |
| Q10 | 0.492 | −0.489 | 0.349 | 0.376 | −0.157 | 0.735 |
| Q11 | 0.221 | −0.200 | 0.858 | 0.467 | −0.090 | 0.451 |
| Q12 | 0.286 | −0.078 | 0.657 | 0.508 | −0.203 | 0.175 |
Q1–Q3, which were Factor 1 for patients, were classified for convenience as “communication with the patients.” Additionally, Factor 2 pertained to “the understanding/perception of the patients”
Factor 3 was “a medication specialist,” which coincided with the classifications made for convenience.
Among pharmacists, Factor 1 was positioned as “communication with the patients.” This configuration was the same as that of patients. On the other hand, Factor 2 that is composed of Q7 (“The pharmacist knows that the drug a patient is taking is effective”), Q8 (“The pharmacist understands the health changes caused by the drug”), and Q9 (“The pharmacist is consciously protecting patients from the adverse effects of drugs”) appears to be a concept that can be redefined as “responsible monitoring of the patient.” Thus, an important concept for an advisor on pharmaceutical use has been identified. However, these items were the top three items that showed large differences in the AR-scores between patients and pharmacists.
Factor 3 that consists of Q5 (“The patient thinks that his/her pharmacist knows things about his/her lifestyle habits”) and Q10 (“The patient regards his/her pharmacist as his/her family or regular pharmacist”) was believed to be closer to a pharmacist’s concept of “a family or regular pharmacist” than the items that were initially included in the concept of “a family or regular pharmacist,” which were Q9 (“The pharmacist is consciously protecting patients from the adverse effects of drugs”) and Q10 (“The patient regards his/her pharmacist as his/her family or regular pharmacist”). From the pharmacists’ responses, the concept of “a medication specialist” that consists of Q11 and Q12 was not identified.
The concept of a pharmacist as an advisor on drug therapy, which was identified from the content of all 11 questions, comprised the following three factors from the patients’ perspective: Factor 1. “Communication with the patient,” Factor 2. “Understanding the patient,” and Factor 3. “A medication specialist.” In contrast, from the pharmacists’ perspective, it was believed to consist of the following three factors: Factor 1. “Communication with the patient,” Factor 2. “Responsible monitoring of the patient,” and Factor 3. “A family or regular pharmacist.”
Factors That Comprise a “Medication Specialist”In our factor analysis, we used all questions except Q4 to extract various factors in an exploratory fashion, and evaluated the concepts that comprised the pharmacist profession. However, from a different point of view, it is also useful to hypothesize that evaluating a pharmacist highly as an advisor on pharmaceutical use equates with high evaluation for Q11 (“The patient is more likely to ask questions about medications to a pharmacist than to his/her doctor”) and Q12 (“The patient thinks that a pharmacist is more of a medication specialist than a doctor”), and identify the factors that enhance them. Therefore, we conducted partition analysis by taking either Q11 or Q12 as an objective variable, and questions 1 to 10 (with the exception of Q4) as explanatory variables, and investigated the factors seen in a group of patients who evaluated Q11 and Q12 highly (Table 6). If Q12 is used as an example, the patients’ HR for Q12 was 34.0%. However, if we added the conditions for the Q10 rating (“The patient regards his/her pharmacist as his/her family or regular pharmacist”) exceeding 4 in order to extract a group, we found that 173 patients fell into this group. Subsequently, their HR for Q12 was 49.7%, which was higher than the original 34%. Furthermore, there were 147 people in a group that was extracted with the additional condition of responding to Q1 (“The pharmacist makes it easy for the patients to talk to him/her”) with HR higher than 4. The 147 patients’ HR for Q12 was 53.7%. Similarly, when we added the condition of Q6 (“The pharmacist knows that the patient takes over the counter (OTC) medications and other items”)≥3, a group was extracted whose HR for Q12 was extremely high at 70%, although there were only 60 patients in this group. Even with Q11, the factors for narrowing down groups that gave high evaluation rating were Q10, Q1, and Q6. Therefore, in order for pharmacists to be more highly regarded as medication specialists, it is important for them to have their patient view them as his/her family or regular pharmacist (Q10), to try to make it easy for the patients to talk to them (Q1), and to be aware of the patient’s use of products other than prescribed drugs (e.g., OTC medications) or health foods and nutritional supplements (Q6).
Table 6. Extraction Conditions for HR Groups
| | n | % of Pt Q11≧4 | | n | % of Pt Q12≧4 |
|---|
| Original data | Q11 | 529 | 24.4 | Q12 | 529 | 34.0 |
| Additional condition | Q10≧2 | 440 | 27.1 | Q10≧4 | 173 | 49.7 |
| Q1≧5 | 70 | 50.0 | Q1≧4 | 147 | 53.7 |
| Q6≧3 | 34 | 70.6 | Q6≧4 | 60 | 70.0 |
A 2007 study published by Worley et al.4) includes questions similar to those used in our study including Q1 versus “Be easily approachable to discuss a patient’s medication concerns,” Q3 versus “Listen to patients when they have a medication question,” Q6 versus “Talk with patients whether or not it is OK to take their medications with over-the-counter products,” and Q8 or Q9 versus “Talk with patients about how to watch for medication side effects.” Therefore, we compared the results of their study and those obtained in our study. Because the scores in the Worley et al. study are shown on a 7-point scale, from 1 to 7, we first calculated a percentage for pharmacist and patient average score differences compared to patients’ average scores. This analysis resulted in small values such as Q1: 1%, Q3: 4%, Q6: 0%, and Q8 or Q9: 3%. Although there are differences in both the nuances in and investigation methodology for this survey that result in various problems making direct comparisons with our study, based on our HR and AR-scores (Table 4) there is substantial deviation. However, unlike Worley et al.’s4) study, we believe that our findings indicate that there is a large separation between pharmacists and patients.
Resolution of Role DiscrepancyMorton et al. state that a role conflict exists in the advice given by community pharmacists to cardiovascular disease patients and patients’ awareness of accepting such advice.17) To resolve such conflict, the researchers stress the need for pharmacists to first acknowledge the presence of such patients, and then to actively take on the challenges of offering them advice. In contrast, Assa and Shepherd state that it is possible to enhance these patients’ needs by educating them on the importance of P-Care.2) Similarly, in Japan we regard it as important for pharmacists to be aware that a large gap exists especially in terms of “Responsible monitoring of the patients,” and to proactively address their tasks as an advisor on the use of pharmaceuticals. On the other hand, Schommer and Gaither6) report that the issue of role discrepancy cannot be resolved unless the burden of drug dispensing tasks is lightened. Specifically, pharmacists would otherwise not be able to concentrate on P-Care and their work as advisor on the use of pharmaceuticals. Recently, several papers have been published stating that to make actual improvements, efforts are needed to increase opportunities for pharmacists to interact with patients in ways such as hiring dispensing assistants.18,19) Thus, it may be necessary to also consider these measures in Japan.
Study Limitations
Since this study involved monitor-style internet research, one limitation is selection bias because many subjects customarily use the internet for gathering information. Additionally, the self-report method is associated with different characteristic measurement errors than other reporting methods (e.g., phone surveys). However, bias exists for all questionnaire-based social research investigations (e.g., mail surveys, phone surveys, interview surveys).20) Consequently, the findings from the current study should be interpreted as the result of monitor-style internet research.
In addition, since the present study relied on internet research rather than direct contact with respondents, it is not possible to eliminate the possibility of fraudulent responses (e.g., deceit).
CONCLUSION
In Japan, a wide gap was shown to exist between the perceptions held by patients and those held by pharmacists concerning the role of the pharmacist as an advisor on the use of pharmaceuticals. An especially large difference was seen in the role of a pharmacist that was identified as “Responsible monitoring of the patients.” In particular, this pertains to understanding the effects of the drugs the patients are taking, recognizing changes in patients’ health conditions caused by the drugs they are taking, and maintaining an awareness of their responsibility to protect patients from the adverse effects of drugs. Consequently, there is a need to narrow this gap. To enhance patients’ recognition of pharmacists as advisors on the use of pharmaceuticals, it was deemed important for pharmacists to make patients acknowledge their status as a family or regular pharmacist; to be aware of the patients’ use of products other than drugs prescribed to them, such as health foods and nutritional supplements; and to try to make themselves approachable, so that patients would feel they could easily talk to them.
Based on the information derived from the results of the current study, it appears that pharmacists can recognize role conflict, and resolve it using the practice of “responsible monitoring of the patients.” With this in mind, pharmacists can then improve the quality of patients’ pharmaceutical treatment.
Acknowledgments
This work was supported in part by Grants-in-Aid for Scientific Research from the President of Josai University.
Conflict of Interest
The authors declare no conflict of interest.
REFERENCES
- 1) Guirguis LM, Chewning BA. Role theory: literature review and implications for patient–pharmacist interactions. Res. Social Adm. Pharm., 1, 483–507 (2005).
- 2) Assa M, Shepherd EF. Interpersonal perception: a theory and method for studying pharmacist’ and patients’ views of pharmaceutical care. J. Am. Pharm. Assoc., 40, 71–81, quiz, 123–125 (2000).
- 3) The handbook of experimental social psychology 5: interpersonal perception and social cognition. (Saito I. ed.) Seishin Shobo, Tokyo (1988).
- 4) Worley MM, Schommer JC, Brown LM, Hadsall RS, Ranelli PL, Stratton TP, Uden DL. Pharmacists’ and patients’ roles in the pharmacist–patient relationship: are pharmacists and patients reading from the same relationship script? Res. Social Adm. Pharm., 3, 47–69 (2007).
- 5) Syakaigaku Semina 1—Syakaigaku Genron. (Tominaga K, Shiobara T eds.) Yuhikaku Publishing, Tokyo (1982).
- 6) Schommer JC, Gaither CA. A segmentation analysis for pharmacists’ and patients’ views of pharmacists’ roles. Res. Social Adm. Pharm., 10, 508–528 (2014).
- 7) Mill RD, O’Connor AR. Question format shifts bias away from the emphasised response in tests of recognition memory. Conscious. Cogn., 30, 91–104 (2014).
- 8) Weijters B, Baumgartner H, Schillewaert N. Reversed item bias: an integrative model. Psychol. Methods, 18, 320–334 (2013).
- 9) Ohshima S, Hatori Y, Honma S, Terasawa K, Saitoh Y, Kobayashi D. Analysis of body constitution of fifty-two patients with Stevens–Johnson syndrome (SJS) using kampo medical questionnaires: prediction of SJS based on body constitution using a decision tree. Yakugaku Zasshi, 131, 745–756 (2011).
- 10) Ohshima S, Ieda M, Yamamoto M, Kobayashi D. The quantitative evaluation method of information value of initial symptoms based on Bayesian theory. Yakugaku Zasshi, 132, 763–768 (2012).
- 11) Kobayashi D, Hosaka S, Inoue E, Ohshima K, Kutsuma N, Oshima S, Okuno Y. Quantitative evaluation of initial symptoms as predictors to detect adverse drug reactions using Bayes’ theory: expansion and evaluation of drug-adverse drug reaction–initial symptom combinations using an adverse event reporting system database. Biol. Pharm. Bull., 36, 1891–1901 (2013).
- 12) Hosaka S, Yamamoto M, Saitoh T, Oshima S, Ohshima S, Ohshima K, Kutsuma N, Honma S, Kobayashi D. Decision tree analysis of 100 types of body constitutions as factors of adverse drug reaction. Jpn. J. Drug. Inform, 15, 64–70 (2013).
- 13) Robbins BN, Heiberger MR. Plotting Likert and other rating scales. JSM, 2011, 1058–1066 (2011).
- 14) Heiberger MR, Robbins BN. Design of diverging stacked bar charts for Likert scales and other applications. J. Stat. Softw., 57, 1–32 (2014).
- 15) Kodama M, Fukuda H. Effect of identity on attitude and behaviors related to productivity. Hiroshimadaigaku Shinrigakukenkyu, 6, 19–25 (2006).
- 16) Japanese Pharmaceutical Association. “Homepage.”: ‹http://www.nichiyaku.or.jp/yakuzaishi.php?globa›, cited 23 October, 2014.
- 17) Morton K, Pattison H, Langley C, Powell R. A qualitative study of English community pharmacists’ experiences of providing lifestyle advice to patients with cardiovascular disease. Res. Social Adm. Pharm., 11, e17–e29 (2015).
- 18) Jenkins A, Eckel SF. Analyzing methods for improved management of workflow in an outpatient pharmacy setting. Am. J. Health Syst. Pharm., 69, 966–971 (2012).
- 19) Chui MA, Mott DA, Maxwell L. A qualitative assessment of a community pharmacy cognitive pharmaceutical services program, using a work system approach. Res. Social Adm. Pharm., 8, 206–216 (2012).
- 20) Honda N. Quality of web surveys and access panel surveys: issues for utilization of web-based access panel surveys. Jpn. J. Labour Stud., 551, 32–41 (2006).