Abstract
Hydroxysafflor yellow A (HSYA) is an effective ingredient of the Chinese herb Carthamus tinctorius L. The present study investigated the protective effect of HSYA on lipopolysaccharide (LPS)-induced acute respiratory distress syndrome in mice, and the underlying mechanisms involved. HSYA (14, 28, 56 mg/kg) was intraperitoneally injected to mice once daily from day 1 to 10 after LPS administration. HSYA attenuated the body weight loss, the augmented left index and the increase of pathologic changes in pulmonary inflammation caused by LPS. Treatment with HSYA also alleviated increased expressions of tumor necrosis factor (TNF)-α, interleukin (IL)-1β, IL-6, transforming growth factor (TGF)-β1, collagen (Col) I, Col III, α-smooth muscle actin (α-SMA), myeloid differentiation (MD)-2, Toll-like receptor 4 (TLR4) and cluster differentiation (CD)14 at the mRNA (RT-PCR) and protein levels (Western blot and enzyme-linked immuno sorbent assay). Moreover, HSYA inhibited the elevated levels of nuclear factor (NF)-κB and α-SMA in lung tissue (immunohistochemistry), and alleviated the slight collagen deposition in pulmonary tissues (Masson’s trichrome staining). HSYA inhibited the specific binding of fluorescein isothiocyanate (FITC)-LPS on human lung epithelial cell line (A549) or human umbilical vein cell line (Eahy926) cells (flow cytometry). These findings suggested that HSYA has a protective effect on acute respiratory distress syndrome (ARDS) induced by LPS through blocking the TLR4/NF-κB pathway, and that the TLR4 receptor might be a target of HSYA on the cell membrane.
Acute lung injury (ALI) and its most severe form, acute respiratory distress syndrome (ARDS), remain primary causes of mortality in critically ill patients. ARDS is an acute and progressive respiratory failure disease characterized by early acute inflammation and massive fibrosis in the late stage, including pulmonary edema, prominent leukocyte accumulation and excessive deposition of extracellular matrix. Despite great improvements made on the pathophysiological studies of ARDS, the mortality rate remains significant at 35–40%.1) In the transition phase of ARDS between the inflammation and early fibroproliferation when the fiber hyperplasia begins to increase, only supportive treatments and lung protective ventilation have been shown to be beneficial by improving morbidity and mortality in the clinic.2) Therefore, treatment to suppress fibrosis hyperplasia with inflammation of ARDS is necessary.
Lipopolysaccharide (LPS) is a component of the outer membrane of Gram-negative bacteria and is the most common inducer of lung infections. It was reported that LPS directly induced the secretion of collagen in primary cultured mouse lung fibroblasts through the Toll-like receptor (TLR) 4/nuclear factor (NF)-κB-mediated pathway.3) So, it is meaningful to develop effective medicines to antagonize these targets from natural products.
Safflower is the dry flower of Carthamus tinctorius L. and is cultivated in many countries.4) It has been widely used as a Chinese medicine for treating coronary heart disease, gynecological diseases and other diseases with blood circulation obstructions. Safflor yellow (SY), the active part in the aqueous extract of the safflower, has been used for the treatment of cardiovascular disease for many years,5,6) Hydroxysafflor yellow A (HSYA) is the main active ingredient in SY. Our previous studies showed that HSYA attenuated airway remodeling in cigarette smoke/LPS-induced chronic obstructive pulmonary disease in rats, alleviated acute lung inflammatory responses induced by bleomycin in mice,7,8) possibly by inhibiting p38 mitogen-activated protein kinase (MAPK), NF-κB activation and interfering with inflammatory cytokine expression. In addition, it was reported that HSYA reduced ischemia/reperfusion-induced acute liver inflammation9) and that the aqueous extract of safflower ameliorated unilateral obstruction-induced renal interstitial fibrosis.10) These studies suggest that HSYA might alleviate ARDS with fibrosis and inflammation injuries. However, the effect of HSYA on the initial fibrosis in ARDS induced by LPS in mice is still not clear. TLR4/NF-κB plays a critical role in the induction of inflammatory responses.11) To understand the effect of HSYA on ARDS, we examined the effect of HSYA on early fibrosis in ARDS mice and TLR4/NF-κB mediated inflammatory injury induced by LPS.
MATERIALS AND METHODS
Chemicals and ReagentsSafflower, identified by Professor Jiashi Li (Beijing University of Chinese Medicine), was provided by Huahuikaide Pharmaceutical Co., Ltd. (Shanxi, China), and planted at Tacheng (Xinjiang Uygur Autonomous Region, China). LPS (Escherichia coli O55 : B5) and fluorescein isothiocyanate (FITC)-LPS (E. coli O55 : B5) were the products of Sigma Chemicals (St. Louis, MO, U.S.A.). LPS was dissolved in sterile 0.9% NaCl as a stock solution and the LPS working solution was freshly prepared by diluting with normal saline before use. Dexamethasone (DXM) was the product of the Tianjin Pharmaceutical Co., Ltd. (Tianjin, China). TRIZOL reagent and Moloney Murine Leukemia Virus (M-MLV) reverse transcriptase was the product of Invitrogen Co. (Carlsbad, CA, U.S.A.) and the SYBR® Premix Ex Taq™ (Perfect Real Time) kit was the product of Agilent Technologies, Inc. (Santa Clara, CA, U.S.A.). Enzyme-linked immunosorbent assay (ELISA) kits were from Shanghai ExCell Biology, Inc. (Shanghai, China); alpha-smooth muscle actin (α-SMA) primary antibody and TLR4 primary antibody were the products of Santa Cruz Biotechnology, Inc. (CA, U.S.A.); cluster differentiation (CD)14 primary antibody was purchased from R&D Systems Inc. (Minneapolis, MN, U.S.A.); myelord differentiation (MD)-2 primary antibody was purchased from Abcam (Cambridge, MA, U.S.A.); Collagen I (Col I) antibody was the product of Novus Biologicals (Littleton, Colorado, U.S.A.); Roswell Park Memorial Institute (RPMI)1640 medium was purchased from KeyGEN Biotech Co. (Nanjing, China); and cell culture plates were from Corning Co. (Corning Costar, Cambridge, MA, U.S.A.).
HPLC Analysis of HSYAHSYA was isolated and purified by macroporous esin-gel column chromatography from the aqueous extract of Carthamus tinctorius L. as previously described.12) The molecular weight of HSYA is 612 and the molecular structure is shown in Fig. 1.13) HSYA was dissolved in sterile 0.9% NaCl for subsequent use. HPLC analyses were performed with an Apollo C18 column (250×4.6 mm, 5 µm; Grace Davison) on a LC-10AT HPLC chromatographic system with an SPD-6AV UV detector (Shimadzu, Kyoto, Japan). The mobile phase consisted of acetonitrile (A) and 0.1% trifluoroacetic acid (B) at a flow rate of 1.0 mL/min. The gradient elution program was as follows: initial time 0 min at 1% solvent A, 99% solvent B; then from 0 to 50 min, solvent A was linearly increased from 1 to 35%, and solvent B was linearly decreased from 99 to 65%; from 50 to 60 min, solvent A was linearly increased from 35 to 45%, and solvent B was linearly decreased from 65 to 55%. The optical absorbance was monitored at 405 nm and the column temperature was 30°C. The purity of HSYA was quantitatively determined by the area normalization method. The purity of HSYA for this study was 95.2% (Fig. 2).
Animals and Drug AdministrationSpecific pathogen free mature male C57BL/6mice weighing 18–20 g were obtained from Vital River Laboratory Animal Technology Co., Ltd. (Beijing, China). (Certificate No: 11400700013001). Animals were maintained in the animal department of AnZhen Hospital with controlled temperature (23±2°C) and humidity (60±10%) under a 12 h light/dark cycle. This animal experiment scheme was approved by the Committee of the Ethics of Animal Experiments of Capital Medical University. All experimental procedures conformed to the Beijing Laboratory Animal Management Ordinance.
Before the experiment, the mice were adaptively bred for 1 week. Eighty-four mice were stratified randomly and divided into seven groups (n=12) according to body weight: normal control group; HSYA blank group (56 mg/kg); LPS group; LPS+HSYA groups (14, 28 and 56 mg/kg) and LPS+DXM (1.6 mg/kg) group. The mice in the LPS, LPS+HSYA and LPS+DXM groups were intraperitoneally (i.p.) injected with LPS (15 mg/kg twice) on the 1st and 3rd d, respectively, and mice in the normal control group and the HSYA blank group received the same volume of normal saline instead. From day 1, mice in the normal control group received an equal volume of normal saline and mice in the HSYA blank group received HSYA i.p. (56 mg/kg) respectively for 10 d. Mice in the LPS+HSYA and LPS+DXM groups were i.p. injected with various doses of HSYA or DXM (1.6 mg/kg) daily for 10 d. On day 10, the animals were anesthetized with pentobarbital sodium, sacrificed and samples were taken for the next analysis.
Left Lung IndexOn day 10, left lungs were removed, rinsed and weighed. Left lung index was calculated as follows8):
Histological ExaminationAfter animals were sacrificed on day 10, the left lungs were fixed in 4% paraformaldehyde, and then dehydrated and embedded in paraffin. The samples were then sectioned at 5 µm and stained with hematoxylin & eosin (H&E) or Masson’s trichrome according to conventional methods. Images and analysis of the slides were evaluated under a light microscope (Nikon Eclipse 90i) and histological analyses were performed blindly.
In Masson staining result, the deposition of collagen fibrosis was stained blue and the nuclei were blue black. The calculation procedure is as follows: After selecting suitable configuration parameters, we got the percentage of Masson staining positive area accounting for the whole lung tissue cross-sectional area by Aperio ScanScope and spectrum plus image quantitative analysis method. For each sample, total cross section of lung tissue was scanned. A gross area of the entity tissue region in the contour line of each slice was the denominator, and the area of the positive image was the numerator. The percentage represents the extent of collagen deposition in the lung tissue.
Immunohistochemistry AssayAfter deparaffinage with xylene and hydration with graded alcohol, the samples were incubated in citrate buffer (pH 6.0) at 96°C for 20 min to retrieve the antigen. After being washed with phosphate buffered saline (PBS) three times, the samples were blocked with rabbit serum for 30 min and subsequently incubated with mouse monoclonal primary antibody against α-SMA (1 : 200) or rabbit polyclonal primary p65 antibody (1 : 200) at 4°C overnight. After being washed with PBS, the samples were incubated in biotinylated rabbit (1 : 1000) or mouse anti-goat antibody (1 : 1000) for 60 min at 37°C and were visualized using a diaminobenzidine substrate. Cell nuclei were counterstained with hematoxylin. Positive staining for p65 or α-SMA was brown. For each section, an entire digital image at 200× magnification was obtained with NIS-ELEMENTS quantitative automatic program (NIKON, Japan). The positive staining area percentage in the entire cross-sectional area of left lobe of lung was calculated. The calculation method referred to Masson staining.
Quantitative Real-Time PCR AnalysisTotal RNA was extracted from frozen lung tissues using Trizol according to the manufacturer’s instructions. RNA quality and concentration were detected by a NanoDrop 2000 device (Thermo Scientific, Wilmington, DE, U.S.A.). In a reaction volume of 20 µL using M-MLV reverse transcriptase, 2 μg RNA was then reverse transcribed to cDNA using a RT-PCR kit. The mRNA level of the target gene was quantified by real-time PCR using a SYBR® Premix Ex Taq™ kit on a Bio-Rad iCycler iQ5 Detection System. PCR amplification conditions were as follows: initial denaturation at 95°C for 10 min followed by 39 cycles of denaturation at 95°C for 10s and annealing at 55°C for 30 s. The primer pairs and expected lengths (in bp) were as follows (5′ to 3′): tumor necrosis factor (TNF)-α: ACT GGC AGA AGA GGC ACT C (sense) and TGA GAA GAG GCT GAG ACA TAG G (antisense), 79 bp; interleukin (IL)-6: CTT GGG ACT GAT GCT GGT GAC A (sense) and GCC TCC GAC TTG TGA AGT GGT A (antisense), 118 bp; IL-1β: TTG GGC CTC AAA GGA AAG AAT (sense) and TGG GTA TTG CTT GGG ATC CA (antisense), 96 bp; CD14: TGT CGT GGG CAA CAA GGG ATG (sense) and AAG GTG GAG AGG GCA GGG AAG A (antisense), 142 bp; TLR4: ACC TGG CTG GTT TAC ACG TC (sense) and CTG CCA GAG ACA TTG CAG AA (antisense), 201 bp; MD-2: CTC TTT TCG ACG CTG CTT TC (sense) and CCA TGG CAC AGA ACT TCC TT (antisense), 221 bp; α-SMA: GTC CCA GAC ATC AGG GAG TAA (sense) and TCG GAT ACT TCA GCG TCA GGA (antisense), 102 bp; Col I: GCT CCT CTT AGG GGC CAC T (sense) and CCA CGT CTC ACC ATT GGG G (antisense), 103 bp; Col III: GGT CCA CAA GGA TTA CAA GGC ATA (sense) and TCC AGG AGC ACC GAC TTC AC (antisense), 102 bp; transforming growth factor (TGF)-β1: GAC TCT CCA CCT GCA AGA CCA T (sense) and GGG ACT GGC GAG CCT TAG TT (antisense), 101 bp; and glyceraldehyde-3-phosphate dehydrogenase (GAPDH): TGC GAC TTC AAC AGC AAC TC (sense) and ATG TAG GCC ATG AGG TCC AC (antisense), 143 bp. Relative mRNA levels were calculated using the 2−ΔΔCt method with data normalized to the GAPDH housekeeping gene.
ELISA AssayThe concentration of TGF-β1 and IL-6 in plasma was measured by ELISA kits. Before the measurement of total TGF-β1 in the supernatant, latent TGF-β1 was converted to the activated form by acidification followed by a neutralization step in accordance with the manufacturer’s instructions. The absorbance was measured at 450 nm using an ELISA reader (Epoch, Biotek, VT, U.S.A.).
Western Blot AnalysisFrozen lung tissue was homogenized in lysis buffer in an ice bath and homogenates were centrifuged at 12000 rpm for 15 min at 4°C to remove cellular debris. Protein concentration was determined using the bicinchoninic acid (BCA) kits from Beyotime Institute of Biotechnology (Jiangsu, China); Protein samples were separated by 10% sodium dodecyl sulfate polyacrylamide gel electrophoresis (SDS-PAGE) and transferred onto a nitrocellulose membrane using the wet transferring method. Subsequently, the membrane was first blocked with 5% nonfat dry milk in Tris-buffered saline-Tween (TBST) at room temperature for 1 h, and then hybridized with Col I (1 : 400), TLR4 (1 : 200), CD14 (1 : 200), α-SMA (1 : 200) and MD2 (1 : 400) primary antibodies overnight at 4°C, respectively. After three washes with TBST, membranes were incubated for 1 h at room temperature with IR Dye-conjugated secondary antibody (1 : 5000). The membranes were scanned and analyzed by an Odyssey IR imaging system (LI-COR Biosciences, Lincoln, NE, U.S.A.).
Cell Culture and Specific Receptor Binding AssayA549 (human lung epithelial cell line) cells were purchased from the Institute of Basic Medical Sciences, Chinese Academy of Medical Sciences. Eahy926 (human umbilical vein cell line) cells were kindly provided by Professor Haibo Zhu from the Institute of Materia Medica, Chinese Academy of Sciences. The cells were cultured in RPMI1640 medium supplemented with 10% fetal bovine serum, and 1% streptomycin–penicillin in an incubator containing 5% CO2 at 37°C. The cell FITC-LPS receptor binding was measured by EPICS® ALTRA™ flow cytometry assay (Beckman Coulter, Brea, CA, U.S.A.). For experiments, cells were seeded at a density of 1×10⁶ cells/well in 6-well culture plates for 24 h. A549 or Eahy926 cells were divided into six groups, respectively (n=3, lucifuge) : sham tube; FITC-LPS (10 µg/mL)tube ; FITC-LPS (10 µg/mL)+LPS (1 mg/mL) tube; FITC-LPS (10 µg/mL)+HSYA tubes (1, 4, or 16 µmol/L). Each tube containing cell suspension was incubated for 40 min at 37°C with shaking at a speed of 300 rpm. Then cells were cooled at 4°C for 10 min, centrifuged at 1500 rpm for 2 min and washed with PBS twice. The final cell suspension was used to measure the fluorescence intensity by flow cytometry assay. We used fluorescence intensity (gate %×X mean) to show the FITC-LPS binding ability.
Statistical AnalysisSPSS 19.0 software (SPSS, Inc., Armonk, NY, U.S.A.) was used to analyze the statistical significance of differences between groups. All data were expressed as the mean±standard deviation (S.D.). A one-way ANOVA with Student–Newman–Keuls (SNK) multiple comparison tests was used to perform the statistical analysis. Figures were generated with GraphPad Prism 5.0 software (GraphPad, San Diego, CA, U.S.A.). A p value less than 0.05 was considered statistically significant.
RESULTS
Effects of HSYA on LPS-Induced Body Weight ChangeTo estimate the protective effect of HSYA following LPS injury, mouse body weight was recorded each day. As shown in Fig. 3, the body weight of mice treated with LPS significantly decreased to 17.9±1.2 g by day 10 compared with the normal control group (23.2±0.9 g, p<0.01). HSYA treatment significantly attenuated the loss in body weight especially at a dose of 56 mg/kg (mean value of 21.7±1.1 g) compared with the LPS group, p<0.05 (Fig. 3A).
Effect of HSYA on Left Lung IndexLeft lung index was used to evaluate the severity of pulmonary edema. The LPS-induced lung injury was indicated by a significant increase of left lung index caused by lung edema and body weight loss. Treatment with HSYA and DXM significantly reduced the left lung index compared with the LPS group (Fig. 3B).
Effect of HSYA on Lung Histopathological Changes Assessed by H&E StainingNormal alveolar structures were intact and no thickened interalveolar septa and obvious inflammatory cell infiltration were observed in the normal control group (Fig. 4A) or the HSYA blank group (Fig. 4B). Massive infiltration of inflammatory cells and a marked thickening of the interalveolar septa were observed in the LPS group (Fig. 4C). Alveolitis was attenuated dose-dependently in HSYA groups and also in the DXM group (Figs. 4D–G). Inflammatory cell infiltration was significantly reduced in the LPS+56 mg/kg HSYA group compared with the LPS group, and findings in the DXM group were similar to the normal control group (Fig. 4).
Effect of HSYA on Excessive Collagen Deposition of Pulmonary Interstitial Fibrosis as Evaluated with Masson’s Trichrome StainingThe effect of HSYA on collagen deposition of pulmonary interstitial fibrosis was assessed by Masson’s trichrome staining (Fig. 5). Collagen is stained blue to distinguish it from other tissues. Little collagen deposition was found in the region of interstitial lungs in the normal control (Fig. 5A) and HSYA blank groups (Fig. 5B). Collagen deposition of interstitial lungs was slightly increased in the LPS group (Fig. 5C); however this was not significantly reduced in the LPS+HSYA groups (Figs. 5D–F). Collagen deposition of the interstitial lungs was effectively attenuated in the positive control LPS+DXM group (Fig. 5G). The result (Fig. 5H) also showed that, collagen deposition of interstitial lungs in LPS group was slightly increased compared to the normal control group, and this difference was statistically significant, but in the early fibrosis of ARDS, collagen deposition was not very serious so the protective effect of HSYA was not obvious. While, in the LPS+DXM group, lung interstitial collagen deposition was significantly reduced.
Effect of HSYA on α-SMA and NF-κB p65 Levels in Lung Tissues Assessed by Immunohistochemistry StainingThe results of immunohistochemical analysis for α-SMA and NF-κB p65 are shown in Figs. 6 and 7. The activation of NF-κB p65 was enhanced after LPS administration and the α-SMA level was elevated after lung fibroblasts differentiated into myofibroblasts. Low levels of α-SMA and NF-κB p65 were found around the vessels or airways in the normal control and the HSYA blank groups, but increased numbers of NF-κB p65 and α-SMA positive cells were found in the lung tissue from the LPS group (Figs. 6C, 7C). Treatment with HSYA and DXM significantly attenuated the increased NF-κB p65 or α-SMA-positive cell rate induced by LPS and was dose dependent (Figs. 6D–G, 7D–G). The column figures (Figs. 6H, 7H) also showed that, the levels of NF-κB p65 and α-SMA in the lung tissue of LPS group were significantly increased compared to the normal control group, and they were statistically significant. After different doses of HSYA administration, the inhibition with does–effect relationship was presented in the LPS+HSYA groups. The remission effect of LPS+DXM group was also obvious.
Effects of HSYA on CD14, TLR4, TNF-α, IL-1β, IL-6, TGF-β1, α-SMA, Col I and Col III mRNA Elevation in Lung Tissue of ARDS MiceQuantitative RT-PCR analysis revealed that the CD14, TLR4, TNF-α, IL-1β, IL-6, TGF-β1, α-SMA, Col I and Col III mRNA expression increased markedly in the LPS group compared to the normal control group, and this difference was statistically significant (Fig. 8). The LPS induced lung inflammatory injury obviously increased the mRNA levels of CD14, TLR4, TNF-α, IL-1β and IL-6, which are associated with TLR4/NF-κB signaling in mice (Figs. 8A–E). And the early pulmonary fibrosis in ARDS increased the mRNA levels of TGF-β1, α-SMA, Col I and Col III in relation to TGF-β1 signaling (Figs. 8F–I). Treatment with HSYA significantly attenuated the augmented mRNA expression dose dependently (Figs. 8A–I). A similar effect was also observed in the LPS+DXM group. These results indicated that HSYA down-regulated the expression of pro-inflammatory and pro-fibrosis cytokines.
Effect of HSYA on Plasma TGF-β1 and IL-1β Concentration in MiceThe plasma TGF-β1 (Fig. 9A) and IL-1β (Fig. 9B) levels increased significantly in the LPS group compared to the normal control group, and this difference was statistically significant. However, LPS+HSYA groups had attenuated TGF-β1 and IL-1β concentration dose dependently, the effects of LPS+DXM group and LPS+ HSYA group (56 mg/kg) were almost the same (Fig. 9). These results indicated that HSYA down-regulated the protein expression of TGF-β1 and IL-1β.
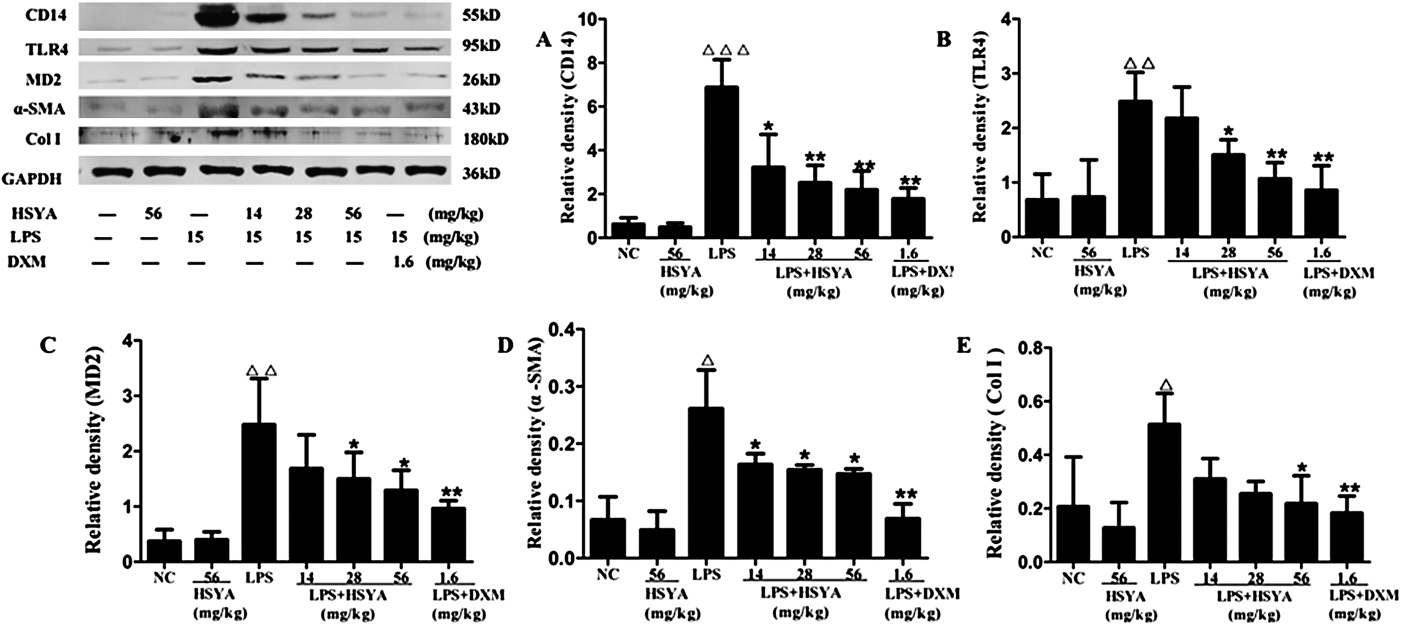
Effect of HSYA on CD14, TLR4, MD-2, α-SMA and Col I Level in Lung TissueTLR4/ NF-κB signaling is triggered by LPS and regulates the expression of pro-inflammatory cytokines in LPS-stimulated ARDS. CD14 and MD-2 are essential membrane proteins in the upstream pathway.14) Col I and α-SMA are also fibrosis factors expressed in ARDS.3) Western blot analysis revealed that the level of CD14, TLR4, MD-2, α-SMA and Col I in the LPS group was significantly augmented and that this augmentation was attenuated by both HSYA and DXM (Fig. 10). Column charts also showed that not all protein expressions of the above factors were decreased obviously in low dose HSYA group. However, the protein expressions of high dose HSYA group were decreased significantly, and the difference was statistically significant, but the effect was not as good as the LPS+DXM group.
Antagonistic Effect of HSYA on the Specific Binding of FITC-LPS with A549 or Eahy 926 Cell ReceptorsHSYA antagonized FITC-LPS specific binding with A549 (Fig. 11) or Eahy 926 (Fig. 12) cells. The peak of FITC-LPS group shifted to the right a little and the fluorescence intensity data was increased with statistical significance (Figs. 11, 12). After HSYA administration, the increased fluorescence intensity of flow cytometry (FCM) result was reduced, which may be the antagonistic effect of HSYA on the binding of LPS to the cell membrane receptor. These findings suggested that the target of HSYA to inhibit LPS induced damage might be on the cell membrane.
DISCUSSION
Our mouse model mimicked the inflammatory reaction associated with the initial fibrosis of sepsis-induced ARDS in humans by i.p. administration of LPS, enabling investigation of the effect of HSYA on ARDS. LPS i.p. injection twice in mice caused an increased left lung index and dramatic loss of body weight on day 4, and inflammatory cells infiltration was observed by HE staining. Masson’s Trichrome Staining showed slight lung collagen deposition at day 10. Lung fibroblasts were activated and myofibroblasts showed augmented α-SMA expression. Augmented expression of TNF-α, IL-1β, IL-6, TGF-β1, α-SMA, Col I and Col III was also observed. These findings were in accordance with the ARDS pathological process of inflammatory reaction and early fibrosis, suggesting that our animal model was established successfully.
However, the increased level of these cytokines was significantly attenuated and body weight gradually recovered after treatment with HSYA. Moreover, increased levels of key factors in activation of the TLR4 signaling pathway (CD14, MD-2, TLR4) were also elevated compared to the normal control group. Interestingly, HSYA significantly inhibited the augmentation of these factors especially at the 56 mg/kg dose. Thus, our results indicate the protective effect of HSYA on early fibrosis accompanied with inflammatory reactions in ARDS induced by LPS. Furthermore, DXM was used in our study as a positive control drug, which is widely used in the clinic as an anti-inflammatory drug to treat ARDS. We showed that DXM inhibited LPS-induced pulmonary inflammatory and pro-fibrogenic cytokine expression.
TGF-β1 plays a key role in inflammatory injury to trigger fibrosis.15) It mainly relies on Smad signaling transduction to induce the collagen synthesis. During the inflammation induced by LPS, TGF-β1 expression can be increased and the expression of collagen and α-SMA can be promoted. It was reported that the aqueous extract of safflower reduced liver fibrosis and renal interstitial fibrosis by suppressing TGF-β1expression.16) While, the effect of HSYA on the fibrosis of ARDS has not been reported up to now, our results indicate the protective effect of HSYA on early fibrosis of ARDS. Augmented expression of TGF-β1, α-SMA, Col I and Col III was decreased after the treatment of HSYA, especially at the 56 mg/kg dose. Although Masson results show that early fibrosis of ARDS has just begun to appear, we speculate that HSYA might relieve the fibrosis of ARDS. In previous study, we also found that HSYA can inhibit TGF-β1-induced the migration and proliferation of NIH/3T3 cells, and Smad signal transduction associated with pulmonary fibrosis in NIH/3T3 cells. We speculated that TGF-β1 receptor II may be the target of HSYA on the cell membrane,14,15) but further research is needed.
TLR4 signaling is triggered by LPS after binding of the surface molecules CD14 and LPS binding protein, resulting in the activation of NF-κB, triggering the expression of inflammatory mediators.17) To investigate the antagonizing effect of HSYA on the specific receptor binding LPS, we used a human lung epithelial cell line (A549) and human umbilical vein cell line (Eahy926). Alveolar epithelial cells and capillary endothelial cells are the two most common cells in lung tissue. Flow cytometry assay indicated that HSYA antagonized the specific binding of LPS to receptors on A549 or Eahy926 cell membranes. The water solubility of HSYA is high. It was suggested that it is difficult for HSYA to penetrate through cell membranes by passive diffusion and that it may act on the surface of cell membranes. Therefore, we predict that the effect targets of HSYA are likely on the cell membrane.
TLR4 is a cell membrane receptor that recognizes LPS, and has a key role in ARDS induced by LPS.18) In our study, treatment with HSYA significantly attenuated increased levels of p65 and some inflammatory cytokines. Song et al.19) reported that HSYA inhibited LPS-induced inflammatory signal transduction in A549 cells and reduced elevated TLR4 levels, this suppressed the activation of NF-κB and p38 MAPK, and reduced leukocyte adhesion to A549 cells. Jin et al.20) reported SY Injection ameliorated ALI by suppressing both p38 MAPK phosphorylation and NF-κB activation, subsequently leading to a dramatic reduction in inflammatory cell infiltration and pro-inflammatory cytokine expression in lung tissue. Based on these reports and our findings, we hypothesized that HSYA relieved the pulmonary inflammatory of ARDS induced by LPS by blocking TLR4 signaling pathways, and TLR4 may be the target of HSYA.
Safflower is an important traditional Chinese medicine used in the treatment of coronary heart disease, myocardial infarction and cerebral infarction. SY is the main active part of safflower and SY injection has been used to treat coronary heart disease in the clinic for over 10 years.21) The main active ingredient of SY is HSYA and more than 80% of the active ingredient content in SY injection is HSYA.22) Clinical studies23–25) reported that SY injection has a curative effect and few side effects for the treatment of coronary heart disease, cerebral infarction and pulmonary heart disease. Therefore, the use of SY injection instead of hormone therapy might be beneficial for the treatment of ARDS. In a word, our study suggested that HSYA significantly alleviated early fibrosis with inflammation injury of ARDS induced by LPS, and TLR4 may be one target of HSYA on the cell membrane. This also indicated HSYA might be an effective drug for the treatment of ARDS.
Acknowledgments
We thank Professor Haibo Zhu for providing the Eahy 926 cells. This research was sponsored by the Natural Science Foundation of China (No. 81202543).
Conflict of Interest
The authors declare no conflict of interest.
REFERENCES
- 1) Aakre BM, Efem RI, Wilson GA, Kor DJ, Eisenach JH. Postoperative acute respiratory distress syndrome in patients with previous exposure to bleomycin. Mayo Clin. Proc., 89, 181–189 (2014).
- 2) Andrews PL, Shiber JR, Jaruga-Killeen E, Roy S, Sadowitz B, O’Toole RV, Gatto LA, Nieman GF, Scalea T, Habashi NM. Early application of airway pressure release ventilation may reduce mortality in high-risk trauma patients: a systematic review of observational trauma ARDS literature. J. Trauma. Acute. Care. Surg., 75, 635–641 (2013).
- 3) He Z, Gao Y, Deng Y, Li W, Chen Y, Xing S, Zhao X, Ding J, Wang X. Lipopolysaccharide induces lung fibroblast proliferation through Toll-like receptor 4 signaling and the phosphoinositide kinase-Akt pathway. PLoS ONE, 7, e35926 (2012).
- 4) Dajue L, Mündel H-H. Safflower, Cathamus tinctorius L. Promoting the conservation and use of under utilized and neglected crops, Vol. 7, Institute of Plant Genetics and Crops Plant Research, Gatersleben/International Plant Genetic Resources Institute, Rome (1996).
- 5) Zhang Q. Experimental study of safflower yellow injection on the phase I clinical human tolerance. Tradit. Chin. Drug. Res. Pharmacol., 19, 146–148 (2008).
- 6) Nie PH, Zhang L, Zhang WH, Rong WF, Zhi JM. The effects of hydroxysafflor yellow A on blood pressure and cardiac function. J. Ethnopharmacol., 139, 746–750 (2012).
- 7) Wang Y, Xue C, Dong F, Peng Y, Zhang Y, Jin M, Zang B, Tan L. Hydroxysafflor yellow a attenuates small airway remodeling in a rat model of chronic obstructive pulmonary disease. Biol. Pharm. Bull., 37, 1591–1598 (2014).
- 8) Wu Y, Wang L, Jin M, Zang BX. Hydroxysafflor yellow A alleviates early inflammatory response of bleomycin-induced mice lung injury. Biol. Pharm. Bull., 35, 515–522 (2012).
- 9) Jiang S, Shi Z, Li C, Ma C, Bai X, Wang C. Hydroxysafflor yellow A attenuates ischemia/reperfusion-induced liver injury by suppressing macrophage activation. Int. J. Clin. Exp. Pathol., 7, 2595–2608 (2014).
- 10) Guo DZ, Wang YH, Chen ZQ. Effect of treatment in 39 patients with diabetic nephropathy by safflor yellow and benazepril in combination. Zhongguo Zhong Xi Yi Jie He Za Zhi, 28, 360–363 (2008).
- 11) Chu M, Ding R, Chu ZY, Zhang MB, Liu XY, Xie SH, Zhai YJ, Wang YD. Role of berberine in anti-bacterial as a high-affinity LPS antagonist binding to TLR4/MD-2 receptor. BMC Complement. Altern. Med., 14, 89–97 (2014).
- 12) Zang BX, Jin M, Li JR. Large scale preparation of pure Hydroxysafflor Yellow A by macroporus resin-gel column chromatography. J. Cardiovasc. Pulm. Dis., 27, 363–366 (2008).
- 13) Feng ZM, He J, Jiang JS, Chen Z, Yang YN, Zhang PC. NMR solution structure study of the representative component hydroxysafflor yellow A and other quinochalcone C-glycosides from Carthamus tinctorius. J. Nat. Prod., 76, 270–274 (2013).
- 14) Ma CY, Shi GY, Shi CS, Kao YC, Lin SW, Wu HL. Monocytic thrombomodulin triggers LPS- and Gram-negative bacteria-induced inflammatory response. J. Immunol., 188, 6328–6337 (2012).
- 15) de Pablo R, Monserrat J, Reyes E, Diaz D, Rodriguez-Zapata M, la Hera A, Prieto A, Alvarez-Mon M. Sepsis-induced acute respiratory distress syndrome with fatal outcome is associated to increased serum transforming growth factor beta-1 levels. Eur. J. Intern. Med., 23, 358–362 (2012).
- 16) Dong H, Liu Y, Zou Y, Li C, Li L, Li X, Zhao X, Zhou L, Liu J, Niu Y. Alteration of the ERK5 pathway by hydroxysafflor yellow A blocks expression of MEF2C in activated hepatic stellate cells in vitro: Potential treatment for hepatic fibrogenesis. Pharm. Biol., 52, 435–443 (2014).
- 17) Resman N, Oblak A, Gioannini TL, Weiss JP, Jerala R. Tetraacylated lipid A and paclitaxel-selective activation of TLR4/MD-2 conferred through hydrophobic interactions. J. Immunol., 192, 1887–1895 (2014).
- 18) Ramírez Cruz NE, Maldonado Bernal C, Cuevas Urióstegui ML, Castañoń J, López Macías C, Isibasi A. Toll-like receptors: dysregulation in vivo in patients with acute respiratory distress syndrome. Rev. Alerg. Mex., 51, 210–217 (2004).
- 19) Song L, Zhu Y, Jin M, Zang B. Hydroxysafflor yellow a inhibits lipopolysaccharide-induced inflammatory signal transduction in human alveolar epithelial A549 cells. Fitoterapia, 84, 107–114 (2013).
- 20) Jin M, Sun CY, Zang BX. Hydroxysafflor yellow A attenuate lipopolysaccharide-induced endothelium inflammatory injury. Chin. J. Integr. Med., 22, 36–41 (2016).
- 21) Piao YZ, Jin M. Advanced study of safflower on anti myocardial ischemia. Chin. Tradit. Herbal Drugs, 32, 473–475 (2001).
- 22) Wang L, Jin M, Zang BX, Wu Y. Inhibitory effect of safflor yellow on pulmonary fibrosis. Biol. Pharm. Bull., 34, 511–516 (2011).
- 23) Han B, Hu J, Shen J, Gao Y, Lu Y, Wang T. Neuroprotective effect of hydroxysafflor yellow A on 6-hydroxydopamine-induced Parkinson’s disease in rats. Eur. J. Pharmacol., 714, 83–88 (2013).
- 24) He H, Liu Q, Shi M, Zeng X, Yang J, Wu L, Li L. Cardioprotective effects of hydroxysafflor yellow A on diabetic cardiac insufficiency attributed to up-regulation of the expression of intracellular calcium handling proteins of sarcoplasmic reticulum in rats. Phytother. Res., 22, 1107–1114 (2008).
- 25) Liu YN, Zhou ZM, Chen P. Evidence that hydroxysafflor yellow A protects the heart against ischaemia–reperfusion injury by inhibiting mitochondrial permeability transition pore opening. Clin. Exp. Pharmacol. Physiol., 35, 211–216 (2008).