Abstract
Cisplatin is the most widely used anticancer drug in the world. Mono-chloro and none-chloro complexes of cisplatin may be believed to be the activated compounds. The separation of these compounds using octa decyl silyl column or aminopropylsilyl silica gel column is difficult because of high-reactivity and structural similarity. In this study, cisplatin, hydroxo complexes, and OH-dimer were determined by HPLC using a naphthylethyl group bonded with silica gel (πNAP) column. The analytical conditions of HPLC were as follows: analytical column, πNAP column; wave length, 225 nm; column temperature, 40°C; mobile phase, 0.1 M sodium perchlorate, acetonitrile, and perchloric acid (290 : 10 : 3), flow rate, 1.0 mL/min. Sample (20 µL) was injected onto the HPLC system. Retention time of cisplatin, mono-chloride, OH-dimer, and none-chloride was 3.2, 3.4, 3.6, and, 4.3–6.6 min, respectively. Measurable ranges with this method were 1×10⁻⁵ to 4×10⁻³ M for cisplatin. Correlation coefficient of the calibration curves of cisplatin was 0.999 (p<0.01). The within- and between-day variations of coefficient of variation (CV) were 5% or lower. In this study, injectable formulations in physiological saline solution, water for injection, 5% glucose solution, and 7% sodium bicarbonate precisely were measured the stability and compositional changes upon mixing by πNAP column rather than C18 column. We successfully determined cisplatin, hydroxo complexes, and OH-dimer by HPLC using a πNAP column. Thus the measurement of cisplatin (cis-diamminedichloro-platinum(II), cis-[PtCl2(NH3)2]) (CDDP) should be done using a πNAP column rather than a C18 column or aminopropylsilyl silica gel column.
Cisplatin (cis-diamminedichloro-platinum(II), cis-[PtCl2(NH3)2]) (CDDP) is an injectable anticancer agent used frequently in clinical practice.1–3) The chlorine (Cl) in CDDP is replaced with a water molecule in cells to form a hydrated complex and react with DNA.4) In addition, CDDP has been reported to change into various forms such as a hydrated complex and hydroxo-bridged complex (OH-dimer)5) (Fig. 1).
For the measurement of platinum agents including CDDP, the HPLC method as well as the atomic absorption spectrometry method and inductively coupled plasma-mass spectrometry method are employed.6,7) For the former method, derivatization by an octadecyl chemically bonded silica (C18, ODS) column such as a 5C18-MS-II, NH2-bonded column, and cholester column is performed. However, this could not separate the mono-chloro, none-chloro, and dimer body of detached chlorine from CDDP (di-chloro). Therefore, CDDP derivatized by sodium diethyldithiocarbamate (NaDDTC) is used for the measurement.8–11) Furthermore, the identification tests by HPLC using aminopropylsilyl silica gel column (normal phase chromatography) is described in the Japanese Pharmacopoeia, Seventeenth Edition (JP17). For the latter method, the total content of platinum itself is being measured. To date, no studies have separated and measured these agents that enable desorption of chlorine molecules from CDDP (di-chloro).
In this study, we verified the safety, rate of the equilibrium reaction, and compositional changes upon mixing (compared the C-18 column) of CDDP using a πNAP column (Nacalai Tesque, Inc., Kyoto, Japan) introduced in 2005, which is a reverse-phase chromatography column with the naphthylethyl group being chemically bonded with the silica gel, with the aim of separating and quantifying the di-chloro, mono-chloro, none-chloro, and OH-dimer body of CDDP.
MATERIALS AND METHODS
ReagentsSynthesis of CDDP (di-chloro), cis-dinitratodiammine-platinum(II) (di-nitrate; the nitric body with the chloride ions in the mono-chloro replaced with the nitrate ions), and di-m-hydroxo-bis[diammine-platinum(II)] nitrate (OH-dimer nitrate) (the dimer generated from monohydroxy-monoaqua body of the di-chloro), was performed at the Laboratory of Bio-Analytical Chemistry for Pharmaceutical Sciences, Osaka University of Pharmaceutical Sciences, Japan. Physiological saline (FUSO Pharmaceutical Industries, Ltd., Osaka, Japan), water for injection (FUSO Pharmaceutical Industries, Ltd.), 5% glucose (Otsuka Pharmaceutical Co., Ltd., Tokyo, Japan), 7% sodium bicarbonate (Otsuka Pharmaceutical Co., Ltd.) were purchased. As for the other reagents, those for HPLC and the special grade reagents were used.
CDDP of the Device and Measurement Conditions for the Identification Tests of Japanese PharmacopoeiaThe condition of the identification tests by HPLC using aminopropylsilyl silica gel column (normal phase chromatography) in the Japanese Pharmacopoeia, Seventeenth Edition (JP17) is as follows (Method-1):
Method-1Column: aminopropylsilyl silica gel column (Nacalai Tesque Inc.). Mobile phase: ethyl acetate–methanol–H2O–N,N-dimethylformamide=25 : 16 : 5 : 5. Flow rate: 1.0 mL/min. Column temperature: 25°C. Detection wavelength: 310 nm.
The Device and Measurement Conditions in This StudyWe set up the measurement conditions of HPLC for this study as follows (Method-2):
Method-2Pump: LC-10AD VP (Shimadzu Corporation, Kyoto, Japan). Detector: SPD-10A VP (Shimadzu Corporation). Mobile phase: 100 mM NaClO4–acetonitrile–100 mM HClO4=290 : 10 : 3 (v/v/v). Flow rate: 1.0 mL/min. Column temperature: 37°C. Detection wavelength: 225 nm.
We used a Cosmosil® 5C18-MS-II column (Nacalai Tesque Inc.), Cosmosil® Cholester column (Nacalai Tesque Inc.), πNAP column (Nacalai Tesque Inc.), and aminopropylsilyl silica gel (NH2) column. In addition, we used OH-dimer nitrate to examine whether or not the separation of the nitrate ion and the OH-dimer body was possible, and used a separable column to optimize the measurement conditions.
Identification of the Peak Using the Di-chloro, Di-nitrate Body, and OH-Dimer NitrateThe peak that appeared during the measurement was identified using the di-chloro, di-nitrate, and OH-dimer nitrate under the above-mentioned conditions (Method-2). The di-chloro and di-nitrate were dissolved in ultrapure water and adjusted to make 2 mM solution. NaCl solution was added to the adjusted di-nitrate solution to make a Cl− concentration of 154 mEq/L. In addition, before adding the di-nitrate to NaCl and at 0, 10, 20, 30, 60, 90, 120, and 180 min after adding, HPLC measurements, spectrum measurements at 200–400 nm using an UV visible light spectrophotometer, and pH measurements were conducted. Furthermore, the OH-dimer nitrate was dissolved in ultrapure water to make 2 mM solution and measured by HPLC. Twenty microliters of these solutions were injected into the HPLC.
Creation of a Calibration Curve (Using Method-2)The di-chloro was dissolved in physiological saline to prepare standard solutions of 0.01, 0.05, 0.1, 0.5, 1.0, 2.0, and 4.0 mM. Twenty microliters of these solutions were injected into the HPLC. The peak area of the agent detected in each standard solution was calculated to perform a regression analysis, and consequently, a calibration curve was created. Of note, the physiological saline solution was used as a solvent for testing the calibration curve and for reproducibility.
Reproducibility (Using Method-2)We used the physiological saline solution with di-chloro concentrations being 0.01, 0.05, 0.1, 0.5, 1.0, 2.0, and 4.0 mM. Twenty microliters of these solutions were injected into the HPLC. We prepared 3 specimens at a time and measured 3 times for each time. As for the intraday coefficient of variation (CV), the measurements were performed 5 times every day at 9, 10, 11, 13, and 17 h, whereas for the inter-day CV, the measurements were performed once every day for 5 d. The mean value and standard deviation (S.D.) were calculated from the measured values to work out the CV. Of note, we used the physiological saline solution of pH 3 (same fluidity as the product) for CDDP, for creating a calibration curve, and for the reproducibility test.
Time-Dependent Changes at Various pH/Cl Ion Concentrations; pH Fluctuation Test Using Method-2CDDP was dissolved in the distilled water to prepare a 0.5 mM solution. By adding perchloric acid, solutions with the pH of 2, 3, 4, 5, and 6.5 (H2O) were prepared. At 0, 1, 2, 4, 8, 12, and 24 h after preparing each solution, pH measurement as well as measurements of CDDP, hydration body, and OH-dimer by HPLC method were performed. The peak area of each compound obtained from the measurement was divided by the area of CDDP at 0 h to compare the area ratio.
Cl− Concentration Fluctuation Test Using Method-2CDDP was dissolved in ultrapure water to prepare 0.5 mM CDDP solutions with Cl− concentrations of 0, 15.4, 77, and 154 mEq/L by adding NaCl. At 0, 1, 2, 4, 8, 12, and 24 h after preparing each solution, pH measurement as well as measurements of CDDP, mono-chloro, and OH-dimer using the HPLC method were performed. The peak area of each compound obtained from the measurement was divided by the area of CDDP at 0 h to compare the area ratio.
pH Fluctuation Test in the Presence of Cl− (154 mEq/L) Using Method-2CDDP was dissolved in ultrapure water to prepare 0.5 mM CDDP solution with a Cl− concentration of 154 mEq/L by adding NaCl. By adding perchloric acid, solutions of pH 3, 4, and 5 were prepared. At 0, 1, 2, 4, 8, 12, and 24 h after preparing each solution, pH measurement as well as measurements of CDDP, mono-chloro, and OH-dimer using the HPLC method were performed. The peak area of each compound obtained from the measurement was divided by the area of CDDP at 0 h to compare the area ratio.
Fluctuations of the CDDP Peaks in Physiological Saline Solution, Water for Injection, 5% Glucose Solution, and 7% Sodium Bicarbonate SolutionCDDP was dissolved in physiological saline solution, water for injection, 5% glucose solution, and 7% sodium bicarbonate solution to prepare 1.0 mM solutions. Twenty microliters of these solutions were injected into the HPLC at 1, 2, 4, 8, 12, and 24 h later using Method-2.
RESULTS AND DISCUSSION
The retention time of CDDP was 5.6 min and the symmetry factor of the peak of CDDP was 0.89 under the conditions of identification tests defined in Japanese Pharmacopoeia (Method-1; Fig. 2A). In addition, both the peaks of nitrate ion and OH-dimer body were not detected using an aminopropylsilyl silica gel column, respectively (Method-1, wave length; 225 nm, data not shown).
A favorable state of separation was achieved, as a result of which the retention time of CDDP became 3.2 min and the analysis of each sample was completed within 10 min using Method-2. The symmetry factor of the peak of CDDP was 0.83 (Fig. 2B).
As a result using the Method-2, the peak of NO3− and OH-dimer could not be separated by using a C18 column (Fig. 3A) and a cholester column (Fig. 3B), whereas as by using the πNAP column, two complete peaks appeared (Fig. 3C). Although the two peaks were observed when we subsequently examined using a cholester column, which is a reverse-phase chromatography column with its cholesteryl group chemically bound with silica gel, the baseline separation could not be achieved (resolution [Rs]=1.82, Fig. 3B). We therefore proceeded with the examination using a πNAP column, using which we could separate the OH-dimer and nitric acid ion completely (Rs=5.51, Fig. 3C).
Identification of the Peaks of Di-chloro, Mono-chloro Form, and OH-Dimer Using Method-2The dinitrate body was dissolved in water. Subsequently, 154 mEq/L of physiological saline solution was added to it. When the dinitrate body was dissolved in water, a smooth peak appeared at 2.8 min and between 4.3–6.6 min, which led to the assumption that it was rapidly separated into nitric acid ions and none-chloro. Then, 154 mEq/L of NaCl solution was added and observed for 3 h (Figs. 4, 5). A peak, which was not observed before adding NaCl, appeared at 3.2 and 3.4 min after NaCl addition and the former peak grew larger and the latter one disappeared as time passed. At 180 min after adding NaCl, those two peaks disappeared, and instead, di-chloro was formed 3.2 min later in the presence of NaCl. Of note, no peak appeared 3.6 min later. Because the peak that appeared 2.8 min later was not observed with temporal changes, it was assumed that it might be the peak of the nitrate ions derived from the nitric acid form (Fig. 3C). Moreover, the smooth peak that appeared between 4.3–6.6 min was inferred to be that of the none-chloro complex (Fig. 4). When the temporal absorption spectrum changes were measured after adding NaCl to the nitric acid form, it was observed that its shape came closer to that of CDDP over time (Fig. 5). Based on the above observations, it can be considered that in water, the nitrate ions separated rapidly from the di-nitrate body, which continues to exist as the none-chloro. It could be inferred that the mono-chloro was formed with 154 mEq/L NaCl, followed by the formation of the di-chloro, and changing into di-chloro completely in 3 h (Fig. 6). Therefore, the peaks at 3.2 and 3.4 min were considered to be of the di-chloro and the mono-chloro, respectively (Rs=1.57, Fig. 4). Furthermore, from the results of the measurement of the OH-dimer nitrate solution using HPLC, two peaks were observed at 2.8 and 3.6 min (Rs=5.51, Fig. 3C). The former peak and the latter peak were considered to be that of the nitric acid ion and the OH-dimer, respectively (Fig. 3C). Taken together, the di-chloro, mono-chloro, OH-dimer, and none-chloro were separable at 3.2, 3.4, 3.6, and 4.3–6.6 min, respectively. The forward reaction completed within 3 h after adding NaCl in the equilibrium reaction (Figs. 1, 4).
When CDDP was dissolved in distilled water, the peaks appeared at 3.2, 3.4, 3.6, and between 4.3–6.6 min using HPLC Method-2 with a πNAP column (Rs [3.2, 3.4]=1.57, Rs [3.4, 3.6]=1.77, Rs [3.6, 4.3–6.6]=1.11, Fig. 7A), although the peaks appeared at 3.1, 3.3 min, and unknown peaks using HPLC Method-2 with a C18 column (Rs=0.84, Fig. 7B).
Calibration Curve of CDDP (Di-chloro) Usig Method-2The calibration curve that was created using a standard CDDP (di-chloro) solution is shown in Fig. 8. The regression line and correlation coefficient of CDDP were y=4×10⁶x+43791 and R2=0.998, respectively. A favorable linearity was shown in CDDP in the range between 0.01 and 4.0 mM.
Reproducibility (by Method-2)As for the intra-day CV, CDDP physiological saline solution was measured 3 times repeatedly at 9, 10, 11, 13, and 17 h, from the result of which the CV was calculated (Table 1). The CVs of each CDDP physiological saline solution were less than 5%. The inter-day CV was measured 3 times once a day for 5 d, from the result of which the CV was calculated (Table 1). The CV of each CDDP physiological saline solution was less than 5%.
Table 1. Coefficient of Variation for within- and between-Day in Cisplatin Assay by High Performance Liquid Chromatography
| Concentration (mM) | Within-day | Between-day |
|---|
| Mean±S.D. | CV (%) | Mean±S.D. | CV (%) |
|---|
| 0.01 | 1.4×10⁴±491 | 3.4 | 1.3×10⁴±411 | 3.1 |
| 0.05 | 7.5×10⁴±3581 | 4.7 | 6.2×10⁴±2277 | 3.7 |
| 0.1 | 1.5×10⁵±6380 | 4.2 | 1.2×10⁵±5493 | 4.6 |
| 0.5 | 7.4×10⁵±34649 | 4.7 | 6.0×10⁵±15305 | 2.6 |
| 1.0 | 1.5×10⁶±45887 | 3.1 | 1.2×10⁶±42253 | 3.6 |
| 2.0 | 2.9×10⁶±106768 | 3.7 | 2.2×10⁶±62961 | 2.8 |
| 4.0 | 5.3×10⁶±150697 | 2.8 | 4.2×10⁶±114739 | 2.7 |
CV, Coefficient of variation. Data are shown as the mean±S.D. (n=5).
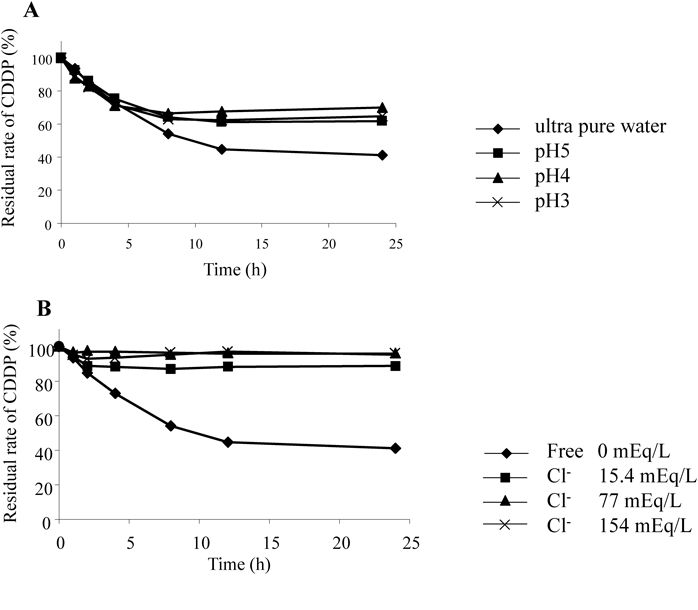
The pH of CDDP immediately after dissolution in water was 6.2, which reduced to 5.8 after 8 h. No change was found in solutions of pH 3, 4, and 5 (Fig. 9). The formation of the mono-chloro was probably due to the fact that hydrogen ions were released when Cl in water was replaced with OH, thus resulting in a decrease of pH. The residual rate of CDDP in water at 24 h when the pH was not adjusted was 41%, whereas those of pH 3, 4, and 5 were 64.8, 70.0, and 61.6%, respectively (Fig. 10A). The OH-dimer at 24 h was not detected under pH 3 condition.
Cl− Concentration Fluctuation Test of CDDP Using Method-2The residual rate of CDDP after 24 h in the Cl− free group was 41.0%, whereas those in 15.4, 77, and 154 mEq/L NaCl were 89, 96.1, and 95.3%, respectively (Fig. 10B). It was observed that the residual rate of CDDP would be approximately 100% in Cl− concentrations of 77 and 154 mEq/L. From the above results, it could be possible that the stability of CDDP increased due to the presence of chloride ions and that the detachment of H+ from an aqua body was suppressed due to the low pH values. Accordingly, it was confirmed that the CDDP agents in physiological saline solution with pH 3 are extremely safe.
The Measured Values of the Injectable Formulation in Physiological Saline Solution, Water for Injection, 5% Glucose Solution, and 7% Sodium Bicarbonate Using the πNAP ColumnAs shown in Table 2, the residual rates of each CDDP solution after 24 h were 98.8±0.9% in physiological saline solution (pH 4.5 to 7.0), 56.6±1.4% in water for injection (pH 4.5 to 7.0), 76.9±11.1% in 5% glucose solution (pH 3.5 to 6.5), and 13.2±1.2% in 7% sodium bicarbonate solution (pH 7.0 to 8.5), respectively (n=3). Though CDDP (di-chloro), mono-chloro, and dimer were not able to be separated by using the traditional methods, all the data from 0 to 24 h should be measured by using the πNAP column. The S.D. values in 5% glucose solution were relatively large because a wide range of pH values (from 3.5 to 6.5) was shown by sterilization.
Table 2. Time-Dependent Change for 24 h of the Measured Value in Each Injectable Formulation; Physiological Saline Solution, Water for Injection, 5% Glucose Solution, and 7% Sodium Bicarbonate Solution Using the πNAP Column
| (h) | Saline solution | Water for injection | 5% Glucose | 7% NaHCO3 |
|---|
| 0 | 100 | 100 | 100 | 100 |
| 1 | 103.2±0.1 | 93.8±3.8 | 100.6±6.1 | 95.8±4.6 |
| 2 | 98.0±7.1 | 86.4±2.4 | 100.7±11.3 | 87.3±1.7 |
| 4 | 104.0±4.7 | 79.8±4.2 | 89.4±18.2 | 83.6±2.7 |
| 8 | 103.1±6.0 | 68.5±3.7 | 78.0±12.5 | 60.6±2.8 |
| 12 | 98.7±2.7 | 59.6±6.0 | 69.6±13.4 | 35.8±3.6 |
| 24 | 98.8±0.9 | 56.6±1.4 | 76.9±11.1 | 13.2±1.2 |
Each value represents the mean±S.D. (%) (n=3).
Taken together, it was suggested that CDDP would enhance the formation of hydrated complexes depending on the pH value in the infusion solution that does not include Cl− used for preparation, and consequently, the CDDP content would decrease with time. CDDP is stable under the conditions of pH 3 and Cl-ions existence.
This method is extremely useful as a way to measure the stability of CDDP, additionally compositional changes upon mixing of CDDP.
CONCLUSION
This current measurement method using a πNAP column has enabled the separation/quantification of the peaks of the di-chloro and mono-chloro between the peaks of the nitrate ions and OH-dimer. Thus the measurement of CDDP should be done using a πNAP column rather than a C18 column or aminopropylsilyl silica gel column.
Acknowledgment
The authors thank Mr. Yu Yamamoto and Mr. Takahiro Ogawa for the useful comments.
Conflict of Interest
The authors declare no conflict of interest.
REFERENCES
- 1) Esteban-Fernández D, Verdaguer JM, Ramírez-Camacho R, Palacios MA, Gómez-Gómez MM. Accumulation, fractionation, and analysis of platinum in toxicologically affected tissues after cisplatin, oxaliplatin, and carboplatin administration. J. Anal. Toxicol., 32, 140–146 (2008).
- 2) Judson I, Kelland LR. New developments and approaches in the platinum arena. Drugs, 59 (Suppl. 4), 29–38 (2000).
- 3) O’Dwyer PJ, Stevenson JP, Johnson SW. Clinical pharmacokinetics and administration of established platinum drugs. Drugs, 59 (Suppl. 4), 19–27 (2000).
- 4) Zwelling LA, Kohn KW. Mechanism of action of cis-dichlorodiammine-platinum(II). Cancer Treat. Report, 63, 1439–1444 (1979).
- 5) Andersson A, Ehrsson H. Stability of cisplatin and its monohydrated complex in blood, plasma and ultrafiltrate–implications for quantitative analysis. J. Pharm. Biomed. Anal., 13, 639–644 (1995).
- 6) Pera MF Jr, Harder HC. Analysis for platinum in biological material by flameless atomic absorption spectromery. Clin. Chem., 23, 1245–1249 (1977).
- 7) Hann S, Koellensperger G, Kanitsar K, Stingeder G, Brunner M, Erovic B, Müller M, Reiter C. Platinum determination by inductively coupled plasma-sector field mass spectrometry (ICP-SFMS) in different matrices relevant to human biomonitoring. Anal. Bioanal. Chem., 376, 198–204 (2003).
- 8) Andersson A, Ehrsson H. Determination of cisplatin and cis-diammineaquachloro-platinum(II) ion by liquid chromatography using post-column derivatization with diethyldithiocarbamate. J. Chromatogr., 652, 203–210 (1994).
- 9) Lopez-Flores A, Jurado R, Garcia-Lopez P. A high-performance liquid chromatographic assay for determination of cisplatin in plasma, cancer cell, and tumor samples. J. Pharmacol. Toxicol. Methods, 52, 366–372 (2005).
- 10) Aburahma MH, El-Laithy HM, Hamza YE-S. Oral bioavailability enhancement of vinpocetine using self-microemulsifying drug delivery system containing long chain triglycerides: Preparation and in vitro/in vivo evaluation. Research Regulatory Affairs, 27, 97–107 (2010).
- 11) Tezcan S, Özdemir F, Turhal S, İzzettin FV. High performance liquid chromatographic determination of free cisplatin in different cancer types. Der Pharma Chemica, 5, 169–174 (2013).