Abstract
L-Citrulline (L-Cit), a free amino acid from watermelon, has effects on hypertension and anti-oxidization; however, there are few reports of effects related to obesity. This study investigated the effects and mechanism of L-Cit on anti-obesity in obese/diabetic KK-Ay mice and high-fat diet fed Sprague–Dawley (SD) rats. L-Cit induced significant reduction of food intake, body weight and fat tissue mass in obese/diabetic KK-Ay mice. Moreover, blood glucose level did not change but free fatty acid level and serum insulin level were significantly decreased by treatment with L-Cit, suggesting that L-Cit improved glucose and fatty metabolism in obesity model mice. As well as obese/diabetic KK-Ay mice, there was a significant decrease in food intake and a tendency of body weight to decrease in high-fat diet fed SD rats treated with L-Cit. Also, levels of proopiomelanocortin (POMC), a food intake suppression peptide, increased in the hypothalamus. Our study suggests that L-Cit improves metabolic syndrome through decreased body weight by appetite suppression.
The trend of increasing western food consumption in Japan is a risk factor for obesity and insulin resistance, which are central in the development of metabolic syndrome.1,2) Metabolic syndrome is caused by the imbalance between energy intake and energy expenditure3) and results in hypertension, high blood glucose levels and diabetes, and is a risk factor for arteriosclerosis. Overeating, stress and lack of exercise cause metabolic syndrome. Metabolic syndrome patients have a non-functional satiety response by insulin and leptin resistance, which leads to overeating. It is important to investigate compounds which are affected during appetite suppression and improve metabolic syndrome.
Recently, a factor involved in appetite regulation, the food intake regulator proopiomelanocortin (POMC), was shown to affect appetite suppression. There are two signaling pathways which regulate POMC: leptin signaling and insulin signaling. Leptin is secreted by adipose tissue and regulates energy homeostasis, glucose and lipid metabolism, immune function and other systems. Binding of leptin to its specific receptor activates Janus kinase 2 (JAK2) and signal transducer and activator of transcription 3 (STAT3).4) Activation of STAT3 stimulates POMC expression in the hypothalamus. On the other hand, insulin signaling begins with binding of insulin to insulin receptor (IR), which results in phosphorylation of insulin receptor substrate 1 (IRS1). Phosphorylation of different points causes activation of protein kinase B (Akt) phosphorylation activity. If IRS1 serine is phosphorylated, signaling is inhibited and Akt phosphorylation activity decreases; if IRS1 tyrosine is phosphorylated, Akt is stimulated and phosphorylation activity increases, which leads to phosphorylation of Forkhead box O1 (FoxO1) by Akt.5,6) Finally, phosphorylated FoxO1 increases expression of POMC which causes appetite suppression.
L-Citrulline (L-Cit) is a free amino acid found in cucurbits, such as watermelon.7) L-Cit has been shown to play a role in the nitric oxide (NO) system in humans and was reported to have anti-hypertension and anti-oxidation effects.8) However there are few reports related to metabolic syndrome improvements.
In our previous study, food intake level and body weight gain tended to decrease by L-Cit treatment in normal-fat diet fed Sprague–Dawley (SD) rats. In our present study, we hypothesized that L-Cit may play a role in inhibiting food intake via the hypothalamus. Therefore, we investigated the anti-obesity effects of L-Cit and clarified the mechanism of appetite suppression using two types of obesity model animals, KK-Ay mice, which have naturally occurring metabolic syndrome and diabetes, and high-fat diet fed SD rats.
MATERIALS AND METHODS
Experimental AnimalsSix-week-old male KK-Ay mice were obtained from Japan SLC (Japan). All mice were maintained at 22–24°C under artificial lighting with 12 h/d light and dark cycles. Mice were fed CE-2 (normal chow, CLEA Japan, Inc., Japan) for 1 week to stabilize their metabolic conditions. Mice were then randomly assigned to two groups (n=7, 8 for each group): a control group (normal water); and L-Cit group (water with 1 g/kg body weight/d L-Cit). We administrated L-Cit to KK-Ay mice by free intake and measured food intake, body weight and non-fasting blood glucose levels of mice once every two weeks.
All mice were sacrificed at the conclusion of the 9-week treatment period after 22 h of fasting. Mice were anesthetized with pentobarbital (65 mg/kg/body weight). Blood samples were collected and sera were centrifuged, frozen, and stored at −20°C until later analyses. The tissues were immediately dissected and cleaned to measure organ weight and organs were promptly frozen in liquid nitrogen and stored at −80°C for Western blotting.
Five-week-old male SD rats were obtained from Japan SLC (Japan). All rats were maintained under the same conditions as KK-Ay mice. Rats were fed CE-2 (normal chow, CLEA Japan, Inc., Japan) for 3 weeks to stabilize their metabolic conditions. Rats were then randomly assigned to two groups (n=8 for each group): a control group (high-fat diet+normal water); and L-Cit group (high-fat diet+water with 0.5 g/kg body weight/d L-Cit). We used DIO Rodent Purified Diet w/60% Energy From Fat-Blue (Japan SLC, Inc.) as a high-fat diet. We administrated L-Cit to high-fat diet fed SD rats by free intake and measured food intake and body weight of rats once a week.
All rats were sacrificed at the conclusion of the 11-week treatment period after 22 h of fasting. Rats were anesthetized with pentobarbital (65 mg/kg/body weight). After collecting blood, liver, heart, kidney, brain, spermary adipose tissue and abdominal adipose tissue were immediately dissected and cleaned to measure organ weight, and hypothalamus was promptly frozen in liquid nitrogen and stored at −80°C for Western blotting. In addition we measured fasting blood glucose level using blood sera.
We determined the dose of L-Cit as human weighting 60 kg taken 5 g L-Cit daily and used twelve times in KK-Ay mice and six times in high-fat diet fed SD rats as much L-Cit as human daily intake level, respectively9) and decided our experiment period which the effect of L-Cit on anti-obesity was most strong.
All procedures were carried out in accordance with the guiding principles for the care and use of animals in the field of physiological sciences established by the Physiological Society of Japan, and the study was approved by the Ethics Committee of Laboratory Animals at Mukogawa Women’s University.
Blood AnalysisSerum glucose, cholesterol, triglyceride and free fatty acid levels were measured enzymatically using an assay kit (Wako Pure Chemical Industries, Ltd., Osaka, Japan). Concentrations of serum aspartate aminotransferase (AST) and alanine aminotransferase (ALT) were measured using corresponding commercial enzyme kits (Wako). Serum insulin level was analyzed using a rat enzyme-linked immunosorbent assay (ELISA) kit (SHIBAYAGI Co., Ltd., Japan) following the manufacturer’s protocol. Homeostasis model assessment-insulin resistance (HOMA-IR) was calculated by the formula: (fasting insulin×fasting glucose)/22.5 or a more recently updated computer model.10)
Primary and Secondary AntibodiesImmunoblotting was performed with the following commercially available antibodies: anti-rabbit Akt, anti-rabbit phospho-Akt (Ser473), anti-rabbit phospho-IRS1 (Ser1101, 318, 612), anti-rabbit mammalian target of rapamycin (mTOR), anti-rabbit phospho-mTOR (Ser2448), anti-rabbit phospho-S6K (Ser240/244), anti-rabbit phospho-JAK2 (Ser1007/1008), anti-rabbit STAT3, anti-rabbit phospho-STAT3 (Tyr705), anti-rabbit immunoglobulin G (IgG) and anti-mouse IgG from Cell Signaling Technology (Beverly, MA, U.S.A.); anti-rabbit POMC, anti-rabbit phospho-IRS1 (Tyr989), and anti-rabbit IRS1 from Santa Cruz Biotechnology; and anti-mouse β-actin from Sigma (St. Louis, MO, U.S.A.).
Protein Extraction ExperimentsHypothalamus tissue was homogenized in ice-cold homogenization buffer containing 50 mM Tris–HCl (pH 7.4), 100 mM NaCl, 1% Nonident P-40, 0.25% Na deoxycholate, 0.1% sodium dodecyl sulfate (SDS), 1 mM ethylenediaminetetraacetic acid (EDTA), 50 mM NaF, 2 mM Na3VO4, 30 mM Na pyrophosphate, 2 mM phenylmethylsulfonyl fluoride (PMSF), 1 mM benzanidine, 0.02 g/mL trypsin inhibitor, 0.02 g/mL leupeptin, and 0.02 g/mL aprotinin. After being incubated for 30 min on ice, lysates were centrifuged at 12000 rpm for 10 min and supernatants were isolated. Proteins were extracted by boiling the tissues in 0.5 mM Tris–HCl (pH 6.8), glycerol, 10% SDS, 0.1% bromophenol blue and 2-mercaptethanol.
Western Blot AnalysisProteins (20 µg/lane) were electrophoresed using 10−12.5% SDS-polyacrylamide gel electrophoresis (PAGE) gel at 100 V for 90 min. We used the same gel and the separate gel in our Western blot analysis because of experimental progress. After fractionating, proteins were transferred onto a polyvinylidene difluoride (PVDF) membrane (Amersham Life Science Inc., Buckinghamshire, U.K.) at 100 mA for 1 h. The membrane was blocked with Blocking One or Blocking One-P (Nacalai Tesque, Japan) for 30 min. After appropriate blocking, the membrane was incubated overnight with primary antibody in antibody solution 1 (Toyobo, Japan). It was then washed with TTBS containing 1 M Tris–HCl (pH 7.5), NaCl and 20% Tween 20 and finally incubated for 1 h with a 1 : 10000 dilution of anti-rabbit, goat and mouse IgG-horseradish peroxidase. Detection was achieved using a Chemi-Lumi One Super (Nacalai Tesque). β-Actin was used as an internal control. Densities of the bands were measured using Image J software.
Statistical AnalysisData are expressed as mean±standard error of the mean (S.E.M.). Statistical analyses of the data were performed by Student’s t-test between two groups. A p value of less than 0.05 was considered significant.
RESULTS
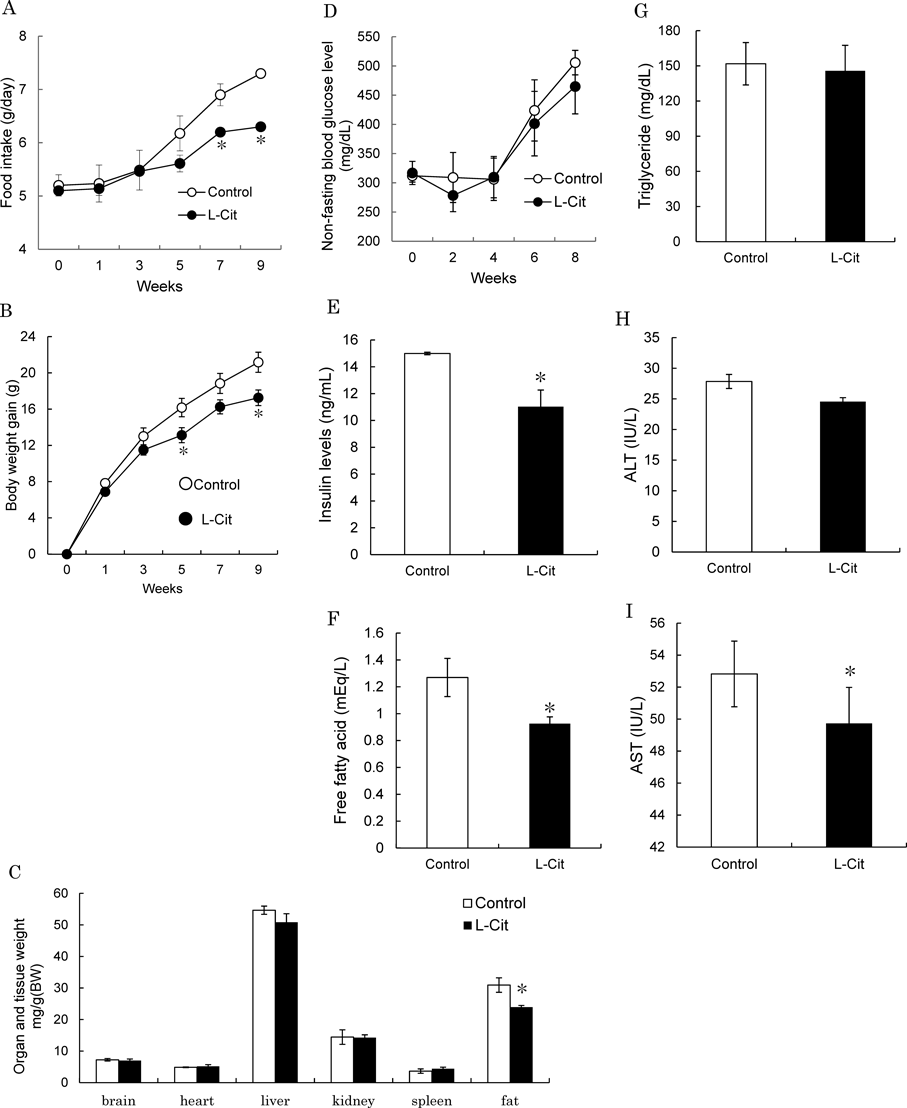
Effects of L-Cit on Food Intake, Body Weight, Tissue Weight, Blood Glucose Level and Serum Insulin Level in KK-Ay MiceFirst of all, we examined the effects of L-Cit on body weight, food intake and tissue weight in KK-Ay mice. When mice were treated daily with L-Cit or control for 9 weeks, there was a significant lower in food intake in the L-Cit group compared with the control group (Fig. 1A). Body weight gain also lowered significantly in the L-Cit group (Fig. 1B). There was a significant lower in testis adipose tissue weight in the L-Cit group but no significant differences in weights of other tissues between the two groups (Fig. 1C). In addition, non-fasting blood glucose level also was not significant differences between two groups and serum insulin level significantly decreased in the L-Cit group (Figs. 1D, E). These data suggest that L-Cit affects lowers in food intake and body weight and improves glucose metabolism.
Effects of L-Cit on Free Fatty Acid, Triglyceride, ALT and AST Levels in KK-Ay MiceNext, free fatty acid level was significantly lower in the L-Cit group than the control group after 9 weeks of administration with L-Cit, whereas there was no effect on triglyceride level (Figs. 1F, G). After 9 weeks of administration with L-Cit, ALT and AST levels, which indicate liver function, lowered in the L-Cit group (Figs. 1H, I), suggesting that L-Cit does not have after-effects on liver.
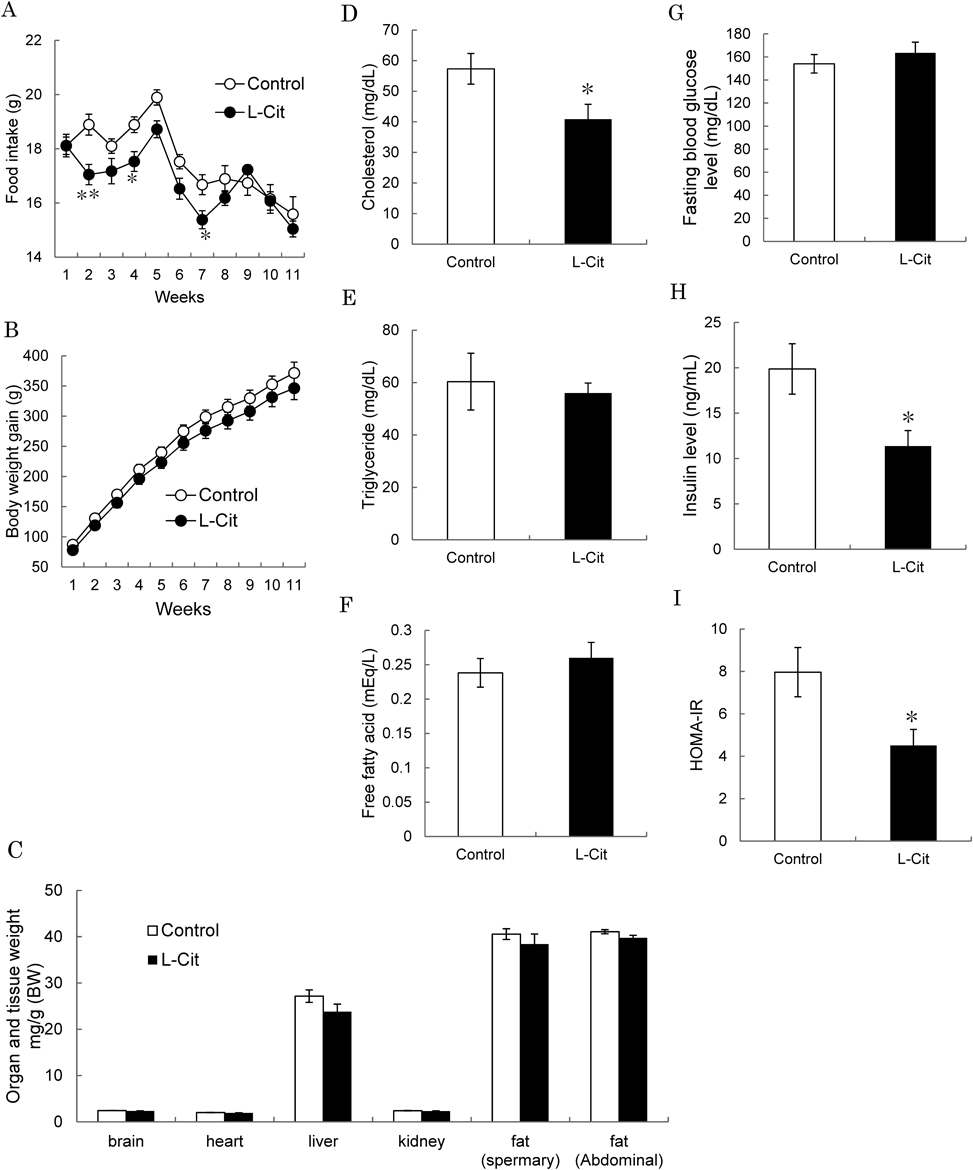
Effects of L-Cit on Food Intake, Body Weight and Organ and Tissue Weight in High-Fat Diet Fed SD RatsWe examined the effects of L-Cit on food intake, body weight and organ weight in high-fat diet fed SD rats. When rats were treated daily with L-Cit or vehicle for 11 weeks, there was no difference in food intake in the first week, but it significantly lower after the second week (Fig. 2A). Body weight tended to lower in the L-Cit group compared with the control group (Fig. 2B). However, there were no significant differences in organ and tissue weights between the two groups (Fig. 2C).
Effects of L-Cit on Blood Parameters in High-Fat Diet Fed SD RatsWe examined the effects of L-Cit on blood parameters in high-fat diet fed SD rats. Cholesterol level significantly lowered in the L-Cit group compared with the control group, but there were no differences in triglyceride and free fatty acid levels between control and L-Cit groups (Figs. 2D, E, F). Moreover, fasting blood glucose level also showed no difference but insulin level and HOMA-IR lowered significantly in the L-Cit group (Figs. 2G, H, I), suggesting that L-Cit treatment improves insulin sensitivity in high-fat diet fed SD rats.
Effects of L-Cit on Food Intake Regulation Factors in the Hypothalamus of High-Fat Diet Fed SD RatsAs L-Cit affected food intake in high-fat fed SD rats, we examined hypothalamic factors involved in food intake regulation. We measured expression of POMC, which affects appetite suppression, using Western blot analysis. Expression of POMC was significantly higher in the L-Cit group than the control group, suggesting that L-Cit affects appetite suppression by increased POMC expression (Figs. 3A, B). There are two signaling pathways which regulate POMC expression in the hypothalamus: leptin signaling and insulin signaling. First of all, to examine the effects of L-Cit on leptin signaling in the hypothalamus of high-fat diet fed SD rats, we calculated the ratios of JAK2 and STAT3 phosphorylation. Both JAK2 and STAT3 ratios of phosphorylation were not significantly different between the two groups, suggesting that leptin signaling was not stimulated by L-Cit treatment (Figs. 3A, C, D).
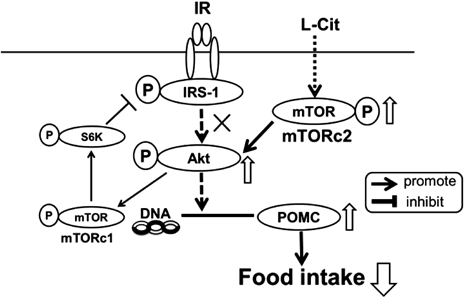
Effects of L-Cit on Insulin Signaling in the Hypothalamus of High-Fat Diet Fed SD RatsAs L-Cit was not involved in leptin signaling, we examined the effects of L-Cit on insulin signaling, which regulates POMC expression as well as leptin signaling, in high-fat diet fed SD rats. We measured phosphorylated Akt expression as it is a central enzyme in insulin signaling. Akt phosphorylation significantly increased in the L-Cit group compared with the control group (Figs. 3A, E). However, phosphorylated IRβ and IRS1 expression were not significantly different between the two groups (Figs. 3A, F, G, H, I, J), suggesting that Akt did not phosphorylate through IR-IRS1 signaling and we hypothesized that another pathway was stimulated by Akt. We measured phosphorylated mammalian target of rapamycin (mTOR) expression as another target of Akt phosphorylated signaling. Expression of phosphotylated mTOR was significantly higher in the L-Cit group than in the control group, suggesting that L-Cit enhanced Akt phosphorylation by stimulating mTOR (Figs. 3A, K). However, ribosomal S6 protein kinase (S6K) phosphorylation did not change with L-Cit treatment in high-fat diet fed rats (Figs. 3A, L).
DISCUSSION
The main results of this study were that L-Cit reduced appetite in both obese/diabetic KK-Ay mice and high-fat diet fed SD rats. The underlying mechanism was identified as increased expression of POMC in the hypothalamus. There were two signaling pathways, leptin signaling and insulin signaling, which regulated POMC expression.
Leptin is a key regulator of feeding and long-term energy homeostasis that acts on discrete neuronal pathways to reduce food intake and body fat content.11) One mechanism implicated in leptin regulation of cellular function is the activation of JAK2 and STAT3 signaling12,13) which appears to play a major role in the energy homeostasis mechanism. Phosphorylated STAT3 is translocated from the cytoplasm to the nucleus, stimulating POMC expression and inhibiting agouti-related protein (Agrp). In this study we showed that L-Cit does not phosphorylate JAK2 and STAT3, which are involved in leptin signaling. These results suggest that the change in POMC neuronal expression is not involved in leptin signaling in L-Cit treatment.
Akt is a central enzyme in insulin signaling and Akt activity is regulated by various factors, such as IR-IRS1 signaling and mTOR signaling. We clarified that L-Cit increased the ratio of phosphorylated Akt (Ser473) in the hypothalamus of high-fat diet fed SD rats. In our study, L-Cit did not affect IR-IRS1 signaling so we examined Akt-mTOR signaling as another possible pathway. mTOR, a phosphorylation target of Akt, was stimulated and increased expression by amino acids.14) mTOR is the catalytic subunit of complexes mTORC1 and mTORC2. If mTORC2 phosphorylation increases, Akt phosphorylation also increases FoxO1 phosphorylation, which increases POMC expression. On the other hand, mTORC1 activity causes a negative feedback loop on the insulin signaling pathway. Activation of mTORC1 leads to phosphorylation of downstream S6K, which participates in several processes including protein synthesis and proliferation.6,15) In addition, increased activity of the mTOR-S6K signaling pathway leads to serine phosphorylation of IRS1, creating a negative feedback loop to insulin signaling that attenuates insulin sensitivity.16,17) In our study, we considered that L-Cit stimulated mTORC2 phospholyration because phosphorylation of factors involved in signaling through mTORC1, such as S6K and IRS1, did not change between the two groups (Fig. 4).
In our previous study using 3T3-L1 adipocytes, we investigated into factors involved in adipose synthesis, lipolysis and metabolism. As a result, every factor did not change by L-Cit treatment, therefore we considered appetite suppression by L-Cit administration was main mechanism of body weight reduction.
In our study, we used two types of obesity model animals for clarifying the effect of L-Cit on metabolic syndrome. First, KK-Ay mice were used as a metabolic phenotype-associated model and we examined food intake level and effects on induction of obesity. As a result, food intake and free fatty acid level decreased significantly in KK-Ay mice despite not significantly decreasing in high-fat diet fed SD rats. High-fat diet fed SD rats were used as a model for a condition near obesity.18) By giving a high-fat diet to SD rats for 11 weeks, body weight increased further so we were able to obtain obesity model rats. Actually, body weight and cholesterol level tended to decrease, and insulin level and HOMA-IR significantly decrease in the L-Cit group in high-fat diet fed SD rats. From the results of reduction of free fatty acid level and serum insulin level in KK-Ay mice and cholesterol level and insulin level in SD rats with L-Cit treatment, we concluded that L-Cit improves lipid metabolism and glucose metabolism in the two types of obesity model animals. In addition, blood glucose level in KK-Ay mice and high-fat fed SD rats also were not significant differences between two groups but serum insulin level significantly decreased in the L-Cit group. Our data suggested that L-Cit reduced insulin level in KK-Ay mice and high-fat diet fed SD rats having nothing to do with blood glucose level. The reason why we got this result was improvement of insulin sensitivity by recovering metabolic syndrome with L-Cit treatment.
We considered why results of the two types of metabolic syndrome model animals differed, and one possibility was the difference of animal species. As results, L-Cit affects metabolic syndrome prophylaxis and improvement in two types of model animal, KK-Ay mice and high-fat diet fed SD rats.
We used high dose L-Cit however ALT and AST levels, which indicated liver function, were not affected. In addition, there was no trouble with condition of bowel movement and activity during our experiment period. Moreover, we observed the stomach and intestines when we dissected the organ, we cannot find abnormal condition. Therefore we considered L-Cit dose in our study did not have toxicity and side effect.
From now on, we will continue with our study; L-Cit may become a new compound for treatment of metabolic syndrome through appetite suppression and be used in clinical fields in the future.
Acknowledgments
We thank A. Watanabe for her technical support. High-fat diet fed rat experiments were performed with H. Kumano and M. Banba.
Conflict of Interest
The authors declare no conflict of interest.
REFERENCES
- 1) Wang T, Kusudo T, Takeuchi T, Yamashita Y, Kontani Y, Okamatsu Y, Saito M, Mori N, Yamashita H. Evodiamine inhibits insulin-stimulated mTOR-S6K activation and IRS1 serine phosphorylation in adipocytes and improves glucose tolerance in obese/diabetic mice. PLoS ONE, 8, e83264 (2013).
- 2) Kopelman PG. Obesity as a medical problem. Nature, 404, 635–643 (2000).
- 3) Susanti VY, Sasaki T, Yokota-Hashimoto H, Matsui S, Lee YS, Kikuchi O, Shimpuku M, Kim HJ, Kobayashi M, Kitamura T. Sirt1 rescues the obesity induced by insulin-resistant constitutively-nuclear FoxO1 in POMC neurons of male mice. Obesity, 22, 2115–2119 (2014).
- 4) Park HK, Ahima RS. Leptin signaling. F 1000 Prime Reports, 6, 73 (2014).
- 5) White MF. IRS proteins and the common path to diabetes. Am. J. Physiol. Endocrinol. Metab., 283, E413–E422 (2002).
- 6) Zoncu R, Efeyan A, Sabatini DM. mTOR: from growth signal integration to cancer, diabetes and ageing. Nat. Rev. Mol. Cell Biol., 12, 21–35 (2011).
- 7) Rimando AM, Perkins-Veazie P. Determination of citrulline in watermelon rind. J. Chromatogr. A, 1078, 196–200 (2005).
- 8) Hayashi T, Packiasamy ARJ, Matsui-Hirai H, Miyazaki A, Fukatsu A, Funami J, Iguchi A, Ignarro LJ. L-Citrulline and L-arginine supplementation retards the progression of high-cholesterol-diet-induced atherosclerosis in rabbits. Proc. Natl. Acad. Sci. U.S.A., 102, 13681–13686 (2005).
- 9) Reagan-Shaw S, Nihal M, Ahmad N. Dose translation from animal to human studies revisited. FASEB J., 22, 659–661 (2008).
- 10) Wallace TM, Levy JC, Matthews DR. Use and abuse of HOMA modeling. Diabetes Care, 27, 1487–1495 (2004).
- 11) Morrison CD, Morton J, Niswender D, Gelling W, Schwartz W. Leptin inhibits hypotharamic Npy and Agrp gene expression via a mechanism that requires phosphatidylinositol 3-OH-kinase signaling. Am. J. Physiol. Endocrinol. Metab., 289, E1051–E1057 (2005).
- 12) Banks AS, Davis SM, Bates SH, Myers MG Jr. Activation of downstream signals by the long form of the leptin receptor. J. Biol. Chem., 275, 14563–14572 (2000).
- 13) Tartaglia LA. The leptin receptor. J. Biol. Chem., 272, 6093–6096 (1997).
- 14) Tremblay F, Marette A. Amino acids and insulin signaling via the mTOR/p70S6 kinase pathway: a negative feedback mechanism leading to insulin resistance in skeletal muscle cells. J. Biol. Chem., 276, 38052–38060 (2001).
- 15) Shima H, Pende M, Chen Y, Fumagalli S, Thomas G, Kozma SC. Disruption of the p70(s6k)/p85(s6k) gene reveals a small mouse phenotype and a new functional S6 kinase. EMBO J., 17, 6649–6659 (1998).
- 16) Um SH, Frigerio F, Watanabe M, Picard F, Joaquin M, Sticker M, Fumagalli S, Allegrini PR, Kozma SC, Auwerx J, Thomas G. Absence of S6K1 protects against age- and diet-induced obesity while enhancing insulin sensitivity. Nature, 431, 200–205 (2004).
- 17) Um S, D’Alessio D, Thomas G. Nutrient overload, insulin resistance, and ribosomal protein S6 kinase 1, S6K1. Cell Metab., 3, 393–402 (2006).
- 18) An HM, Park S, Lee D, Kim J, Cha M, Lee S, Lim H, Kim K, Ha N. Antiobesity and lipid-lowering effects of Bifidobacterium spp. in high fat diet-induced obese rats. Lipids Health Dis., 10, 116 (2011).