Abstract
The homeostasis of muscle properties depends on both physical and metabolic stresses. Whereas physical stress entails metabolic response for muscle homeostasis, the latter does not necessarily involve the former and may thus solely affect the homeostasis. We here report that metabolic suppression by the hypometabolic agent 3-iodothyronamine (T1AM) induced muscle cell atrophy without physical stress. We observed that the oxygen consumption rate of C2C12 myotubes decreased 40% upon treatment with 75 µM T1AM for 6 h versus 10% in the vehicle (dimethyl sulfoxide) control. The T1AM treatment reduced cell diameter of myotubes by 15% compared to the control (p<0.05). The cell diameter was reversed completely by 9 h after T1AM was removed. The T1AM treatment also significantly suppressed the expression levels of heat shock protein 72 and αB-crystallin as well as the phosphorylation levels of Akt1, mammalian target of rapamycin (mTOR), S6K, forkhead box O1 (FoxO1) and FoxO3. In contrast, the levels of ubiquitin E3 ligase MuRF1 and chymotrypsin-like activity of proteasome were significantly elevated by T1AM treatment. These results suggest that T1AM-mediated metabolic suppression induced muscle cell atrophy via activation of catabolic signaling and inhibition of anabolic signaling.
Muscle atrophy is one of the prominent features during the prolonged decrease in physical stress. It accompanies remodeling of both the myofibrillar structure and contractile function of the tissue.1) Because physical activity depends on the milieu of contractile machinery, muscle atrophy is a consequence of the selective downregulation of sarcomeric proteins that matches the reduced physical demand.2) The stress also entails an active metabolic response of muscle cells for energy balance. According to Zurlo et al.,3) skeletal muscle contributes to 20–30% of the whole-body metabolic rate (MR) at rest and elevates the MR to 90% at maximum exercise to provide the required amount of energy.
By contrast, metabolic activity does not necessarily depend on physical stress. For instance, muscle cells can increase the MR by mitochondrial uncoupling in non-shivering thermogenesis, as distinguished from muscular shivering thermogenesis.4) Conversely, muscle cells can reduce the MR through hypometabolic agents such as 3-iodothyronamine (T1AM). The metabolic drop is found to occur independent of physical stress.5) Because cellular respiration determines the MR, the hypometabolic state is seemingly a model of the muscle cell disuse and wasting.6) Can metabolic suppression, then, induce muscle atrophy without physical involvement?
Previous reports have demonstrated that muscle atrophy results from an imbalanced regulation of protein contents in which catabolic activity overrides the anabolic processes in the cell.7) Cell signaling through Akt1/protein kinase B, mammalian target of rapamycin (mTOR) to p70/S6K is the best-known pathway responsible for the synthesis of muscle protein. The activation of these kinases has been implicated in the stimulation of protein anabolism through the phosphorylation of ribosomal protein components (e.g., S6).8,9)
Regarding the catabolic process, transcription factor forkhead box O proteins (e.g., FoxO1 and FoxO3) play a key role in muscle proteolysis.10) In an unloaded state, these transcription factors remain dephosphorylated in the nucleus and upregulate the expression of ubiquitin E3 ligases such as muscle RING Finger 1 (MuRF1) and atrogin-1/muscle atrophy F-box (MAFbx). These ligases carry unnecessary or damaged proteins to the proteasome for degradation.10,11) In a loaded state, however, Akt1 activation leads to the phosphorylation and nuclear exclusion of the FoxOs, which subsequently suppresses muscle atrophy.10) In addition, molecular chaperones like heat shock proteins (e.g., HSP72) have been found to play a crucial role in muscle homeostasis via both activation of the Akt1–S6K pathway and suppression of FoxO–ubiquitin–proteasome route.12,13)
T1AM is found in the majority of tissues including serum, brain, heart, skeletal muscle and liver and is produced by deiodination and decarboxylation of thyroxine (T4).14) This compound is shown to decrease the MR in both in vitro and in vivo models,5,14) and elicit the most potent hypometabolic effect among several other derivatives of T4 (e.g., T2AM, T3AM, 3′-T1AM).14) It has also been one of the most critically explored hypometabolic agents (e.g., H2S).15) The hypometabolic induction is likely elicited via its agonistic binding to the trace amine-associated receptors (e.g., TAAR1) in target cells, which might trigger currently unknown signaling pathways for metabolic suppression. This is opposed to the hypermetabolic activity of thyroid hormones T4 and tri-iodothyronine (T3). Briefly, the hormones traverse the cell membrane via iodothyronine transporters and bind to thyroid hormone receptors in the nucleus. The receptors in turn bind to thyroid hormone response elements and essentially activate transcription of relevant genes, causing hypermetabolic adjustments (e.g., increases in sympathetic activity and the MR).16)
In our recent studies,5,17) we demonstrated that the oxygen consumption rate (OCR) was reduced by 50% for ca. 2 h in mice and 40% for 6 h in mouse C2C12 myotubes when treated with 50 mg kg−1 and 75 µM of T1AM, respectively.5,17) Furthermore, the treated myotubes showed the elevated [AMP]/[ATP] ratio and activation of AMP-activated protein kinase (AMPK). The cells concurrently increased the enzyme activities responsible for lipid mobilization including pyruvate dehydrogenase kinase 4 (PDK4) and carnitine palmitoyl transferase, and decreased those related to glycolysis (e.g., pyruvate dehydrogenase phosphatase).5) Importantly, a previous study reported that CD-1 mice decreased body mass and increased lipid mobilization and proteolysis when they were treated with T1AM (10 mg kg−1 d−1) for 8 d.18) This study, however, did not evaluate the mechanism associated with the regulation of catabolic and anabolic signaling activities in the skeletal muscle.
Because the metabolic reduction of muscle cells can be induced by T1AM,5) in vitro studies with this compound may provide an ideal model for testing our hypothesis that metabolic suppression alone can induce muscle atrophy in the absence of physical influence. The findings of this study can shed light on a novel pharmaceutical application of hypometabolic agents for muscle homeostasis that has been overlooked to date.
MATERIALS AND METHODS
ChemicalsT1AM was synthesized in our chemistry laboratory,19) dissolved in dimethyl sulfoxide (DMSO; Sigma-Aldrich, St. Louis, MO, U.S.A.) and stored at stock concentrations of 0.75 and 1 M. Dulbecco’s modified Eagle’s medium (DMEM) was purchased from Welgene (Dalseogu, Daegu, Korea). Nonidet P-40, Complete Mini protease inhibitor and a phosphatase inhibitor cocktail were purchased from Roche (Mannheim, Germany). For protein extraction, RIPA buffer was prepared with 1% Nonidet P-40, 10 mM sodium phosphate [pH 7.4], 1% sodium deoxycholate, 2 mM ethylenediaminetetraacetic acid (EDTA), 150 mM NaCl, 50 mM NaF, 40 mM 4-(2-hydroxyethyl)-1-piperazineethanesulfonic acid (HEPES) [pH 7.4], 0.2 mM Na3VO4, 1% sodium dodecyl sulfate (SDS), 0.7% CHAPS and protease inhibitor cocktail. Restore™ Western blot Stripping Buffer was purchased from Thermo Scientific (Rockford, IL, U.S.A.), and the ECL system from GE Healthcare (Fairfield, CT, U.S.A.). Rabbit anti-phospho-AMPK (at Thr172), AMPK, phospho-Akt1 (Ser473) and Akt1 polyclonal antibodies, phospho-mTOR (Ser2448) and mTOR antibodies, phospho-S6K (Thr389) and S6K antibodies, αB-crystallin, phospho-FoxO1 (Ser256), phospho-FoxO3 (Ser253), FoxO1, FoxO3, horseradish peroxidase (HRP)-conjugated anti-mouse immunoglobulin G (IgG) and anti-rabbit IgG were purchased from Cell Signaling Technology (Beverly, CA, U.S.A.); a rabbit anti-MuRF1 and MAFbx/atrogen1 polyclonal antibody from Santa Cruz Biotechnology (Santa Cruz, CA, U.S.A.); mouse anti-HSP72 from Stressgen (Victoria, BC, Canada); mouse anti-glyceraldehydes-3-phosphate dehydrogenase (GAPDH) antibody from Abcam (Cambridge, U.K.).
Cell CultureC2C12 myoblasts were obtained from the American Type Culture Collection (Rockville, MD, U.S.A.). The cells were cultured in DMEM including 4500 mg/L glucose supplemented with 10% fetal bovine serum (Hyclone, Logan, UT, U.S.A.) and 1% antibiotic-antimycotic (Gibco, Burlington, Ontario, Canada). The cells were incubated at 37°C under 5% CO2. The cells were grown in 6-well culture plates for immunoblot analysis and myotube diameter measurements. When the myoblasts reached 80% confluence in each well, the cells were differentiated into myotubes with differentiation medium (containing 2% horse serum and 1% antibiotic-antimycotic). The medium was changed every two days.
Oxygen Consumption RateTo confirm the hypometabolic effect of T1AM observed in our previous study,5) the time course changes in the OCR were measured for myotubes treated for 6 h with 75 µM T1AM and vehicle (DMSO), respectively. The C2C12 myoblasts were seeded at a density of 2.0×10⁴ cells per well in 24-well XF microplates (SeaHorse Bioscience, Billerica, MA, U.S.A.). On 5 d after differentiation, the cells were incubated for 1 h in XF Assay Media (SeaHorse Bioscience) in a 37°C, non-CO2 incubator. T1AM was dissolved in DMSO at final concentrations of 0 and 75 µM5) and was loaded on the injection ports of the sensor cartridge (SeaHorse Bioscience). Oxygen consumption rate (OCR) of the myotubes was monitored by a SeaHorse XF24 Analyzer operated in a series of 2-min reading, 3-min mixing and 2-min waiting. This cycle was repeated for 6 h.
Cell SizeTo determine the effects of T1AM on C2C12 myotube size, the myotubes after 5 d of differentiation were treated for 6 h with 75 µM of T1AM or DMSO vehicle control as done in our prior study.5) In addition, to examine whether the myotube size was restored with removal of T1AM right after the 6-h treatment, the cells were incubated for 3, 6, and 9 h in the media containing no T1AM. Myotubes of the five groups, namely, Con, T1AM, R3h (3 h after “removal” of T1AM), R6h and R9h, were photographed at 200× magnification under Nikon Eclipse T5100 light microscope. The fields were divided into 9 compartments to provide random selection of cells for the analysis. The diameter of each myotube was analyzed using the Image J software (NIH, Frederick, MD, U.S.A.).
Immunoblotting AnalysisOn 5 d after differentiation of C2C12 cells, the myotubes were treated for 6 h with 75 µM of T1AM or 0.1% DMSO as a control. The cells were lysed in RIPA buffer5) and then incubated on ice for 5 min. After centrifugation for 10 min at 13000 rpm and 4°C, supernatants were collected as whole-cell soluble lysates, and protein concentrations were determined by the Bradford assay (Bio-Rad, Hercules, CA, U.S.A.).
Primary antibodies used in this study were rabbit anti-phospho-AMPK (Thr172), anti-AMPK, anti-phosphor(p)-FoxO1 (Ser256), anti-FoxO1, anti-phospho(p)-FoxO3 (Ser253), anti-FoxO3, anti-αB-crystallin, anti-phosphor(p)-S6K (Thr389), anti-mTOR, anti-phospho(p)-mTOR (Ser2448), anti-S6K, anti-phospho(p)-Akt1 (Ser473), and anti-Akt1 polyclonal antibodies (Cell Signaling Technology); rabbit anti-MuRF1, and MAFbx/atrogen1 polyclonal antibody (Santa Cruz Biotechnology); mouse anti-HSP72 monoclonal antibody (Stressgen, Victoria, BC, Canada); and mouse anti-GAPDH antibodies (Abcam). The secondary antibodies were HRP-conjugated anti-mouse and anti-rabbit IgG (Cell Signaling Technology). A total of 30 µg of protein was resolved by SDS-polyacrylamide gel electrophoresis (PAGE), and then transferred onto nitrocellulose membranes. The membranes were blocked in 5% nonfat dry milk solution (1×TBS, 0.5% Tween-20, 5% (w/v) nonfat dry milk) at room temperature for 1 h and then incubated at 4°C overnight with the respective primary antibodies at indicated dilutions in TBS-T (1 : 500–1 : 10000). After washing in TBS-T, the membranes were incubated with an appropriate HRP-conjugated secondary antibody (1 : 1000–1 : 20000) at room temperature for 1 h and then washed three times with TBS-T. Immune complexes were detected with an ECL system (GE Healthcare), and the band density was quantified using the Image J 1.47t software (NIH). Protein band densities were normalized to those of GAPDH.
Indirect Immunofluorescence Staining and Confocal MicroscopyTo visualize localization of unphosphorylated FoxO proteins in the muscle cells, the C2C12 myoblasts were seeded on coverslips in 6-well plate and differentiated for 5 d. The myotubes were treated for 6 h with 75 µM of T1AM or 0.1% DMSO as the control. The cells were washed three times with 1×phosphate buffered saline (PBS) and fixed in 4% paraformaldehyde in 1×PBS for 30 min at room temperature. The cells were then permeabilized with 0.2% Triton X-100 for 15 min on ice and blocked with 3% BSA in 1×PBS and were incubated with 1 : 100 diluted primary antibodies to FoxO1 and FoxO3, respectively, and then reacted with 1 : 1000 diluted Alexa 488-conjugated rabbit secondary antibody (Cell Signaling Technology). After washing three times with 1×PBS, coverslips were mounted with Vectashield mounting media containing 4′,6-diamidino-2-phenylindole (DAPI) (Vector Laboratories, Burlingame, CA, U.S.A.). The fluorescent images were analyzed with a Carl Zeiss CLSM780 confocal microscope (Jena, Germany) and were used to quantify FoxO proteins in the nuclei of the control and treated cells.
26S Proteasome Activity AssayTo assess catabolic potency of T1AM, the proteasome activity of the control and the treated cells was examined. The myotubes on 5 d of differentiation were treated for 6 h with 75 µM of T1AM or 0.1% DMSO as a control. The myotubes were detached with trypsin solution followed by washing with fresh differentiation medium. Approximately 7500 cells, counted with a Bio-Rad cell counter in 50 µL of differentiation medium, were used for the chymotrypsin-like activity assay using the Promega Proteasome-Glo™ cell-based luminescent assay kit (Promega, Madison, WI, U.S.A.). To confirm the specificity of the assay, the same numbers of cells were pretreated for 0.5 h with 10 µM epoxomicin, a proteasome inhibitor, and were assayed for chymotrypsin-like activity by the same procedure. The outcome was used as the background signal for this assay. The actual chymotrypsin-like activity was determined by subtracting the background RLUs from the total RLUs in each assay. A GloMax 20/20 Luminometer (Promega) was used to determine luminescence levels.
Statistical AnalysisDifferences in the means of cell diameters among the five groups (Con, T1AM, R3h, R6h and R9h) were examined using one-way ANOVA and Student–Newman–Keuls (SNK) post-hoc multiple comparison tests. Significance of the differences between Con and T1AM for the remaining parameters was determined with independent t-tests between the control and the T1AM-treated groups. All statistical procedures were conducted with SPSS/PC+.
RESULTS
The Atrophic Effect of T1AM-Mediated HypometabolismTo determine the hypometabolic potency of T1AM in the myotubes, the time course changes in the OCR were compared between the cells treated for 6 h with 75 µM T1AM and those with vehicle (DMSO) (Fig. 1A). The OCR remained within 90% of the initial value in the control group, whereas it decreased to ca. 60% in the T1AM-treated group.
To examine the atrophic effect of T1AM on myotube size and the reversible effect by its removal, the myotubes from the five groups were photographed under Nikon Eclipse T5100 light microscope (Fig. 1B). Individual cell diameters were measured at 200×magnification and were presented in Fig. 1C. The diameter decreased by a factor of 0.15 in the T1AM-treated cells compared to the control (15.56±0.36 µm). The diameter of cells increased progressively after T1AM was removed and reached to 15.60±0.40 µm at 9 h that was statistically indifferent from that of the control (one-way ANOVA; n=96 per group, p<0.05).
Downregulation of Anabolic Signaling in the T1AM-Treated CellsTo examine the anabolic effect of T1AM treatment on the myotubes, immunoblotting analysis was performed for the Akt1–mTOR–S6K pathway and HSPs expression. The p-Akt1, p-mTOR and p-S6K levels were significantly downregulated in the treated group, whereas their unphosphorylated protein levels were similar between the two groups (Fig. 2A). The ratio of p-Akt1/Akt1, p-mTOR/mTOR and p-S6K/S6K decreased 44–56% in the treated myotubes (n=6 per group, p<0.05) (Figs. 2B–D). To investigate the effect of T1AM treatment on HSP72 and αB-crystallin protein levels, immunoblot analysis was done. T1AM treatment reduced the HSP72 and αB-crystallin protein level by a factor of 0.26 and 0.47, respectively, compared to the control (n=6, p<0.05) (Figs. 2A, E, F). In contrast, the protein level of HSP60 was not affected by T1AM treatment (data not shown).
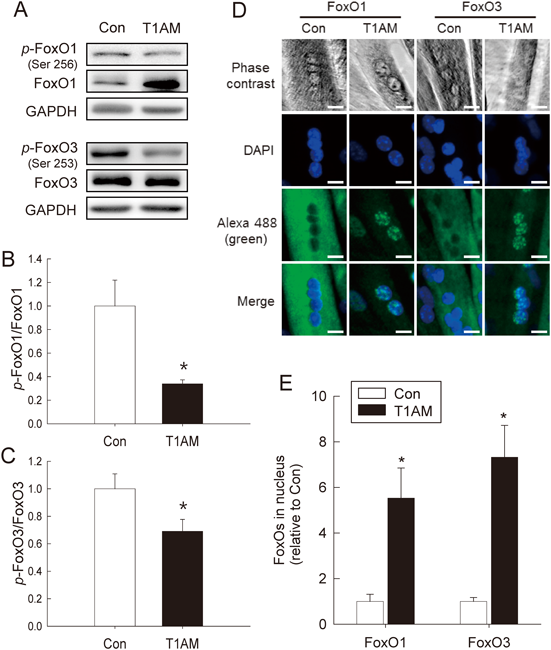
Upregulation of Catabolic Signaling in the T1AM-Treated CellsTo investigate the catabolic effect of T1AM on the myotubes, the activity of the FoxO-to-proteasome signaling pathway was assessed. The total FoxO1 expression increased 2.0-fold in the treated cells while p-FoxO1 (Ser256) was similar between the groups (Fig. 3A). The ratio of p-FoxO1/FoxO1 decreased 65% in the T1AM group (n=6, p<0.05) (Fig. 3B). Total FoxO3 levels did not differ between the groups, but p-FoxO3 decreased 42% in the T1AM group (n=6, p<0.05) (Fig. 3A). This resulted in a 39% decrease in the p-FoxO3/FoxO3 ratio in the T1AM group (p<0.05) (Fig. 3C). We further set out to explore the effect of T1AM on the subcellular localization of the FoxO protein in the myotubes. The number of the nuclear FoxO1 and FoxO3 was analyzed after indirect immunofluorescence staining of myotubes with anti-FoxO1 and anti-FoxO3 antibodies, respectively followed by confocal imaging analysis (Fig. 3D). We found 5.5-fold increases in the nuclear accumulation of unphosphorylated FoxO1 and 7.3-fold increase of unphosphorylated FoxO3 in the treated groups compared to their control groups (n=4 per group for each FoxO, with two independent experiments; p<0.05).
Next, we assessed the effect of T1AM on the protein level of MuRF1 and MAFbx by immunoblot analysis. The MuRF1 protein increased 1.8-fold in the treated cells versus the control (p<0.05), whereas that of MAFbx protein was not affected by the treatment (Figs. 4A, B). Next, we further assessed the chymotrypsin-like activity which is one of the major catabolic characteristics of the proteasome and observed 1.5-fold increase by the T1AM treatment (p<0.05) (Fig. 4C).
DISCUSSION
Skeletal muscle mass correlates with both physical and metabolic loads.1,6) Whereas physical stress entails metabolic support for muscle work, metabolic activity is not necessarily tied to physical activity. It is thus important to distinguish the role of the former from that of the latter to extend our understanding of the mechanisms of muscle homeostasis.6) In the present study, we addressed whether metabolic suppression induces muscle cell atrophy in the absence of physical stress.
Our data show that T1AM treatment decreased the OCR of the cells by ca. 30% relative to the control (Fig. 1A). The time–course change in the OCR is similar to that of our previous study,5) confirming reproducibility of the hypometabolic potency of T1AM in the muscle cell. The concentration of T1AM (75 µM) used in our current and prior studies was about half that used in the mouse studies (ca. 141 µmol kg−1 body mass).14) The reports also showed that both the cell and mouse models required at least 10–25 µM T1AM to elicit hypometabolic response.5,14) These results were contrasted with the very low endogenous concentration detected in the skeletal muscle (ca. 25 nM) and the liver (93 nM) of a mouse model.20) Such observation of the low T1AM concentration evidences that spontaneous hypometabolism is improbable in the non-hibernator mouse. The receptors (e.g., TAAR1) might exist sufficiently in the target cell membrane because the exogenous T1AM could suppress the metabolic rate soon after treatment (within ca. 5 min).5,14) These interpretations should be investigated in the future. Taken together, it was inevitable to use a high dosage of T1AM to answer our original question on the muscle-atrophic potency of the metabolic suppression.
Our results also revealed that the diameter of the treated cells decreased 15% compared to the control (Figs. 1B, C). In addition, the diameter was recovered by the time of 9 h after removal of T1AM in the media. This result suggests gradual fading of the T1AM impact on the cell size. To the best of our knowledge, this is the first report showing a direct effect of metabolic suppression on muscle atrophy in vitro. Based on these observations, our next work was to delineate differences in anabolic versus catabolic signaling activities associated with muscle homeostasis under the T1AM influence.
Specifically, the atrophy of T1AM-treated myotubes was accompanied by a 34–56% decrease in anabolic signals (Akt1–mTOR–S6K and HSPs; Fig. 2), a 39–65% decrease in p-FoxOs/FoxOs (Fig. 3), and a 1.5- to 1.8-fold increase in catabolic signals (MuRF1 and proteasome; Fig. 4). These results provide evidence that the muscle cell atrophy by T1AM treatment proceeded in accord with the catabolic over anabolic signals. Our recent study showed that T1AM treatment increased AMPK phosphorylation concurrently with the [AMP]/[ATP] ratio, implying a sufficient reduction of cellular energy charge in the hypometabolic state.5) Previous reports demonstrate there are cross-talks among Akt1, AMPK and mTOR for regulating energy balance and/or autophagy.9,21,22) For instance, AMPK phosphorylation is downregulated by Akt1 activation,21) while it inhibits activation of mTOR, a downstream signal of Akt1.9) The existence of the cross-talks suggests that the low energy state by T1AM treatment exerts muscle size regulation via the signaling network of Akt1-mTOR with AMPK.
Our data also suggest that downregulation of Akt1 phosphorylation is linked to the increased nuclear accumulation of both FoxO1 and FoxO3 (Fig. 3E), as the upregulation of the catabolic signaling is known to be antagonistically regulated by Akt signaling.23,24) The MAFbx protein seemed not to follow the catabolic trend (Fig. 4B), probably because an optimal response of this protein might occur at a different exposure time25) or via different upstream signals from those of MuRF1 (e.g., p38 or inhibitor of kappaB (IκB) kinase).12)
Interestingly, there was differential expression of FoxO1 versus FoxO3 upon T1AM treatment (Fig. 3A) which might mirror their different roles in lipid and protein metabolism. Previous reports on skeletal muscle showed that FoxO1 activation inhibits glycolytic flux by upregulating PDK4 and promotes lipid mobilization by upregulating lipoprotein lipase and adiponectin receptor.11,26,27) Conversely, the expression and transcriptional activity of FoxO3 are directly regulated by AMPK, which is activated by metabolic stress (e.g., low [ATP]).28) Because muscle disuse cuts down the mitochondrial metabolic activity along with AMPK activation,29) the AMPK-FoxO3 axis can be one of the major signaling routes promoting expression of atrophy genes, including the ubiquitin E3 ligase and proteasome.11)
It is also worth comparing the regulatory mechanism of dexamethasone (DEX) with that of T1AM. As a synthetic glucocorticoid, DEX is well known to induce muscle atrophy.30) Liu et al.31) demonstrated that DEX treatment significantly reduced the OCR in skeletal muscle cells and mice as well as the muscle weight-to-body weight ratio of mice. The decrease in the OCR was due to ATP deprivation by mitochondrial dysfunction in the electron transport system, biogenesis and dynamics. Such dysfunction, in turn, activated AMPK–FoxO3 signaling and induced the mRNA expression of MAFbx and MuRF1.31) Therefore, Liu’s results strengthen our data of T1AM-mediated hypometabolism and its atrophic consequence.
The significant reduction of HSP72 and αB-crystallin expression in the treated cells (Figs. 2E, F) can also be explained along with the same lines as the AMPK/Akt1 relationship. Other than their roles as molecular chaperones, the HSPs promote pro-anabolic (i.e., activation of Akt1) and anti-catabolic (suppression of FoxO-E3 ligase-proteasome activity) functions, subsequently inhibiting muscle cell atrophy.13) The decrease in HSP levels seen in this study was therefore in agreement with the myotube atrophy, the increased catabolic signals (as well as AMPK activation of our previous study5)), and the decreased anabolic signals (i.e., p-Akt1) under the hypometabolic state by T1AM treatment.
In summary, T1AM treatment resulted in significant reduction of the OCR and the myotube diameter, and modulated the anabolic (Akt1–mTOR–S6K) and catabolic (FoxO–MuRF1–proteasome) signals. From the pharmaceutical perspectives, the hypometabolic agent like T1AM may be utilized as an inducer of muscle atrophy (e.g., an alternative of DEX) and/or an inhibitor of muscle hypertrophy (e.g., myostatin-related muscle hypertrophy).32)
Acknowledgments
We are grateful to Ms. Chaeyeon Son, Mr. Haksup Shin and Mr. Kyoungbong Ha for cell culture and maintenance. This research was supported by Basic Science Research Program through the National Research Foundation of Korea (NRF) funded by the Ministry of Education (2014R1A1A2056794).
Conflict of Interest
The authors declare no conflict of interest.
REFERENCES
- 1) Fitts RH, Riley DR, Widrick JJ. Functional and structural adaptations of skeletal muscle to microgravity. J. Exp. Biol., 204, 3201–3208 (2001).
- 2) Du J, Wang X, Miereles C, Bailey JL, Debigare R, Zheng B, Price SR, Mitch WE. Activation of caspase-3 is an initial step triggering accelerated muscle proteolysis in catabolic conditions. J. Clin. Invest., 113, 115–123 (2004).
- 3) Zurlo F, Larson K, Bogardus C, Ravussin E. Skeletal muscle metabolism is a major determinant of resting energy expenditure. J. Clin. Invest., 86, 1423–1427 (1990).
- 4) Wijers SL, Saris WH, van Marken Lichtenbelt WD. Recent advances in adaptive thermogenesis: potential implications for the treatment of obesity. Obes. Rev., 10, 218–226 (2009).
- 5) Ju H, Shin H, Son C, Park K, Choi I. 3-Iodothyronamine-mediated metabolic suppression increases the phosphorylation of AMPK and induces fuel choice toward lipid mobilization. Horm. Metab. Res., 47, 605–610 (2015).
- 6) Koopman R, Ly CH, Ryall JG. A metabolic link to skeletal muscle wasting and regeneration. Front Physiol, 5, 32 (2014).
- 7) Lomonosova YN, Shenkman BS, Nemirovskaya TL. Attenuation of unloading-induced rat soleus atrophy with the heat-shock protein inducer 17-(allylamino)-17-demethoxygeldanamycin. FASEB J., 26, 4295–4301 (2012).
- 8) Vernikos J, Schneider VS. Space, gravity and the physiology of aging: parallel or convergent disciplines? A mini-review. Gerontology, 56, 157–166 (2010).
- 9) Shackelford DB, Shaw RJ. The LKB1-AMPK pathway: metabolism and growth control in tumour suppression. Nat. Rev. Cancer, 9, 563–575 (2009).
- 10) Sandri M, Sandri C, Gilbert A, Skurk C, Calabria E, Picard A, Walsh K, Schiaffino S, Lecker SH, Goldberg AL. Foxo transcription factors induce the atrophy-related ubiquitin ligase atrogin-1 and cause skeletal muscle atrophy. Cell, 117, 399–412 (2004).
- 11) Sanchez AM, Candau RB, Bernardi H. FoxO transcription factors: their roles in the maintenance of skeletal muscle homeostasis. Cell. Mol. Life Sci., 71, 1657–1671 (2014).
- 12) Senf SM, Dodd SL, McClung JM, Judge AR. Hsp70 overexpression inhibits NF-κB and Foxo3a transcriptional activities and prevents skeletal muscle atrophy. FASEB J., 22, 3836–3845 (2008).
- 13) Gwag T, Park K, Kim E, Son C, Park J, Nikawa T, Choi I. Inhibition of C2C12 myotube atrophy by a novel HSP70 inducer, celastrol, via activation of Akt1 and ERK1/2 pathways. Arch. Biochem. Biophys., 537, 21–30 (2013).
- 14) Scanlan TS, Suchland KL, Hart ME, Chiellini G, Huang Y, Kruzich PJ, Frascarelli S, Crossley DA, Bunzow JR, Ronca-Testoni S, Lin ET, Hatton D, Zucchi R, Grandy DK. 3-Iodothyronamine is an endogenous and rapid-acting derivative of thyroid hormone. Nat. Med., 10, 638–642 (2004).
- 15) Blackstone E, Morrison M, Roth MB. H2S induces a suspended animation-like state in mice. Science, 308, 518 (2005).
- 16) Mullur R, Liu YY, Brent GA. Thyroid hormone regulation of metabolism. Physiol. Rev., 94, 355–382 (2014).
- 17) Ju H, So H, Ha K, Park K, Lee JW, Chung CM, Choi I. Sustained torpidity following multi-dose administration of 3-iodothyronamine in mice. J. Cell. Physiol., 226, 853–858 (2011).
- 18) Haviland JA, Reiland H, Butz DE, Tonelli M, Porter WP, Zucchi R, Scanlan TS, Chiellini G, Assadi-Porter FM. NMR-based metabolomics and breath studies show lipid and protein catabolism during low dose chronic T1AM treatment. Obesity, 21, 2538–2544 (2013).
- 19) Kim J-G, Song Y-K, Jo Y-H, Yu M-R, Ju H, Choi I, Chung C-M. A New Efficient Synthetic Method for 3-Iodothyronamine Involving Sonication and its Potent Hypothermic Efficacy. Bull. Korean Chem. Soc., 32, 1131–1132 (2011).
- 20) Saba A, Chiellini G, Frascarelli S, Marchini M, Ghelardoni S, Raffaelli A, Tonacchera M, Vitti P, Scanlan TS, Zucchi R. Tissue distribution and cardiac metabolism of 3-iodothyronamine. Endocrinology, 151, 5063–5073 (2010).
- 21) Kovacic S, Soltys CL, Barr AJ, Shiojima I, Walsh K, Dyck JR. Akt activity negatively regulates phosphorylation of AMP-activated protein kinase in the heart. J. Biol. Chem., 278, 39422–39427 (2003).
- 22) Inoki K, Kim J, Guan KL. AMPK and mTOR in cellular energy homeostasis and drug targets. Annu. Rev. Pharmacol. Toxicol., 52, 381–400 (2012).
- 23) Senf SM, Dodd SL, Judge AR. FOXO signaling is required for disuse muscle atrophy and is directly regulated by Hsp70. Am. J. Physiol. Cell Physiol., 298, C38–C45 (2010).
- 24) Gvoždík L. Plasticity of preferred body temperature as means of coping with climate change? Biol. Lett., 8, 262–265 (2012).
- 25) Krawiec BJ, Nystrom GJ, Frost RA, Jefferson LS, Lang CH. AMP-activated protein kinase agonists increase mRNA content of the muscle-specific ubiquitin ligases MAFbx and MuRF1 in C2C12 cells. Am. J. Physiol. Endocrinol. Metab., 292, E1555–E1567 (2007).
- 26) Furuyama T, Kitayama K, Yamashita H, Mori N. Forkhead transcription factor FOXO1 (FKHR)-dependent induction of PDK4 gene expression in skeletal muscle during energy deprivation. Biochem. J., 375, 365–371 (2003).
- 27) Bastie CC, Nahle Z, McLoughlin T, Esser K, Zhang W, Unterman T, Abumrad NA. FoxO1 stimulates fatty acid uptake and oxidation in muscle cells through CD36-dependent and -independent mechanisms. J. Biol. Chem., 280, 14222–14229 (2005).
- 28) Peserico A, Chiacchiera F, Grossi V, Matrone A, Latorre D, Simonatto M, Fusella A, Ryall JG, Finley LW, Haigis MC, Villani G, Puri PL, Sartorelli V, Simone C. A novel AMPK-dependent FoxO3A-SIRT3 intramitochondrial complex sensing glucose levels. Cell. Mol. Life Sci., 70, 2015–2029 (2013).
- 29) Powers SK, Wiggs MP, Duarte JA, Zergeroglu AM, Demirel HA. Mitochondrial signaling contributes to disuse muscle atrophy. Am. J. Physiol. Endocrinol. Metab., 303, E31–E39 (2012).
- 30) Long W, Wei L, Barrett EJ. Dexamethasone inhibits the stimulation of muscle protein synthesis and PHAS-I and p70 S6-kinase phosphorylation. Am. J. Physiol. Endocrinol. Metab., 280, E570–E575 (2001).
- 31) Liu J, Peng Y, Wang X, Fan Y, Qin C, Shi L, Tang Y, Cao K, Li H, Long J, Liu J. Mitochondrial Dysfunction Launches Dexamethasone-Induced Skeletal Muscle Atrophy via AMPK/FOXO3 Signaling. Mol. Pharm., 13, 73–84 (2016).
- 32) Mosher DS, Quignon P, Bustamante CD, Sutter NB, Mellersh CS, Parker HG, Ostrander EA. A mutation in the myostatin gene increases muscle mass and enhances racing performance in heterozygote dogs. PLoS Genet., 3, e79 (2007).