Abstract
Intravenous immunoglobulin (IVIg) has been shown to be effective in the treatment of a variety of autoimmune diseases. To clarify the role of T regulatory cells (Tregs) in the immunoregulatory effect of IVIg, we focused on human inducible T regulatory cells (iTregs) and investigated the mechanism of action of IVIg. When immunoglobulin G (IgG) was added to a culture system that differentiates iTregs from anti-CD3 antibody activated CD4+CD25− T cells in the presence of syngeneic immature dendritic cells, interleukin (IL)-2 and transforming growth factor-β (TGF-β), the expression of forkhead box P3 (FoxP3), which is the master transcription factor for Tregs in CD4+CD25+ T cells, increased in an IgG concentration-dependent manner. The expression of FoxP3 in iTregs in the 20 mg/mL IgG group was twice as high as that in the saline group. iTregs that highly expressed FoxP3 not only partially suppressed the polyclonal proliferative response of T cells derived from the same individual but also produced significantly more inhibitory cytokines IL-10 and TGF-β. The ability of IgG to enhance iTregs differentiation was also observed in the Fc fragment, but not in the F(ab′)2 fragment. These results suggest the clinical regulation of immune responses by IVIg administration may contribute at least to enhancing the differentiation of iTregs and partial immunosuppressive functions.
Intravenous immunoglobulin (IVIg) is a polyclonal immunoglobulin G (IgG) fraction purified from pooled human plasma from more than 10000 healthy adults, and this therapy has been reported to be effective in the treatment of several autoimmune diseases.1) It is known that IgG possesses antibody feedback regulation, and when antibodies against certain antigens are produced in vivo, immunity is controlled mainly by the antibody production response.2) There are various reports on the mechanism of action of IVIg’s ability to exert a therapeutic effect on autoimmune diseases.3,4) Since T regulatory cells (Tregs) were discovered by Sakaguchi and colleagues, it has been revealed that Tregs are deeply involved in the regulation of immune responses, particularly maintenance of immunological tolerance.5) It is clear that there are two sub-populations of Tregs, naturally occurring Tregs (nTregs), which occur in the thymus and are excreted to the periphery, and inducible T regulatory cells (iTregs) generated from naive T cells in the periphery.6) There are several reports on the relationship between Tregs and the immunoregulatory effect of IVIg used for the treatment of autoimmune diseases.7–11) However, since nTregs and iTregs coexist in vivo and both cell surface markers and the expression of the master transcription factor forkhead box P3 (FoxP3) are common, it is difficult to explicitly distinguish the influence of IVIg on both. nTregs in the human peripheral blood can be as low as approximately 5–10% of the total CD4+ T cells.12) On the other hand, it has been reported that iTregs can be differentiated in vitro by activating progenitor cells CD4+CD25+Foxp3− cells with anti-CD3 antibody and culturing with the addition of interleukin (IL)-2 and transforming growth factor-β (TGF-β).13)
Using this experimental system, we attempted to clarify whether iTregs are involved in the immunomodulatory action of IVIg by investigating how IgG, which is a material of IVIg, exerts influence on the differentiation and function of iTregs. Our results showed that IgG enhanced iTregs differentiation from progenitor cells in a concentration-dependent manner, suppressing the proliferative response of T cells derived from the same individual depending on the expression of FoxP3. We also showed that iTregs differentiated in the presence of IgG produced IL-10 and TGF-β significantly more than the saline group. Analysis of the transcription factor STAT (signal transducer and activators of transcription), which plays a critical role in the development and function of T cells and is involved in subsequent cytokine signal, elucidated that the expression of phosphorylated STAT5 was enhanced in the IgG group.
Furthermore, it became clear that the Fc region of IgG plays a major role in iTregs differentiation enhancement action.
Based on the above results, we demonstrated IVIg has an enhancing effect not only on nTregs, which has already been reported, but also on the peripherally iTregs.
MATERIALS AND METHODS
Study MaterialEthylenediaminetetraacetic acid-treated peripheral blood was collected from healthy volunteers at The Chemo-Sero-Therapeutic Research Institute (Kumamoto, Japan). This research was approved by the Ethics Committee of The Chemo-Sero-Therapeutic Research Institute, and written informed consent was obtained from all volunteers.
Human IgG was dispensed from IVIg preparations refined by cold ethanol (Cohn) fractionation from blood plasma samples donated by more than 10000 Japanese people. Pepsin-treated immunoglobulin preparation was used to obtain F(ab′)2 fragments. After dialyzing the IgG and F(ab′)2 fragments against physiological saline, they were concentrated to 50 mg/mL at 4°C. Aliquots were stored at −80°C until needed. Fc fragments were prepared by papain cleavage of human IgG. The Fab portion was removed from the resulting mixture using a Protein G Sepharose 4 Fast Flow column (GE Healthcare Bioscience, Chicago, IL, U.S.A.). Fractions containing the Fc fragment and undigested IgG were then loaded on to a Hiload 26/60 Superdex-200 pg gel-filtration column (GE Healthcare Bioscience). Fractions containing the purified Fc were pooled and concentrated to 50 mg/mL at 4°C by centrifugation through an Amicon Ultra 10 kDa molecular mass cut-off membrane (Merck Millipore, Billerica, MA, U.S.A.) equilibrated with physiological saline and stored at −80°C until needed. Endotoxins were not detected (<0.05 endotoxin units/mL per 50 mg/mL) in each IgG.
Cytokines and AntibodiesRecombinant human IL-4 and granulocyte–macrophage colony-stimulating factor (GM-CSF) were purchased from Biosource (Camarillo, CA, U.S.A.). Recombinant human IL-2 and TGF-β were obtained from R&D Systems (Minneapolis, MN, U.S.A.). Anti-CD3 and CD28 monoclonal antibodies (mAbs) were purchased from BD Biosciences (San Diego, CA, U.S.A.).
Cell PurificationMonocyte fraction was separated from peripheral blood mononuclear cells (PBMCs). PBMCs were prepared over Lymphocyte Separation Media (MP Biomedicals, Santa Ana, CA, U.S.A.) from the anticoagulated blood. T cells, B cells, natural killer cells, and granulocytes were removed from PBMCs using EasySep Human Monocyte Enrichment Kit without CD16 Depletion (StemCell Technologies, Inc., Vancouver, Canada).
CD4+ T cells were isolated by negative selection using the CD4 isolation kit for magnetic separation (Miltenyi Biotec, Bergisch Gladbach, Germany) according to the manufacture’s instructions. CD4+ T cells were incubated with mouse anti-human CD25 MicroBeads and separated into CD4+CD25+ and CD4+CD25− T cells on a positive selection column (Miltenyi Biotec). We confirmed that CD4+CD25+ T cells in CD4+CD25− T cells were less than 2%.
Differentiation of Monocyte-Derived Immature Dendritic CellsThe monocytes fraction was suspended at a density of 4–5×10⁵ cells/well in Hank’s balanced salt solution (Sigma, St. Louis, MO, U.S.A.) containing 5% heat-inactivated human AB serum. Monocyte fraction was incubated for 1 h in a 24-well culture plate at 37°C. The remaining cells were washed with phosphate-buffered saline (PBS) after aspiration removed non-adherent cells. More than 85% of the monocytes obtained in this manner were CD14-positive. We induced immature dendritic cells (imDCs) differentiation using the method as described.14) Briefly, monocytes were cultured in 1600 units/mL GM-CSF and 200 units/mL IL-4 in RPMI-1640 medium containing 3% heat-inactivated human AB serum (Gemini Bio Products, Broderick, CA, U.S.A.), 2 mM L-glutamine, 0.05 mM 2-mercaptoethanol, 100 mg/mL streptomycin, and 100 units/mL penicillin at 37°C for 7 d under humidity and 5% CO2 to differentiate the cells into imDCs. Throughout the 7 d, 30% of the medium was replaced with new medium every 2 d.
Co-culture of CD4+CD25− T Cells with ImDCsCD4+CD25− T cells (1×10⁶) were stimulated with soluble anti-CD3 mAbs (1 µg/mL) and syngeneic imDCs (2×10⁵). Then, TGF-β (2 ng/mL) and IL-2 (200 units/mL) was added and cultured at 37°C for 5 d in the presence of saline, 4 mg/mL IgG, or 20 mg/mL IgG in a 48-well culture plate under humidity and 5% CO2. The culture medium consisted of RPMI-1640 medium containing 3% heat-inactivated human AB serum, 2 mM L-glutamine, 0.05 mM 2-mercaptoethanol, 100 mg/mL streptomycin and 100 units/mL penicillin. The cells were harvested on day 5, and the percentage of CD25+FoxP3+ cells was determined by flow cytometry (FACscan, CellQuest software; BD Biosciences) using anti-CD4, anti-CD25, and anti-FoxP3 mAbs. Fluorescein isothiocyanate (FITC)-conjugated anti-FoxP3 mAbs were purchased from eBioscience (Bayport, U.S.A.). Phycoerythrin (PE)-conjugated anti-CD4 mAbs and phycoerythrin-cyanine 5 (PC5)-conjugated anti-CD25 mAbs were obtained from BD Biosciences.
Differentiation from CD4+CD25− T Cells to iTregs without imDCsCD4+CD25− T cells (1×10⁶) were stimulated with soluble anti-CD28 mAbs (2 µg/mL). TGF-β (2 ng/mL) and IL-2 (200 units/mL) were added and cultured for 5 d in the presence of saline, 4 mg/mL IgG, or 20 mg/mL IgG in a 48-well culture plate. The culture plate was coated overnight at 4°C with 1 µg/mL anti-CD3 mAbs. The culture medium, the conditions for culturing, and flow cytometric analysis are as described above.
Flow Cytometry of Cell Surface MoleculesCells collected on day 5 were suspended for 15 min at 4°C in PBS containing 1% bovine serum albumin, 2% normal rabbit serum, and 0.05% sodium azide (staining buffer). Cells were then stained with fluorescein-conjugated or isotype control antibodies for 30 min at 4°C. After washing and resuspending the cells in staining buffer, greater than 5000 cells from each sample were analyzed using flow cytometry (FACscan, CellQuest software; BD Biosciences). FITC-conjugated anti-CD127 mAbs and PE-conjugated anti-GITR (glucocorticoid-induced tumor necrosis factor-related receptor) mAbs were purchased from eBioscience. PC5-conjugated anti-CTLA-4 (cytotoxic T-lymphocyte-associated protein 4) mAbs were obtained from BD Biosciences.
Flow Cytometry of Intracellular CytokinesIntracellular cytokines were assessed using Cytofix/Cytoperm kits according to the manufacturer’s instructions (BD Biosciences). Briefly, the iTregs were resuspended in RPMI-1640 containing 3% human AB serum on day 5. After the addition of 1 mL/mL Golgi Stop (BD Biosciences) to prevent cytokine secretion, the cells were incubated for 12 h and were then treated with Cytofix/Cytoperm kits according to the manufacturer’s instructions (BD Biosciences). Intracellular cytokines were assessed by flow cytometry (FACscan, CellQuest software; BD Biosciences) using anti-cytokine mAbs conjugated with a fluorochrome. PE-conjugated anti-IFN-γ (Interferon gamma) mAbs and TGF-β mAbs were purchased from BD Biosciences. PE-conjugated anti-IL-10 mAbs were obtained from IQ Products (Groningen, Netherlands).
Flow Cytometry of Intracellular Phosphorylated STATsIntracellular phosphorylated STATs (pSTATs) were evaluated using BD Phosflow kits in accordance with the manufacturer’s instructions (BD Biosciences). The expression of intracellular pSTATs was assessed by flow cytometry (FACscan, CellQuest software; BD Biosciences) using anti-phospho-STAT mAbs conjugated with a fluorochrome. PE-conjugated anti-STAT 1, 3, 4, 5, and 6 mAbs were purchased from BD Biosciences.
Proliferation AssaysThe suppressive activity of iTregs was determined by measuring the proliferative response of activated CD4+CD25− T cells. Briefly, CD4+CD25− T cells were preactivated with plate-bound anti-CD3 and soluble anti-CD28 mAbs for 5 d, and then activated CD4+CD25− T cells (2.5×10⁵) were transferred to a 96-well plate coated with an anti-CD3 mAbs for use as responder cells. At the same time, the generation of iTregs was initiated in the presence of saline or 20 mg/mL of IgG. The iTregs were harvested 5 d later and washed 3 times with PBS to remove IgG, and were then enriched using human CD4+CD25+ regulatory T cell isolation kit (Miltenyi Biotec). The enriched iTregs were added to the plates containing the responder cells at graded doses (Ctrl:0, 1/40–1/2.5), and cultured for 72 h. The cultures were pulsed with 18.7 kBq/well of [3H]-thymidine (GE Healthcare Bioscience) for the final 18 h. The cells were harvested, and the radioactivity was measured using liquid scintillation counter. All cultures were performed in triplicate, and the results were expressed as counts per minute (cpm).
Statistical AnalysisAn unpaired Student t-test was used to determine the statistical significance of the data. p-Values less than 0.05 (two-tailed) were considered significant. SAS software (SAS Institute Inc., Cary, NC, U.S.A.) was used for statistical analysis.
RESULTS
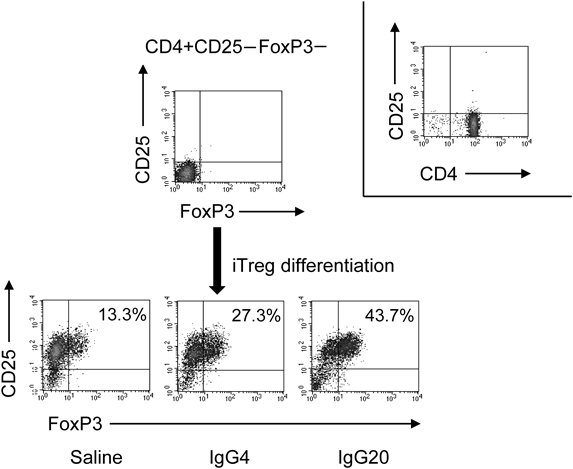
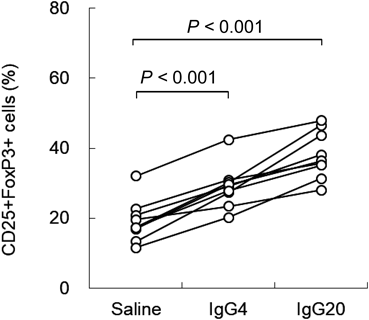
Effect of IgG on iTregs DifferentiationIt has been reported that iTregs can be differentiated by co-culturing CD4+CD25− T cells with dendritic cells (DCs), which are antigen-presenting cells.13) Therefore, we added IgG to this experimental system and investigated the effect of IgG on iTregs differentiation. imDCs were used in this experiment. imDCs was differentiated from monocytes derived from peripheral blood of healthy volunteers and CD4+CD25− T cells were obtained by removing nTregs from CD4+T cells derived from the same individual. First, we co-cultured CD4+CD25− T cells and syngeneic imDCs, culturing for 5 d in the presence of saline, 4 mg/mL IgG, or 20 mg/mL IgG to differentiate into iTregs. The concentration of IgG corresponds to the concentration of IgG that increases in the blood when 4 mg/mL is administered at a single dose of 400 mg/kg followed by 20 mg/mL administered at 400 mg/kg for 5 consecutive days. The results showed that the expression of CD25+FoxP3+ was 29.0±6.1% (p<0.001) in the IgG 4 mg/mL group and 38.1±6.8% (p<0.001) in the IgG 20 mg/mL group versus 19.0±6.0% in the saline group. IgG significantly increased the expression of CD25+Foxp3+ in a concentration-dependent manner (Figs. 1, 2).
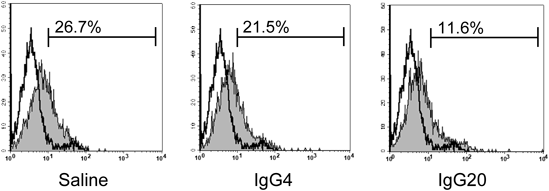
Tregs express characteristic cell surface antigens such as CTLA-4 and GITR and regulate immunity, in particular by inactivation of antigen presenting cells via CTLA-4.15,16) It has also been reported that FoxP3 acts on the promoter of CD127, which is a part of the IL-7 receptor, and contributes to a decrease in the expression of CD127.17) Table 1 and Fig. 3 show the results of measuring various characteristic cell surface antigens on Tregs. The expression of CD127 in iTregs was 20.1±5.0% (p<0.05) in the IgG 4 mg/mL group and 14.4±4.1% (p<0.01) in the IgG 20 mg/mL group versus 27.7±8.1% in the saline group. IgG significantly decreased the expression of CD127 in a concentration-dependent manner. In the differentiation of iTregs, the expression of CD127 seemed to decrease in response to the enhancement of FoxP3 expression due to IgG. On the other hand, CTLA-4 and GITR, which are highly expressed in nTregs and are thought to promote the immunosuppressive effect of nTregs, had low expression of about 10% in iTregs, and there was no expression enhancement by IgG. We confirmed that these cell surface antigens are not expressed in our iTregs.
Table 1. Effect of IgG on the Expression of iTregs Surface Molecules
| Molecule | Saline | IgG4 | IgG20 |
|---|
| CD127 | 27.7±8.1 | 20.1±5.0* | 14.4±4.1** |
| GITR | 10.9±12.1 | 8.4±11.0 | 8.7±8.5 |
| CTLA-4 | 7.5±4.3 | 8.0±4.0 | 8.4±5.0 |
CD4+CD25− cells isolated from healthy volunteers (n=6) were incubated with syngeneic imDCs for 5 d in the presence of saline, 4 mg/mL IgG (IgG4) or 20 mg/mL IgG (IgG20). CD4+CD25− cells differentiate into iTregs after 5 d. Each iTreg was harvested on day 5 and analyzed by flow cytometry. The results show the frequency of positive cells (%) for each cell surface molecule as the mean value±standard deviation., A paired t-test was used to calibrate the differences between the paired mean values (** p<0.01, * p<0.05).
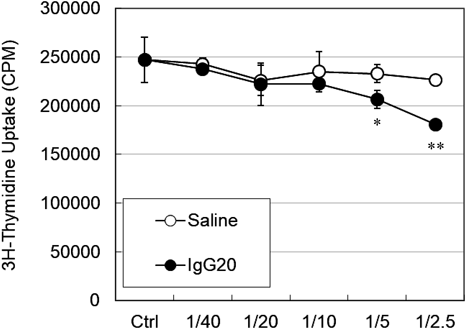
Next, we confirmed whether iTregs with Foxp3 expression enhanced in the presence of IgG possess T cell proliferation inhibitory effects (Fig. 4). In order to evaluate proliferative responses by differentiated iTregs, CD4+CD25− T cells derived from the same individuals were cultured for 5 d in the presence of anti-CD28 on anti-CD3-immobilized plates as responder cells, and each iTreg fraction was added and cultured as stimulus cells. The ratio of responder cells to stimulator cells was set at 1/40 to 1/2.5, and this mixture was cultured on an anti-CD3-immobilized plate for 72 h. T cell proliferation was measured using the radioactivity of 3H-thymidine. The results showed that the IgG-added group suppressed T cell proliferation more than the saline group (1/5: * p<0.05, 1/2.5: **p<0.01).
Intracellular Cytokine AssayBecause inhibition of the T cell proliferation response by iTregs was confirmed, intracellular cytokines were measured to investigate cytokines that contribute to this proliferation inhibiting activity (Table 2). This showed that IL-10 producing cells were 6.7±5.7% in the saline group and 9.6±7.4% in the IgG 20 mg/mL group, and IgG significantly enhanced the production of IL-10 (p<0.05). In addition, TGF-β production cells were 7.8±5.7% in the saline group versus 12.7±4.5% in the IgG 20 mg/mL group, and IgG significantly enhanced the production of TGF-β (p<0.05).
Table 2. IgG Modulates Intracellular Cytokines Production in iTregs
| Cytekine | Saline | IgG20 |
|---|
| IL-10 | 6.7±5.7 | 9.6±7.4* |
| IFN-γ | 25.2±12.0 | 27.8±17.0 |
| TGF-β | 7.8±5.7 | 12.7±4.5* |
CD4+CD25− cells isolated from healthy volunteers (n=6) were incubated with syngeneic imDCs for 5 d in the presence of saline or 20 mg/mL IgG (IgG20). CD4+CD25− cells differentiate into iTregs after 5 d. Each iTreg was harvested on day 5 and resuspended in medium containing IL-2, TGF-β and soluble anti-CD3 mAbs and Golgi stop. Each iTreg was harvested after 12h. Intracellular cytokines were assessed. The results indicate the frequency of positive cells (%) as the mean value±standard deviation. A paired t-test was used to calibrate the differences between the paired mean values (* p<0.05).
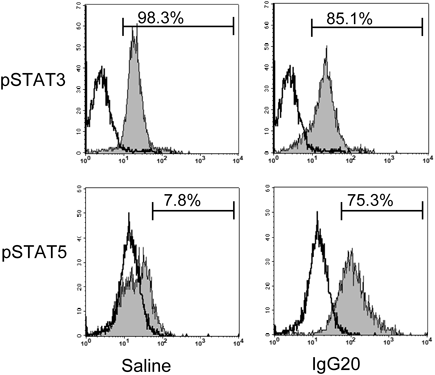
STAT is important as a transcription factor in T cells and of the final target of the cytokine signaling pathway.18,19) STAT not only regulates T cell differentiation but is also related to the transcription necessary for utilizing the function of many cytokines. We measured the intracellular phosphorylated STAT (pSTAT) to confirm the status of transcription factors in iTregs differentiated by IgG (Table 3 and Fig. 5). This showed that pSTAT3 was significantly decreased in iTregs differentiated by IgG. pSTAT5 expression related to Tregs differentiation was 5.1±3.4% in the saline group versus 62.2±28.2% (p<0.05) in the IgG 20 mg/mL group. In the differentiation of iTregs, pSTAT5 seemed to be enhanced in response to the enhancement of FoxP3 expression due to IgG.
Table 3. Intracellular Phospho-STATs Assay in iTregs
| pSTAT | Saline | IgG20 |
|---|
| pSTAT1 | N.D. | N.D. |
| pSTAT3 | 98.2±0.9 | 87.9±5.1* |
| pSTAT4 | 0.02±0.03 | 0.02±0.03 |
| pSTAT5 | 5.1±3.4 | 62.2±28.2* |
| pSTAT6 | 0.06±0.06 | 0.04±0.04 |
CD4+CD25− cells isolated from healthy volunteers (n=6) were incubated with syngeneic imDCs for 5 d in the presence of saline or 20 mg/mL IgG (IgG20). CD4+CD25− cells differentiate into iTregs. Each iTreg was harvested on day 5 and analyzed by flow cytometry for the expression of intracellular phospho-STATs. The results indicate the frequency of positive cells (%) as the mean value±standard deviation. A paired t-test was used to calibrate the differences between the paired mean values (* p<0.05).
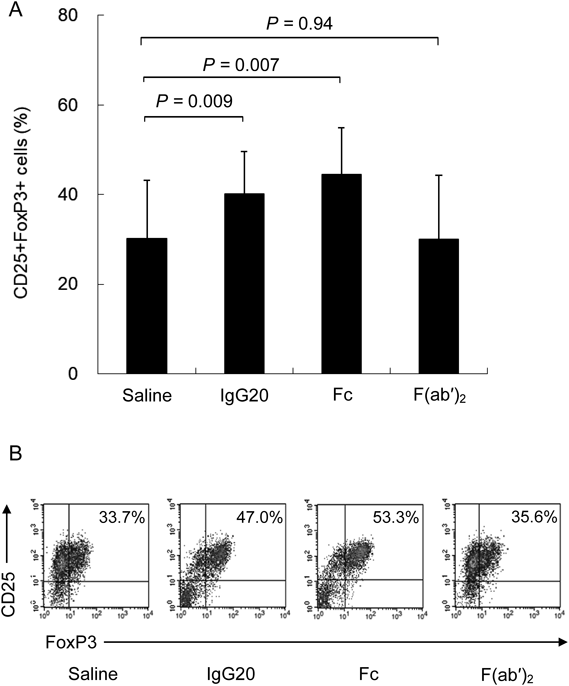
In order to clarify the involvement of Fc receptors on the results obtained so far, we compared pepsin treated globulin F(ab′)2, and papain treated globulin Fc at the same molar concentration as IVIg. It showed that Fc enhanced FoxP3 expression in iTregs differentiation like IVIg, but there was little difference between the F(ab′)2 group and the saline group (Fig. 6).
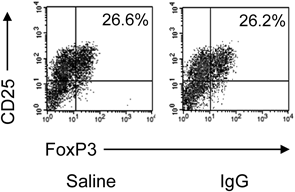
Differentiation from CD4+CD25− T Cells to iTregs without imDCsIt has also been reported that iTreg can differentiate with plate-bound anti-CD3 and soluble anti-CD28 mAbs without DCs.13) To confirm the involvement of DCs in our result, we investigated the effect of IgG on iTreg differentiation without imDCs. No difference in Foxp3 expression in iTreg differentiation was observed between the saline group and the IgG added group (Fig. 7).
DISCUSSION
It has long been known that the administration of IVIg is effective in treating several autoimmune diseases,1) but the mechanism of action is mostly explained by immunoregulatory actions by IgG.3,4) Tregs, which play a major role in immune regulation, are known as T cell subsets that regulate immune responses. As described above, nTregs and iTregs are found in the subpopulation of Tregs.6) There are several reports that IVIg affects nTregs differentiation and function.20,21) On the other hand, it has been reported that nTregs are responsible for immune regulatory function against autoantigens that affect life support, and iTregs are responsible for responses against foreign antigens.22,23) Furthermore, a molecular mimic theory has been proposed stating that the mechanism of the onset of autoimmune disease is an immune response to a foreign antigen with a structure similar to self-antigen.24) Therefore, it is extremely important to investigate the influence of IgG on iTregs differentiation in investigating the immune regulation mechanism of IVIg.
Here, we demonstrated for the first time that IgG enhances the generation of iTregs in a concentration-dependent manner and increases their regulatory function (Figs. 1, 2, 4). iTregs differentiated in the presence of IgG expressed low levels of inhibitory signaling molecules CTLA-4 and GITR, which are expressed on the cell surface, (Table 1) and produced significantly more anti-inflammatory cytokines IL-10 and TGF-β than the saline group (Table 2). This suggests that the increase in the production of anti-inflammatory cytokine in iTregs might suppress T cell proliferation.
Next, we analyzed pSTAT expression in iTregs. pSTAT3 was slightly decreased and pSTAT5 was significantly enhanced in the IgG-added group (Table 3 and Fig. 5). These results suggest that IgG may potentiate iTreg differentiation via pSTAT5 expression enhancement and may enhance inhibitory cytokine production as a function of the iTregs. According to previous reports, STAT5 activation is required to initiate differentiation of Tregs and is thought to be important due to the maintenance of Foxp3 expression and the suppressor phenotype of Tregs.25–27) In addition, STAT5 suppresses the expression of IL6R and decreases the activation of STAT3.28) This possibility is supported by Ni et al., who reported microRNA analysis of Tregs in patients with acute phase Kawasaki disease and that IVIg administration decreased STAT3 phosphorylation and increased STAT5 phosphorylation in Tregs.9) Finally, we demonstrated that the Fc region of IgG is involved in the differentiation enhancement of iTregs (Fig. 6), In addition, no difference was observed in Foxp3 expression in iTreg differentiation due to the addition or non-addition of IgG in the presence of anti-CD28 mAbs in an anti-CD3 mAbs-immobilized plate. Because of this, it was considered that IgG might act on co-cultured imDCs and enhance iTreg differentiation (Fig. 7).
This is the first report that the Fc region of IgG is involved in the differentiation enhancement of iTregs, but the detailed mechanisms underlying our results remain unclear. On the other hand, there are three different reports of the responsible region of IgG for nTregs, which is another sub-population of Tregs.
Trinath et al. reported that co-culture of human nTregs with DCs in the presence of IgG in vitro enhanced expression of Foxp3 in nTregs.29) They showed F(ab′)2 of IgG is a functional molecule region in inducing this mechanism. In particular, this effect is partially inhibited by anti-Dendritic cell-specific intracellular adhesion molecule 3-grabbing non-integrin (DC-SIGN) antibodies, suggesting that sialylated F(ab′)2 may be a ligand for DC-SIGN.
De Groot et al. conducted an epitope analysis of IgG in silico and found immunoregulatory epitopes capable of specifically activating nTregs in IgG molecules, and it was initially reported that they were contained in the Fc region.30)
In a subsequent study, De Groot et al. reported that these immunoregulatory epitopes are also included in the F(ab′)2 region and are scattered.31) They named six IgG-derived peptides that specifically activate these nTregs “Tregitopes,” and proposed a mechanism of action in which DCs present these peptides to T cells in vivo.
In addition, Kessel et al. investigated the effect of IgG on human nTregs in vitro and reported that the expression of Foxp3 in nTregs was increased by the addition of IgG, which also increased the production of IL-10 and TGF-β 32).
They speculate that this mechanism of action is a direct action of antibodies against the T cell receptor variable domain on the surface of nTregs, i.e., specific antibodies rather than specific regions of IgG.
As summarized so far, there is no definite conclusion on which region of IgG or what is acting on the enhancement of nTregs by IgG.
Here we suggest that the Fc region of IgG is involved in the differentiation enhancement of iTregs and that IgG acts on co-cultured imDCs. Although the detailed mechanism of the enhancement of iTregs differentiation by IgG via imDCs is still unknown, two possibilities may be considered: one is sialylated Fc and the other is “Tregitopes” contained in the Fc region of IgG. It is possible that the DCs receptor recognizes the responsible region of IgG and signals control to T cells.
Because the mechanism of action of IVIg in autoimmune diseases is complicated, we speculate that the molecular region in which IgG acts may differ depending on the target species and immunocompetent cells. Further studies are required to elucidate the mechanism of action.
Taken together, we showed concentration-dependent iTregs differentiation with IgG, and that there is a possibility that IVIg administration increases the concentration of IgG in the blood, which in turn increases iTregs, consequently contributing to the improvement of autoimmune disease. Furthermore, since iTregs can be prepared in vitro, further research on the use of iTregs for suppressing autoimmune diseases and rejection is expected.33) We also expect our findings to be useful as basic information on the clinical application of iTregs.
Acknowledgments
We would like to thank Takako Inoue-Matsui for her assistance with experimentation and to Mitsutoshi Eguchi and Asami Shindome-Matsumura for their preparation of various immunoglobulins. We would like to thank Kenshi Hayashida for advice on statistical analyses and Otis McCulloch for carefully proofreading this manuscript. We would also like to take this opportunity to thank Dr. Takayoshi Hamamoto, Dr. Kenji Soejima, and Dr. Toshihiro Nakashima for their helpful advice.
Conflict of Interest
All authors are employees of KM Biologics Co., Ltd. (formerly The Chemo-Sero-Therapeutic Research Institute).
REFERENCES
- 1) Perez EE, Orange JS, Bonilla F, Chinen J, Chinn IK, Dorsey M, El-Gamal Y, Harville TO, Hossny E, Mazer B, Nelson R, Secord E, Jordan SC, Stiehm ER, Vo AA, Ballow M. Update on the use of immunoglobulin in human disease: A review of evidence. J. Allergy Clin. Immunol., 139 (3S), S1–S46 (2017).
- 2) Heyman B. Regulation of Antibody Responses via Antibodies, Complement, and Fc Receptors. Annu. Rev. Immunol., 18, 709–737 (2000).
- 3) Schwab I, Nimmerjahn F. Intravenous immunoglobulin therapy: How does IgG modulate the immune system? Nat. Rev. Immunol., 13, 176–189 (2013).
- 4) Kaufman GN, Massoud AH, Dembele M, Yona M, Piccirillo CA, Mazer BD. Induction of Regulatory T Cells by Intravenous Immunoglobulin: A Bridge between Adaptive and Innate Immunity. Front. Immunol., 6, 469 (2015).
- 5) Ohkura N, Kitagawa Y, Sakaguchi S. Development and Maintenance of Regulatory T cells. Immunity, 38, 414–423 (2013).
- 6) Sakaguchi S, Yamaguchi T, Nomura T, Ono M. Regulatory T Cells and Immune Tolerance. Cell, 133, 775–787 (2008).
- 7) Guo MM-H, Tseng W-N, Ko C-H, Pan H-M, Hsieh K-S, Kuo H-C. Th17- and Treg-related cytokine and mRNA expression are associated with acute and resolving Kawasaki disease. Allergy, 70, 310–318 (2015).
- 8) Maddur MS, Rabin M, Hegde P, Bolgert F, Guy M, Vallat J-M, Magy L, Bayry J, Kaveri SV. Intravenous immunoglobulin exerts reciprocal regulation of Th1/Th17 cells and regulatory T cells in Guillain–Barré syndrome patients. Immunol. Res., 60, 320–329 (2014).
- 9) Ni F-F, Li C-R, Li Q, Xia Y, Wang G-B, Yang J. Regulatory T cell microRNA expression changes in children with acute Kawasaki disease. Clin. Exp. Immunol., 178, 384–393 (2014).
- 10) Petta F, De Luca C, Triggiani M, Casolaro V. Fragments of truth: T-cell targets of polyclonal immunoglobulins in autoimmune diseases. Curr. Opin. Pharmacol., 17, 1–11 (2014).
- 11) Tsurikisawa N, Saito H, Oshikata C, Tsuburai T, Akiyama K. High-dose intravenous immunoglobulin therapy for eosinophilic granulomatosis with polyangiitis. Clin Transl Allergy., 4, 38 (2014).
- 12) Piccirillo CA, Thornton AM. Cornerstone of peripheral tolerance: naturally occurring CD4+CD25+ regulatory T cells. Trends Immunol., 25, 374–380 (2004).
- 13) Tran DQ, Ramsey H, Shevach EM. Induction of FOXP3 expression in naive human CD4+FOXP3 T cells by T-cell receptor stimulation is transforming growth factor-beta dependent but does not confer a regulatory phenotype. Blood, 110, 2983–2990 (2007).
- 14) Ohkuma K, Sasaki T, Kamei S, Okuda S, Nakano H, Hamamoto T, Fujihara K, Nakashima I, Misu T, Itoyama Y. Modulation of dendritic cell development by immunoglobulin G in control subjects and multiple sclerosis patients. Clin. Exp. Immunol., 150, 397–406 (2007).
- 15) Tanaka A, Sakaguchi S. Regulatory T cells in cancer immunotherapy. Cell Res., 27, 109–118 (2017).
- 16) Wing K, Onishi Y, Prieto-Martin P, Yamaguchi T, Miyara M, Fehervari Z, Nomura T, Sakaguchi S. CTLA-4 Control over Foxp3+ Regulatory T Cell Function. Science, 322, 271–275 (2008).
- 17) Liu W, Putnam AL, Xu-yu Z, Szot GL, Lee MR, Zhu S, Gottlieb PA, Kapranov P, Gingeras TR, de St. Groth BF, Clayberger C, Soper DM, Ziegler SF, Bluestone JA. CD127 expression inversely correlates with FoxP3 and suppressive function of human CD4+ T reg cells. J. Exp. Med., 203, 1701–1711 (2006).
- 18) Schindler C, Darnell JE Jr. Transcriptional Responses to Polypeptide Ligands: The JAK-STAT Pathway. Annu. Rev. Biochem., 64, 621–651 (1995).
- 19) Murray PJ. The JAK-STAT signaling pathway: Input and output integration. J. Immunol., 178, 2623–2629 (2007).
- 20) Maddur MS, Othy S, Hegde P, Vani J, Lacroix-Desmazes S, Bayry J, Kaveri SV. Immunomodulation by Intravenous Immunoglobulin: Role of Regulatory T Cells. J. Clin. Immunol., 30 (Suppl. 1), 4–8 (2010).
- 21) Kwekkeboom J. Modulation of Dendritic Cells and Regulatory T Cells by Naturally Occurring Antibodies. Adv. Exp. Med. Biol., 750, 133–144 (2012).
- 22) Josefowicz SZ, Niec RE, Kim HY, Treuting P, Chinen T, Zheng Y, Umetsu DT, Rudensky AY. Extrathymically generated regulatory T cells control mucosal TH2 inflammation. Nature, 482, 395–399 (2012).
- 23) Samstein RM, Josefowicz SZ, Arvey A, Treuting PM, Rudensky AY. Extrathymic Generation of Regulatory T Cells in Placental Mammals Mitigates Maternal-Fetal Conflict. Cell, 150, 29–38 (2012).
- 24) Cusick MF, Libbey JE, Fujinami RS. Molecular mimicry as a mechanism of autoimmune disease. Clin. Rev. Allergy Immunol., 42, 102–111 (2012).
- 25) Cohen A, Nadeau K, Tu W, Hwa V, Dionis K, Bezrodnik L, Teper A, Gaillard M, Heinrich J, Krensky A, Rosenfeld R, Lewis D. Sa 86. Decreased Generation and Function of CD4+CD25 Hi T Regulatory Cells in Human STAT5b Deficiency. Clin. Immunol., 119, S135 (2006).
- 26) Burchill MA, Yang J, Vogtenhuber C, Blazar BR, Farrar MA. IL-2 receptor beta-dependent STAT5 activation is required for the development of Foxp3+ regulatory T cells. J. Immunol., 178, 280–290 (2007).
- 27) Passerini L, Allan SE, Battaglia M, Di Nunzio S, Alstad AN, Levings MK, Roncarolo MG, Bacchetta R. STAT5-signaling cytokines regulate the expression of FOXP3 in CD4+CD25+ regulatory T cells and CD4+CD25- effector T cells. Int. Immunol., 20, 421–431 (2008).
- 28) Liao W, Lin JX, Wang L, Li P, Leonard WJ. Modulation of cytokine receptors by IL-2 broadly regulates differentiation into helper T cell lineages. Nat. Immunol., 12, 551–559 (2011).
- 29) Trinath J, Hegde P, Sharma M, Maddur MS, Rabin M, Vallat JM, Magy L, Balaji KN, Kaveri SV, Bayry J. Intravenous immunoglobulin expands regulatory T cells via induction of cyclooxygenase-2-dependent prostaglandin E2 in human dendritic cells. Blood, 122, 1419–1427 (2013).
- 30) De Groot AS, Moise L, McMurry JA, Wambre E, Van Overtvelt L, Moingeon P, Scott DW, Martin W. Activation of natural regulatory T cells by IgG Fc-derived peptide “Tregitopes.” Blood, 112, 3303–3311 (2008).
- 31) Cousens LP, Tassone R, Mazer BD, Ramachandiran V, Scott DW, De Groot AS. Tregitope update: Mechanism of action parallels IVIg. Autoimmun. Rev., 12, 436–443 (2013).
- 32) Kessel A, Ammuri H, Peri R, Pavlotzky ER, Blank M, Shoenfeld Y, Toubi E. Intravenous immunoglobulin therapy affects T regulatory cells by increasing their suppressive function. J. Immunol., 179, 5571–5575 (2007).
- 33) Brunstein CG, Miller JS, Cao Q, McKenna DH, Hippen KL, Curtsinger J, Defor T, Levine BL, June CH, Rubinstein P, McGlave PB, Blazar BR, Wagner JE. Infusion of ex vivo expanded T regulatory cells in adults transplanted with umbilical cord blood: safety profile and detection kinetics. Blood, 117, 1061–1070 (2011).