Abstract
Ulcerative colitis is characterized by colonic mucosal bleeding and ulceration, often with repeated active and remission stages. One factor in ulcerative colitis development is increased susceptibility to commensal bacteria and lipopolysaccharide (LPS). LPS activates macrophages to release nitric oxide (NO) through Toll-like receptor 4 (TLR4) signaling. However, whether NO is beneficial or detrimental to colitis remains controversial. In this study, we investigated whether NO enhances the development of colitis in mice treated with dextran sulfate sodium (DSS) and inflammation in cells treated with low-dose LPS. An NO donor, NOC18, induced colitis and increased CD14 protein and nitrotyrosine levels in colonic macrophages from mice treated with DSS for 7 d (molecular weight: 5000). In the mouse peritoneal macrophage cell line RAW264.7 stimulated with 3 ng/mL LPS, NO activated the CD14-TLR4-nuclear factor kappa B (NF-κB) axis. Low-dose LPS stimulation did not change the levels of signal transducer and activator of transcription (STAT) 3 phosphorylation, CD14, inducible NO synthase, interleukin (IL)-6, or NF-κB. In addition, low-dose LPS increased phosphorylation of src homology protein tyrosine phosphatase 2 (SHP2), a negative regulator of STAT3 phosphorylation. However, NO decreased SHP2 phosphorylation and significantly activated the downstream signaling molecules. NO increased SHP2 nitration in LPS-stimulated RAW264.7 cells and DSS-treated mice. These results indicate that SHP2 nitration in macrophages might be involved in activation of the CD14-TLR4-NF-κB axis through STAT3 signaling in mice with DSS-induced colitis.
Symptoms of ulcerative colitis include weight loss, diarrhea, bloody stools, and mucosal inflammation in the colon, often with repeating active and remission stages. Approximately 20% of patients with ulcerative colitis experience severe flares, resulting in hospitalization.1) The incidence of colon cancer is reported to increase in long term colitis patients. Therefore, chronic colitis is considered to be a risk factor for colon cancer.2) Abnormal changes in the intestinal environment are associated with the pathology of ulcerative colitis.1,3) In particular, enhanced susceptibility to commensal bacteria and lipopolysaccharide (LPS) from Gram-negative bacteria attributed to intestinal epithelial barrier dysfunction is associated with ulcerative colitis and experimental colitis induced by agents such as dextran sodium sulfate (DSS).4) LPS regulates intestinal tight junction permeability by activation of Toll-like receptor (TLR) 4 signaling.5) It is well established that LPS activates macrophages that release nitric oxide (NO) through activation of the TLR4 signaling pathway and downstream inducible NO synthase (iNOS) expression.6)
Although there is continued controversy regarding whether NO is beneficial7) or detrimental8,9) to ulcerative colitis and experimental colitis in rodents, most studies have implicated NO in progression of the disease.8–12) Indeed, the levels of iNOS and NO metabolites nitrate and nitrite are elevated in inflamed mucosal samples from patients with ulcerative colitis.10–12) iNOS-deficient mice are less sensitive than wild type mice to chronic colitis.8) Furthermore, treatment with an iNOS inhibitor, aminoguanidine, relieves symptoms such as decreased body weight and colon shortening in DSS-induced colitis.9)
One detrimental effect of NO and its metabolites on colon tissue is nitration of critical proteins by forming nitrotyrosine.10,11) We have observed increased nitrotyrosine levels in the colon mucosa of mice with DSS-induced colitis, which was inhibited by treatment with aminoguanidine or an NO scavenger, 2-(4-carboxyphenyl)-4,4,5,5-tetramethylimidazoline-1-oxyl-3-oxide (c-PTIO).13) In this previous study, we also found that aminoguanidine or c-PTIO attenuated increases in protein expression of TLR4 and downstream nuclear factor kappa B (NF-κB) in mice with DSS-induced colitis. TLR4 and NF-κB are important for the onset and/or progression of ulcerative colitis. Because NF-κB activation induces iNOS expression,14) the resulting additional NO production accelerates activation of TLR4 signaling.13) However, there have been no direct observations of the deleterious effects of NO or its metabolites during the development of colitis. Therefore, in the present study, we investigated the mechanisms of NO involvement, focusing on protein tyrosine nitration in activation of the TLR4-NF-κB axis in mice with DSS-induced colitis and LPS-stimulated RAW264.7 macrophages. We found that nitration of src homology protein tyrosine phosphatase (SHP) 2 by NO enhanced susceptibility to LPS and caused continuous activation of the TLR4-NF-κB-signal transduction and activator of transcription (STAT)3 axis, thereby worsening the development of DSS-induced colitis.
MATERIALS AND METHODS
ChemicalsDSS (199-08361) was purchased from Wako Pure Chemical Industries, Ltd. (Osaka, Japan). 1-Hydroxy-2-oxo-3,3-bis-(2-aminoethyl)-1-triazene (NOC18) (N379) was purchased from Dojindo (Kumamoto, Japan). Sodium orthovanadate (198-09752), RIPA Lysis Buffer System (sc-24948), and STAT3 inhibitor S3I-201 (sc-204304) were obtained from Santa Cruz Biotechnology (Dallas, TX, U.S.A.). Immobilon western chemiluminescent horseradish peroxidase substrate (WBKLS0500) and NF-κB activation inhibitor BMS-345541 (401480-1MGCN) were purchased from Merck Millipore Corporation (Darmstadt, Germany). A protease inhibitor cocktail (K271-500) was purchased from BioVision (Milpitas, CA, U.S.A.). TLR4 inhibitor VIPER (NBP2-26244) and LPS from Escherichia coli serotype O55:B5 (L2880-25MG) were obtained from Novus Biologicals (Littleton, CO, U.S.A.) and Sigma-Aldrich (St. Louis, MO, U.S.A.), respectively. All other reagents were purchased from Wako Pure Chemical Industries, Ltd.
Ethical Approval of the Study ProtocolThe study protocol was approved by the Committee on Ethics of Animal Experiments, Faculty of Pharmaceutical Sciences, Kyushu University (Fukuoka, Japan). Animal experiments were conducted in accordance with the Guidelines for Animal Experiments of the Faculty of Pharmaceutical Sciences of Kyushu University.
AnimalsMale ICR mice (4 weeks of age; body weight: 18–22 g) were obtained from Kyudo (Saga, Japan) and acclimatized for 1 week before experiments. Food (MF; Oriental Yeast Company, Tokyo, Japan) and water were provided ad libitum. The body weight and disease activity index of each mouse were measured at the same time each day during DSS consumption. As an indicator of the disease state, the disease activity index was calculated by the sum of the bloody score (0–3) and diarrhea score (0–3). On day 7, after sacrificing the mice under anesthesia induced by pentobarbital sodium (0.65 g/kg, intraperitoneally (i.p.)), the length of the large intestine was measured.
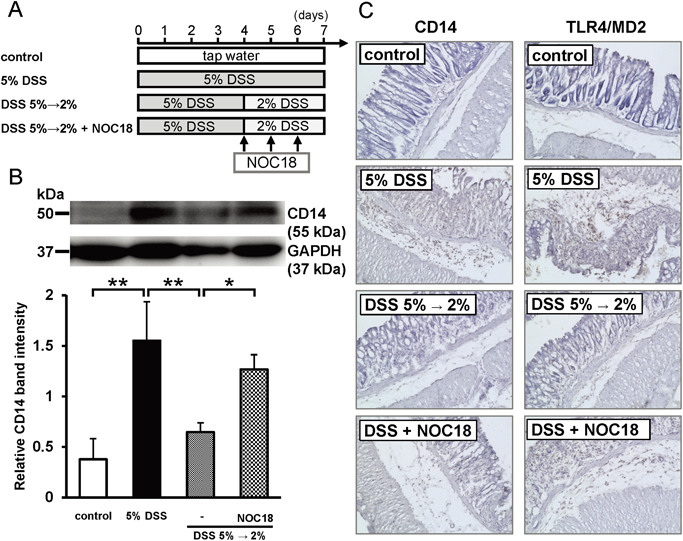
Drug TreatmentsColonic mucosal lesions were induced by replacing drinking water with tap water containing 5% DSS (molecular weight: 5000; sulfur content: 15–20%) for 7 d, which was provided ad libitum. NOC18 (5 mg/kg/d) was subcutaneously injected once per day beginning on day 4 after DSS challenge. To maximize the observable effects of NOC18, the DSS concentration was decreased from 5 to 2% on day 4 of DSS challenge.13)
Cell CultureThe mouse peritoneal macrophage cell line RAW264.7 obtained from the American Type Culture Collection (Manassas, VA, U.S.A.) was cultured in Dulbecco’s modified Eagle’s medium (1 g/L glucose; Product No. 08456) containing 10% fetal bovine serum in a CO2 incubator at 37°C with 5% CO2. The LPS concentration and stimulation time suitable for induction of TLR4 signal activation with addition of NOC18 were determined in a pilot study. As a pilot study, cells were stimulated with 3, 10, or 30 ng/mL LPS and collected at 2, 4 or 6 h after LPS addition to explore conditions suitable for activation of TLR4 signaling in the presence of NOC18. For experiments using protein inhibitors or RT-PCR analysis, NOC18 (1, 3, or 10 µmol/L) was added to the cells at 2 h after addition of 3 ng/mL LPS, and the cells were collected at 4 h after LPS addition. Where indicated, at 1 h before LPS stimulation, VIPER (5 µmol/L), S3I-201 (50 µmol/L), or BMS-345541 (50 µmol/L) were also added to the RAW264.7 cells. The selected conditions were 3 ng/mL LPS and 4 h of stimulation time. NOC18 (1, 3, or 10 µmol/L) was added to the cells at 2 h after initiating stimulation with 3 ng/mL LPS, and the cells were collected at 4 h after LPS addition for Western blotting and RT-PCR analysis.
Western Blot AnalysisFor colon tissue samples, homogenates were prepared in lysis buffer [50 mmol/L Tris–HCl, pH 7.5, 0.15 mol/L NaCl, 0.1% sodium dodecyl sulfate (SDS), 1% Triton X-100, and 1% deoxycholic acid] containing 1 mmol/L benzylsulfonyl fluoride, the protease inhibitor cocktail, and 1 mmol/L sodium orthovanadate. For cells, lysates of 1×10⁷ cells each were prepared in the RIPA Lysis Buffer System. The samples were sonicated on ice (0.5 s×60 times) and then centrifuged (15000×g, 30 min, 4°C). The supernatants were mixed with sample buffer (final concentrations: 8.25% glycerol, 0.108 mmol/L bromophenol blue, 0.72% SDS, and 5% 2-mercaptoethanol in 0.5 mol/L Tris–HCl, pH 6.8), and the samples stored at −30°C for subsequent Western blotting. Samples were separated on 10% SDS-polyacrylamide gels and transferred onto Immun-Blot® polyvinylidene difluoride membranes (Bio-Rad Laboratories, Hercules, CA, U.S.A.). The transferred proteins were reacted with a primary antibody at 4°C for at least 6 h. After washing in Tris-buffered saline with 0.1% Tween 20, the membranes were reacted with a secondary antibody at room temperature for 1 h. Bands were visualized by staining with EzWestLumi plus (WSE-7120 L; ATTO Corporation, Tokyo, Japan) and analyzed by densitometry with an LAS4000 instrument (GE Healthcare Bio-Sciences AB, Uppsala, Sweden). Band intensities were normalized to control bands of glyceraldehyde 3-phosphate dehydrogenase (GAPDH). Data were analyzed with image processing software ImageJ.15)
ImmunostainingMouse colon tissue samples were collected on day 7 of 5% DSS (in drinking water) treatment, embedded in O.C.T. Compound (Sakura Finetek Japan, Tokyo, Japan), and rapidly frozen in liquid nitrogen. The frozen tissue blocks were sectioned at 10 µm thicknesses using a microtome, and the tissue sections were mounted on glass slides. After fixing with acetone and immersing in ethanol, some tissue sections were stained with hematoxylin and eosin. For immunostaining, after incubating with 3% H2O2 and 4% skim milk, sections were incubated with the appropriate primary antibody at 4°C overnight. Then, the tissue sections were washed in phosphate buffered saline and incubated with the secondary antibody labeled with horseradish peroxidase or a fluorescent dye at room temperature for 30 min. To detect horseradish peroxidase (HRP), the sections were stained using a Vectastain ABC Kit (Vector Laboratories, Burlingame, CA, U.S.A.) and DAB Reagent Set (SeraCare Life Sciences, Milford, MA, U.S.A.). Images were then obtained under an optical microscope equipped with a digital camera. For fluorescence detection, sections were stained with ProLong® Gold Antifade Reagent with 4′,6-diamidine-2-phenylindole dihydrochloride (P36935; Thermo Fisher Scientific, Waltham, MA, U.S.A.). Images were then obtained under a confocal laser microscope equipped with a digital camera.
AntibodiesThe following primary antibodies were used: mouse anti-GAPDH monoclonal antibody (mAb) (Medical & Biological Laboratories, Nagoya, Japan); anti-NOS2 antibody (M-19, sc-650), anti-F4/80 antibody (M-300, sc-25830), anti-p-SH-PTP2 antibody (Tyr 542, sc-101798), and anti-SH-PTP2 antibody (C-18, sc-280) from Santa Cruz Biotechnology; NF-κB p65 mouse mAb (NF-12) and anti-TLR4 antibody from GeneTex (Irvine, CA, U.S.A.); rat anti-TLR4/MD-2 complex mAb (eBioscience, San Diego, CA, U.S.A.); mouse anti-CD14 mAb (R&D Systems, Minneapolis, MN, U.S.A.); anti-phospho-STAT3 antibody (Tyr 705, #9131), mouse anti-STAT3 mAb, (124H6, #9139), and rabbit anti-phospho-SHP2 mAb (Tyr 580,#5431) from Cell Signaling Technology (Tokyo, Japan); anti-SOCS3 antibody (ab16030), anti-myeloperoxidase antibody (ab9535), rat anti-F4/80 mAb (CI:A3-1, ab6640), and 3-nitrotyrosine mouse mAb (7A12AF6, ab110282) from Abcam (Cambridge, U.K.). The following secondary antibodies were used for Western blotting: goat anti-mouse immunoglobulin G (IgG) and immunoglobulin M (IgM) antibodies, and goat anti-rat IgG antibody (AP136P) from Merck Millipore Corporation (Darmstadt, Germany); goat anti-rabbit IgG, HRP-conjugated antibody (R&D Systems). The following secondary antibodies were used for immunostaining: biotinylated rabbit anti-rat IgG antibody (BA-4001) and biotinylated goat anti-rabbit IgG antibody (BA-1000) from Vector Laboratories (Burlingame, CA, U.S.A.); donkey anti-rabbit IgG H&L (Alexa Fluor® 647, ab150075), donkey anti-mouse IgG H&L (Alexa Fluor® 488, ab150105), donkey anti-mouse IgG H&L (Alexa Fluor® 647, ab150107), and goat anti-rat IgG H&L (Alexa Fluor® 647, ab150159) from Abcam. Unless otherwise indicated, the antibody was polyclonal and raised in rabbits.
RT-PCRTotal RNA was extracted with TRIzol reagent (Thermo Fisher Scientific), according to the manufacturer’s instructions. A total of 1 µg extracted RNA was reverse transcribed to cDNA using a QuantiTect Reverse Transcription Kit from Qiagen (Hilden, Germany). After an initial denaturation step at 95°C for 5 min, temperature cycling was initiated. Each cycle consisted of denaturation at 95°C for 5 s, annealing at 60°C for 10 s, and elongation for 30 s. A total of 40 cycles were performed. The cDNA was amplified in duplicate using THUNDERBIRD® qPCR Mix from Toyobo (Osaka, Japan) in a 7500 Real-Time PCR System (Applied Biosystems, Waltham, MA, U.S.A.). The sequences of primer pairs were: iNOS forward primer (5′-GCC ACC AAC AAT GGC AAC-3′), iNOS reverse primer (5′-CGT ACC GGA TGA GCT GTG AAT T-3′), interleukin (IL)-6 forward primer (5′-GTG GCT AAG GAC CAA GAC CA-3′), IL-6 reverse primer (5′-TAA CGC ACT AGG TTT GCC GA-3′), tumor necrosis factor (TNF)-α forward primer (5′-ATG GCC TCC CTC TCA GTT C-3′), TNF-α reverse primer (5′-TTG GTG GTT TGC TAC GAC GTG-3′), β-actin forward primer (5′-CAC ACC TTC TAC AAT GAG CTG C-3′), β-actin reverse primer (5′-CAT GAT CTG GGT CAT CTT TTC A-3′), TLR4 forward primer (5′-TTA TCC AGG TGT GAA ATT GAA ACA ATT G-3′), TLR4 reverse primer (5′-CAC AGC CAC CAG ATT CTC TAA ACT T-3′), CD14 forward primer (5′-ATG GAG CGT GTG CTT GGC T-3′), and CD14 reverse primer (5′-ACC AAT CTG GCT TCG GAT CTG A-3′). The primer pairs for TLR4 and CD14 were purchased from Sigma-Aldrich (St. Louis, MO, U.S.A.), and other primer pairs were obtained from Genenet (Fukuoka, Japan).
Extraction of NucleoproteinsNucleoproteins were extracted using NE-PER™ Nuclear and Cytoplasmic Extraction Reagents (78833; Thermo Fisher Scientific), according to the manufacturer’s instructions. A total of 5×10⁶ RAW264.7 cells were used. Briefly, 100 µL cytoplasmic extraction reagent (CER) I was mixed with the cells, and the samples were incubated on ice for 10 min. After addition of 5.5 µL CER II to the cell suspension, the mixture was centrifuged (15000×g, 5 min, 4°C) and the pellets were collected. Nuclear extraction reagent (50 µL) was added to each pellet, and the samples were mixed well and then centrifuged (15000×g, 5 min, 4°C). The supernatants (nuclear fractions) were stored at −80°C for subsequent Western blotting.
Measurement of IL-6 ProteinAliquots of 100 µL of the RIPA Lysis Buffer System were mixed with RAW264.7 cells (1×10⁷ per sample), and the samples were sonicated (0.5 s ×60 times) and then centrifuged (15000×g, 5 min, 4°C). IL-6 protein levels in the supernatants were measured with a Mouse IL-6 Quantikine enzyme-linked immunosorbent assay (ELISA) Kit (M6000B, R&D Systems).
ImmunoprecipitationImmunoprecipitation of nitrated proteins was performed using SureBeads™ Protein A Magnetic Beads (161-4013, Bio-Rad Laboratories, Inc.). A 100 µL aliquot of the RIPA Lysis Buffer System was mixed with RAW264.7 cells (1×10⁷), and the samples were sonicated (0.5 s ×60 times) and then centrifuged (15000×g, 5 min, 4°C). A 100 µL aliquot of beads in each Eppendorf tube was washed with phosphate buffered saline containing 0.1% Tween 20. The anti-nitrotyrosine antibody (1/200, 200 µL) was added to the tube, and it was mixed on a rotator at room temperature for 10 min. After washing, the beads were magnetized and the residual buffer was aspirated from the tube. A 400 µL aliquot of cell lysate was added to each tube, and the samples mixed on a rotator at room temperature for 1 h. After washing, 40 µL sample buffer (41% glycerol, 0.54 mmol/L bromophenol blue, and 25% 2-mercaptoethanol in 0.16 mol/L Tris–HCl buffer, pH 6.8) containing 3.6% SDS was added to the mixture. The mixture was incubated at 70°C for 10 min. The eluent separated from the beads by the magnet was transferred to a new tube, and then the extract was incubated at 100°C for 3 min, cooled on ice, and stored at −30°C for subsequent analysis by Western blotting.
Statistical AnalysisStatistical analyses were performed using StatView 5.0 software (SAS Institute Inc., Cary, NC, U.S.A.). Data were analyzed using the unpaired Student t-test or ANOVA, followed by the Dunnett or Tukey–Kramer post hoc test. Results are presented as means±standard deviation (S.D.). A value of p<0.05 was considered as significant.
RESULTS
NO Induces Expression of CD14 and the TLR4/MD2 Complex in Colon Tissue of DSS-Treated MiceWe examined the effects of NO on development of DSS-induced colitis with an experimental design similar to that in our previous study13) (Fig. 1A). NO exacerbated colitis in mice with DSS treatment switched from 5 to 2% (Fig. S1). We examined whether NO treatment induced CD14 and TLR4/MD2 expression in mice treated with DSS. NOC18 administration in the 2% DSS group induced higher CD14 protein levels than those in the 2% DSS group without NOC18. However, switching to 2% DSS did not significantly enhance CD14 expression (Figs. 1B, C). Similarly, TLR4/MD2 expression was also increased by NOC18 treatment (Fig. 1C).
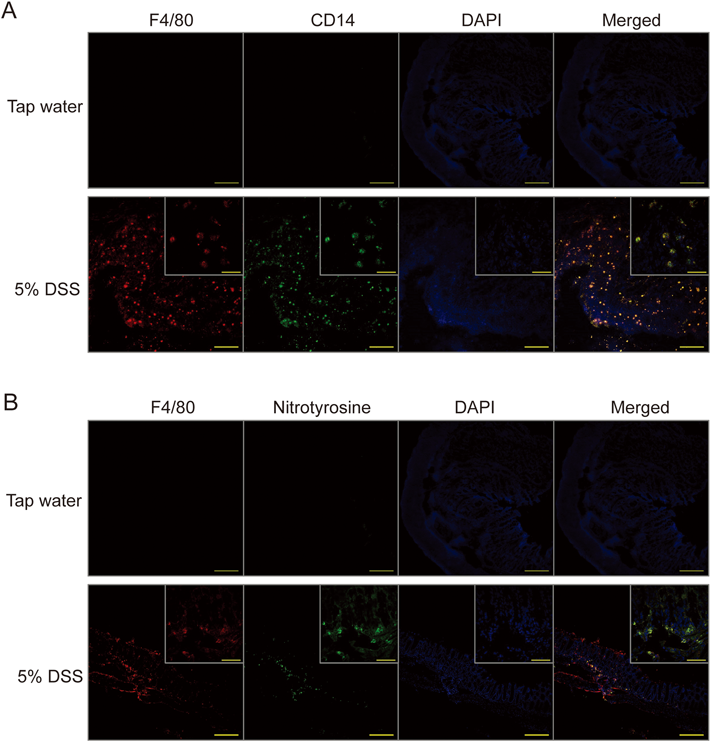
Next, we investigated whether CD14 and nitrotyrosine were localized in macrophages migrating into colon tissue of DSS-challenged mice. Both F4/80, which is widely used as a macrophage marker, and CD14 staining were clearly observed in colons from the 5% DSS group. Merged images showed that CD14 and F4/80 were colocalized in colon tissue of mice with DSS-induced colitis (Fig. 2A). Similarly, nitrotyrosine-stained cells were present in the 5% DSS group, but not in the tap water group. Moreover, the percentage of colocalization in all merged images was 96±3% (mean±S.D.), supporting colocalization of nitrotyrosine and F4/80 (Fig. 2B). These results indicated that NO, which was released from NOC18, induced CD14 expression in macrophages migrating into the colon tissue of mice challenged with the lower DSS concentration.
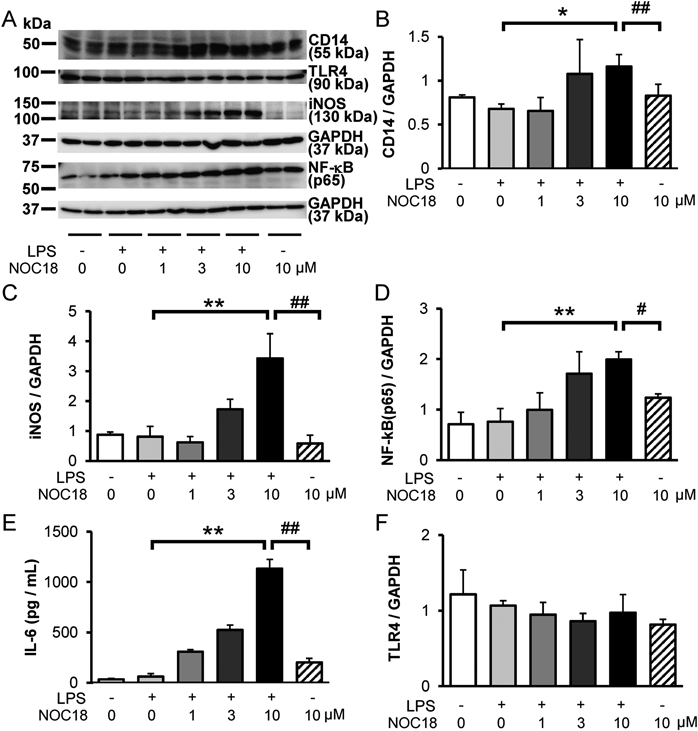
NO Activates TLR4 Signaling in LPS-Stimulated RAW264.7 CellsNext, we performed in vitro experiments using the mouse peritoneal macrophage cell line RAW264.7 to examine whether NO induced an inflammatory response under stimulation by a low LPS concentration. As shown in Fig. S2, based on preliminary assessments, we selected 3 ng/mL LPS and a 4-h exposure time for a minimally activatable state. After RAW264.7 cells were stimulated for 2 h with 3 ng/mL LPS, NOC18 was added to the medium. After another 2 h of stimulation, the samples were analyzed by Western blotting and real-time PCR. NO treatment after 3 ng/mL LPS stimulation significantly increased the levels of CD14, iNOS, NF-κB p65, and IL-6 proteins in an NOC18 dose-dependent manner (Figs. 3A–E). However, TLR4 levels in cell lysates were unaffected by NOC18 (Fig. 3F). NOC18 had a similar effect on mRNA expression (Fig. S3). These results suggested that both 10 µmol/L NOC18 and 3 ng/mL LPS upregulated expression of CD14, iNOS, and IL-6 mRNA, but not that of TLR4 in RAW264.7 cells.
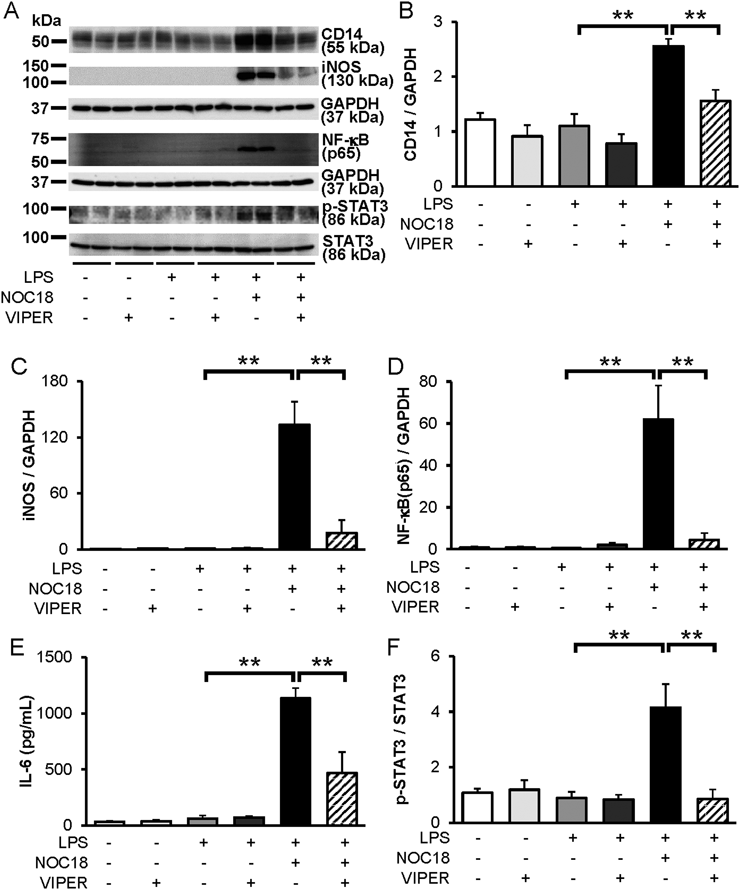
Effects of Protein Inhibitors on CD14, iNOS, NF-κB, and IL-6 Protein Expression and STAT3 PhosphorylationNext, to examine which proteins involved in TLR4 and STAT3 signaling were functionally upregulated by NO, we used several protein inhibitors, namely VIPER, BMS-345541, and S3I-201. VIPER is a viral peptide that specifically inhibits TLR4.16) It suppressed the increases in CD14, iNOS, IL-6, and NF-κB (p65) levels, as well as the increase in the phosphorylated-STAT3 (p-STAT3) to STAT3 ratio in cells stimulated by LPS and treated with NOC18 (Fig. 4). These results indicated that NO and low-dose LPS stimulation exerted their effects through TLR4 signaling.
BMS-345541 is an inhibitor of kappa B (IκB) kinase inhibitor that blocks signal transmission by NF-κB.17) Pretreatment of LPS and NOC18-treated RAW264.7 cells with BMS-345541 significantly suppressed the increased protein levels of CD14, iNOS, NF-κB (p65), and IL-6 (Figs. S4A–E). Interestingly, BMS-345541 also suppressed the increased p-STAT3 to STAT3 ratio in these RAW264.7 cells (Fig. S4F).
Next, we applied S3I-201 that prevents STAT3 activation by blocking its phosphorylation and dimerization.18) A previous report has suggested that pretreatment with S3I-201 inhibits the enhancement of CD14 mRNA expression in RAW264.7 cells by 10 ng/mL LPS stimulation.19) We found that S3I-201 suppressed the increases in CD14, iNOS, IL-6 and NF-κB (p65) expression of RAW264.7 cells stimulated by 3 ng/mL LPS and NOC18 (Fig. 5).
Collectively, these results indicated that low LPS concentrations plus NOC18, but not LPS alone, potentiated TLR4 signaling and induced CD14, iNOS, IL-6, and p-STAT3 expression. Hence, NO is a critical molecule that induces not only increased LPS susceptibility, but also a damaging cycle involving TLR4 and STAT3 signaling pathways.
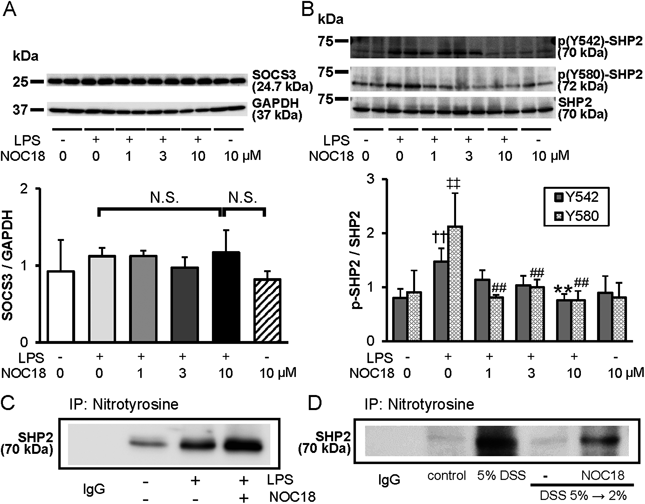
NOC18 Increases Nitration of a Tyrosine Residue in SHP2We speculated that NO generated from NOC18 under low-dose LPS stimulation did not directly enhance crosstalk between TLR4 and STAT3 signaling pathways, but instead modified their negative regulators. Therefore, we examined whether NO regulated the function of two signaling molecules, suppressor of cytokine signaling (SOCS) family member SOCS3 and protein tyrosine phosphatase (PTP) family member SHP2 in LPS-stimulated RAW264.7 cells.
SOCS3 acts as a negative regulator by downregulating STAT3 activity.20) In mice with DSS-induced colitis, SOCS3 expression regulates STAT3 phosphorylation.21) SOCS3 protein levels in RAW264.7 cells did not change after addition of LPS with or without NOC18 (Fig. 6A). These results suggested that SOCS3 expression was unaltered by stimulation with 3 ng/mL LPS with or without 10 µmol/L NOC18 in RAW264.7 cells.
Protein tyrosine phosphatase SHP2 is phosphorylated at the intracellular domain of gp130 and suppresses p-STAT3 activity through its dephosphorylation.22) To investigate involvement of NO in SHP2 phosphorylation, we examined the levels of phosphorylated SHP2 (p-SHP2) and total SHP2 protein in LPS-treated RAW264.7 cells. NOC18 suppressed the increase in SHP2 phosphorylation caused by low-dose LPS stimulation (Fig. 6B). NOC18 itself did not change the ratio of p-SHP2 to SHP2. Next, we performed immunoprecipitation to examine the cause of the decrease in SHP2 levels. LPS stimulation induced nitration of SHP2 protein in RAW264.7 cells, although a faint band of nitrated SHP2 was also observed without LPS treatment (Fig. 6C). Interestingly, with NOC18 addition, we observed strong SHP2 nitration compared with that in cells treated with LPS only. There was no SHP2 band in control IgG staining. Furthermore, in colons from mice with DSS-induced colitis, the amount of SHP2 protein immunoprecipitated with the anti-nitrotyrosine antibody was greater than in those from control or DSS 5→2% groups (Fig. 6D). Similar to the results of cell culture experiments, NOC18 treatment increased SHP2 nitration in mouse colons. These results suggested that, during low-dose LPS stimulation, NO induced nitration of SHP2 tyrosine residues, which functionally inactivated SHP2 in cells and DSS-treated mice. Subsequently, continuous STAT3 activation and CD14 expression triggered a damaging cycle between TLR4 and STAT3 signaling pathways.
DISCUSSION
In this study, we found that NO potentiated the CD14-TLR4-NF-κB axis through continuous STAT3 activation by SHP2 nitration in both mice treated with DSS and cells treated with low-dose LPS. The effects of NO on the development of ulcerative colitis have been debated. In our study, to avoid severe symptoms and clearly understand the effects of NO on DSS-induced colitis, we switched the DSS concentration from 5 to 2% on day 4 of DSS exposure. Under these conditions, NO derived from the slow release NO reagent NOC18 worsened the symptoms of DSS-induced colitis (Fig. S1), as we described previously.13) This effect was consistent with the results of cell-based experiments using LPS with NOC18 (Figs. S2 and 2). However, Salas et al reported that NO (NOC18, 1 mg/kg/d) improves colitis symptoms on day 10 of disease induction in a mouse model treated with NOC18 and 5% DSS.7) In the same study, lower doses of NOC18 had no therapeutic effects. Although the reasons for the differences in these findings are unclear, the timing, volume, and period of NOC18 administration are among the factors that potentially influenced the colitis pathology.
Addition of NO induced CD14 expression in 5→2% DSS-treated mice and low-dose LPS-stimulated RAW264.7 cells (Figs. 1–3). Levels of NF-κB (p65) protein were increased in the mouse13) and cell (Fig. 3) models. However, although TLR4/MD2 expression was also increased by NOC18 in 5→2% DSS-treated mice (Fig. 1C), the levels of TLR4 protein and mRNA were unaffected by NOC18 in LPS-treated RAW264.7 cells (Figs. 3 and S3). We hypothesized that NO released from NOC18 activated CD14-TLR4-NF-κB signaling without affecting TLR4 expression in RAW264.7 cells. These results were consistent with previous reports. For example, Wang et al. reported that the levels of inflammatory mediators, such as CD14, TNF-α, and IL-6, but not TLR4, were increased in RAW264.7 cells stimulated with 1 µg/mL LPS.23) Jacobs and Ignarro also reported that simultaneous treatment with LPS and the NO donor diethylamine NONOate activates NF-κB expression in RAW264.7 cells.24) Thus, the TLR4-NF-κB axis in RAW264.7 cells is sufficiently activated by stimulation with LPS and NOC18, although without any changes in TLR4 protein expression. Differences in TLR4 expression of 5→2% DSS-treated mice and low-dose LPS-treated RAW264.7 cells (Figs. 1, 3) might be caused by cell type differences. CD14 is mainly expressed in macrophages, while TLR4 is expressed in both macrophages and epithelial cells.25) Accumulation of macrophages and/or enhancement of inflammatory events in the epithelium might contribute to increased TLR4 levels in the colonic mucosa of mice with DSS-induced colitis.
We did not confirm colocalization of CD14 and nitrotyrosine in macrophages migrating into the colon tissue of NOC18 plus 5→2% DSS-treated mice. With respect to CD14, the location of CD14 protein expression in colon tissue of mice treated with 2% DSS and NOC18 appeared to be similar to that in colon tissue of mice treated with 5% DSS based on the results shown in Fig. 1C. Because CD14-positive cells were localized in both the epithelium and lamina propria, most of these cells would be macrophages migrating into the colon tissue. With respect to nitration, we showed that NOC18 administration increased iNOS protein expression of RAW264.7 cells treated with low-dose LPS (Fig. 3C) and SHP2 nitration of colon tissue in mice treated with 2% DSS (Fig. 6D). Taken together, these data suggest that activation of inflammatory signaling pathways, including CD14 and nitrotyrosine, after NOC18 administration mainly occurs in macrophages migrating into the colon tissue of mice treated with DSS.
Three inhibitors of TLR4, NF-κB, and STAT3 suppressed activation of the CD14-TLR4-NF-κB axis induced by LPS with NO. STAT3 has been shown to upregulate CD14 expression.19,20) Negatively regulating signaling molecules of STAT3 phosphorylation in LPS-stimulated RAW264.7 cells include the SOCS family member SOCS3 and PTP family member, SHP-2. Cytokine-inducible SH2-containing protein 3/SOCS3 mRNA expression is upregulated in neutrophils stimulated by LPS through mRNA stabilization.26) However, in our experiments, low concentrations of LPS with NO from NOC18 did not affect SOCS3 expression (Fig. 6A). Although the reasons for these different findings are unclear, the timing of SOCS3 expression might be a factor. In support of this notion, Suzuki et al. reported that, in mice with DSS-induced colitis, p-STAT3 levels are transiently increased and then SOCS3 is upregulated.21)
SHP2 regulates the STAT3 signaling pathway by tyrosine dephosphorylation catalyzed by its phosphatase activity.27,28) Low-dose LPS stimulation increased p-SHP2 levels in RAW264.7 cells (Fig. 6B). At this time, the levels of p-STAT3, CD14, iNOS, IL-6, and NF-κB proteins were unchanged (Figs. 3–5 and S4). However, addition of NO decreased SHP2 phosphorylation (Fig. 6B) and significantly activated signaling molecules such as p-STAT3 and CD14 (Figs. 3–5 and S4). In addition, NO increased nitrotyrosine levels in SHP2 in both LPS-stimulated cells and DSS-treated mice (Figs. 6C, D). Coulombe et al. reported that epithelial SHP2 deletion causes dysregulation of signaling pathways, such as upregulation of the STAT3 pathway, and colitis formation.29) In addition, SHP2 activation by embelin decreases colitis-associated tumorigenesis through inactivation of STAT3.30) These findings strongly indicate that activation of the STAT3 pathway by functional inhibition of SHP2 is required to develop colitis. In this study, we used anti-pY542-SHP2 and anti-pY580-SHP2 antibodies to detect the levels of SHP2 phosphorylation (Fig. 6B). Nitration of tyrosine residue(s) prevents further phosphorylation, and Y542 and Y580 are candidate nitration sites in SHP2. However, NO induces both nitration and S-nitrosylation. NO regulates microglial cell proliferation through S-nitrosylation of STAT3 (C259) and inhibition of STAT3 (Y705) phosphorylation.31) Discrepancies among these findings might have arisen from differences in the low-dose of LPS, reagents used for STAT3 stimulation, and cell lines.
Our study had a number of limitations. Kelleher et al. reported that NO derived from iNOS negatively regulates the NF-κB pathway in RAW264.7 cells at 8 h after 500 ng/mL LPS and cytokine stimulation by decreasing the DNA binding activity of NF-κB through S-nitrosylation.32,33) Although we did not determine S-nitrosylated protein contents in this study, differences in stimulation doses and timing might have contributed to variations in the effects of NO on the onset and development of ulcerative colitis.
CONCLUSION
NO is involved in STAT3 phosphorylation through SHP2 nitration, triggering subsequent signaling pathways in macrophages. Our results indicate that NO is a critical molecule that enhances the pathogenesis and symptoms of DSS-induced colitis in mice through its nitrating modification.
Acknowledgments
We appreciate the technical support provided by the Research Support Center, Graduate School of Medical Sciences, Kyushu University. This work was supported by the Japan Society for the Promotion of Science (Grant numbers 16H01363 to K-I. Y. and 25460037 to K.Y.), Japan Science and Technology Agency (PRESTO to K-I. Y. and Grant number AS262Z01377Q to K.Y.), Japan Agency for Medical Research and Development (the Platform Project for Supporting Drug Discovery and Life Science Research to K-I. Y.), Robert T. Huang Entrepreneurship Center (QREC) of Kyushu University (to X.T.), and a Research Grant from the Daiichi University of Pharmacy (to K.Y.).
Conflict of Interest
The authors declare no conflict of interest.
Supplementary Materials
The online version of this article contains supplementary materials.
REFERENCES
- 1) Hindryckx P, Jairath V, D’Haens G. Acute severe ulcerative colitis: from pathophysiology to clinical management. Nat. Rev. Gastroenterol. Hepatol., 13, 654–664 (2016).
- 2) Zisman TL, Rubin DT. Colorectal cancer and dysplasia in inflammatory bowel disease. World J. Gastroenterol., 14, 2662–2669 (2008).
- 3) Danese S, Fiocchi C. Ulcerative colitis. N. Engl. J. Med., 365, 1713–1725 (2011).
- 4) Nakanishi Y, Sato T, Ohteki T. Commensal Gram-positive bacteria initiates colitis by inducing monocyte/macrophage mobilization. Mucosal Immunol., 8, 152–160 (2015).
- 5) Guo S, Nighot M, Al-Sadi R, Alhmoud T, Nighot P, Ma TY. Lipopolysaccharide regulation of intestinal tight junction permeability is mediated by TLR4 signal transduction pathway activation of FAK and MyD88. J. Immunol., 195, 4999–5010 (2015).
- 6) Salim T, Sershen CL, May EE. Investigating the role of TNF-alpha and IFN-gamma activation on the dynamics of iNOS gene expression in LPS stimulated macrophages. PLOS ONE, 11, e0153289 (2016).
- 7) Salas A, Gironella M, Salas A, Soriano A, Sans M, Iovanna J, Piqué, JM, Panés J. Nitric oxide supplementation ameliorates dextran sulfate sodium-induced colitis in mice. Lab. Invest., 82, 597–608 (2002).
- 8) Hokari R, Kato S, Matsuzaki K, Kuroki M, Iwai A, Kawaguchi A, Nagao S, Miyahara T, Itoh K, Sekizuka E, Nagata H, Ishii H, Miura S. Reduced sensitivity of inducible nitric oxide synthase-deficient mice to chronic colitis. Free Radic. Biol. Med., 31, 153–163 (2001).
- 9) Rumi G, Tsubouchi R, Nishio H, Kato S, Mozsik G, Takeuchi K. Dual role of endogenous nitric oxide in development of dextran sodium sulfate-induced colitis in rats. J. Physiol. Pharmacol., 55, 823–836 (2004).
- 10) Keshavarzian A, Banan A, Farhadi A, Komanduri S, Mutlu E, Zhang Y, Fields JZ. Increases in free radicals and cytoskeletal protein oxidation and nitration in the colon of patients with inflammatory bowel disease. Gut, 52, 720–728 (2003).
- 11) Kimura H, Hokari R, Miura S, Shigematsu T, Hirokawa M, Akiba Y, Kurose I, Higuchi H, Fujimori H, Tsuzuki Y, Serizawa H, Ishii H. Increased expression of an inducible isoform of nitric oxide synthase and the formation of peroxynitrite in colonic mucosa of patients with active ulcerative colitis. Gut, 42, 180–187 (1998).
- 12) Rachmilewitz D, Stamler JS, Bachwich D, Karmeli F, Ackerman Z, Podolsky DK. Enhanced colonic nitric oxide generation and nitric oxide synthase activity in ulcerative colitis and Crohn’s disease. Gut, 36, 718–723 (1995).
- 13) Tun X, Yasukawa K, Yamada K. Involvement of nitric oxide with activation of Toll-like receptor 4 signaling in mice with dextran sodium sulfate-induced colitis. Free Radic. Biol. Med., 74, 108–117 (2014).
- 14) Lahde M, Korhonen R, Moilanen E. Regulation of nitric oxide production in cultured human T84 intestinal epithelial cells by nuclear factor-kappa B-dependent induction of inducible nitric oxide synthase after exposure to bacterial endotoxin. Aliment. Pharmacol. Ther., 14, 945–954 (2000).
- 15) Schneider CA, Rasband WS, Eliceiri KW. NIH Image to ImageJ: 25 years of image analysis. Nat. Methods, 9, 671–675 (2012).
- 16) Lysakova-Devine T, Keogh B, Harrington B, Nagpal K, Halle A, Golenbock DT, Monie T, Bowie AG. Viral inhibitory peptide of TLR4, a peptide derived from vaccinia protein A46, specifically inhibits TLR4 by directly targeting MyD88 adaptor-like and TRIF-related adaptor molecule. J. Immunol., 185, 4261–4271 (2010).
- 17) Rhee JW, Lee KW, Sohn WJ, Lee Y, Jeon OH, Kwon HJ, Kim DS. Regulation of matrix metalloproteinase-9 gene expression and cell migration by NF-kappa B in response to CpG-oligodeoxynucleotides in RAW 264.7 cells. Mol. Immunol., 44, 1393–1400 (2007).
- 18) Siddiquee K, Zhang S, Guida WC, Blaskovich MA, Greedy B, Lawrence HR, Yip ML, Jove R, McLaughlin MM, Lawrence NJ, Sebti SM, Turkson J. Selective chemical probe inhibitor of Stat3, identified through structure-based virtual screening, induces antitumor activity. Proc. Natl. Acad. Sci. U.S.A., 104, 7391–7396 (2007).
- 19) Imajo K, Fujita K, Yoneda M, Nozaki Y, Ogawa Y, Shinohara Y, Kato S, Mawatari H, Shibata W, Kitani H, Ikejima K, Kirikoshi H, Nakajima N, Saito S, Maeyama S, Watanabe S, Wada K, Nakajima A. Hyperresponsivity to low-dose endotoxin during progression to nonalcoholic steatohepatitis is regulated by leptin-mediated signaling. Cell Metab., 16, 44–54 (2012).
- 20) Yang J, Huang J, Dasgupta M, Sears N, Miyagi M, Wang B, Chance MR, Chen X, Du Y, Wang Y, An L, Wang Q, Lu T, Zhang X, Wang Z, Stark GR. Reversible methylation of promoter-bound STAT3 by histone-modifying enzymes. Proc. Natl. Acad. Sci. U.S.A., 107, 21499–21504 (2010).
- 21) Suzuki A, Hanada T, Mitsuyama K, Yoshida T, Kamizono S, Hoshino T, Kubo M, Yamashita A, Okabe M, Takeda K, Akira S, Matsumoto S, Toyonaga A, Sata M, Yoshimura A. CIS3/SOCS3/SSI3 plays a negative regulatory role in STAT3 activation and intestinal inflammation. J. Exp. Med., 193, 471–481 (2001).
- 22) Ohtani T, Ishihara K, Atsumi T, Nishida K, Kaneko Y, Miyata T, Itoh S, Narimatsu M, Maeda H, Fukada T, Itoh M, Okano H, Hibi M, Hirano T. Dissection of signaling cascades through gp130 in vivo: reciprocal roles for STAT3- and SHP2-mediated signals in immune responses. Immunity, 12, 95–105 (2000).
- 23) Wang JX, Hou LF, Yang Y, Tang W, Li Y, Zuo JP. SM905, an artemisinin derivative, inhibited NO and pro-inflammatory cytokine production by suppressing MAPK and NF-kappaB pathways in RAW 264.7 macrophages. Acta Pharmacol. Sin., 30, 1428–1435 (2009).
- 24) Jacobs AT, Ignarro LJ. Nuclear factor-kappa B and mitogen-activated protein kinases mediate nitric oxide-enhanced transcriptional expression of interferon-beta. J. Biol. Chem., 278, 8018–8027 (2003).
- 25) Abreu MT. Toll-like receptor signalling in the intestinal epithelium: how bacterial recognition shapes intestinal function. Nat. Rev. Immunol., 10, 131–144 (2010).
- 26) Cassatella MA, Gasperini S, Bovolenta C, Calzetti F, Vollebregt M, Scapini P, Marchi M, Suzuki R, Suzuki A, Yoshimura A. Interleukin-10 (IL-10) selectively enhances CIS3/SOCS3 mRNA expression in human neutrophils: evidence for an IL-10-induced pathway that is independent of STAT protein activation. Blood, 94, 2880–2889 (1999).
- 27) Wang TC, Goldenring JR. Inflammation intersection: gp130 balances gut irritation and stomach cancer. Nat. Med., 8, 1080–1082 (2002).
- 28) Neel BG, Gu H, Pao L. The 'Shp’ing news: SH2 domain-containing tyrosine phosphatases in cell signaling. Trends Biochem. Sci., 28, 284–293 (2003).
- 29) Coulombe G, Leblanc C, Cagnol S, Maloum F, Lemieux E, Perreault N, Feng GS, Boudreau F, Rivard N. Epithelial tyrosine phosphatase SHP-2 protects against intestinal inflammation in mice. Mol. Cell. Biol., 33, 2275–2284 (2013).
- 30) Dai Y, Jiao H, Teng G, Wang W, Zhang R, Wang Y, Hebbard L, George J, Qiao L. Embelin reduces colitis-associated tumorigenesis through limiting IL-6/STAT3 signaling. Mol. Cancer Ther., 13, 1206–1216 (2014).
- 31) Kim J, Won JS, Singh AK, Sharma AK, Singh I. STAT3 regulation by S-nitrosylation: implication for inflammatory disease. Antioxid. Redox Signal., 20, 2514–2527 (2014).
- 32) Nishida M, Ogushi M, Suda R, Toyotaka M, Saiki S, Kitajima N, Nakaya M, Kim KM, Ide T, Sato Y, Inoue K, Kurose H. Heterologous down-regulation of angiotensin type 1 receptors by purinergic P2Y2 receptor stimulation through S-nitrosylation of NF-κB. Proc. Natl. Acad. Sci. U.S.A., 108, 6662–6667 (2011).
- 33) Kelleher ZT, Matsumoto A, Stamler JS, Marshall HE. NOS2 regulation of NF-kappaB by S-nitrosylation of p65. J. Biol. Chem., 282, 30667–30672 (2007).