Abstract
Acquired resistance to sunitinib is a challenge in the treatment of renal cell carcinoma (RCC). The dysregulation of cellular metabolism is prevalent during resistance acquisition. It is known that in sunitinib-resistant RCC 786-O (786-O Res) cells sunitinib is mainly sequestered in the intracellular lysosomes. However, the relevance between sunitinib resistance and cellular metabolism has not been examined. In this study, we examined the metabolic changes in 786-O Res by using capillary electrophoresis-time of flight mass spectrometry. The cell line 786-O Res was established via persistent treatment with sunitinib, where increase in intracellular sunitinib, and sizes of lysosomes and nuclei were enhanced as compared with those in the parental 786-O (786-O Par) cells. Metabolic analyses revealed that out of the 110 metabolites examined, 13 were up-regulated and 4 were down-regulated in the 786-O Res cells. The glycolysis, tricarboxylic acid cycle and pentose phosphate pathway (PPP) were identified as being altered in the sunitinib-resistant cells, which resulted in the enhanced metabolisms of energy, nucleic acids, and glutathione redox cycle. As sunitinib was sequestered in the enlarged lysosomes in 786-O Res, the enriched energy metabolism might contribute to the maintenance of luminal pH in lysosomes via the H+ ATPase. The changes in the PPP could contribute to nuclei enlargement through up-regulation of nucleic acid biosynthesis and protect 786-O Res from cytotoxicity induced by sunitinib through up-regulation of reduced glutathione. Though the direct link between sunitinib resistance and metabolic alternation remains to be elucidated, this metabolomics study provides fundamental insights into acquisition of sunitinib resistance.
Renal cell carcinoma (RCC) is one of the most aggressive tumor types and often responds poorly to chemotherapy.1) The poor efficacy of chemotherapy has been largely attributed to acquired drug resistance caused by the up-regulated P-glycoprotein (P-gp), an efflux pump that can expel chemotherapeutic drugs from cancer cells. Currently, several small-molecular agents that inhibit proangiogenic receptor tyrosine kinases (RTKs), such as sunitinib and sorafenib, inhibit proangiogenic RTKs and are being used in the treatment of RCC.2) However, despite initial efficacy, these agents are only moderately effective in patients who rapidly develop drug resistance. Thus, the discovery of new agents that target the resistance mechanisms is necessary for effective RCC treatment.3)
Metabolomics is a relatively new discipline that measures the concentrations of a wide variety of metabolites in biological specimens allowing for real-time quantification of changes in cellular metabolism.4) Previous studies have shown that several metabolic changes take place in the cell during the acquisition of drug resistance.5,6) Recent advances in both instrumental and computational metabolomic technologies have enabled metabolite profiling studies by NMR spectroscopy,7) GC-MS,8,9) LC-MS,10) and capillary electrophoresis-time of flight (CE-TOF)MS.11–13) As most of the primary metabolites are polar compounds, CE-TOFMS is suitable for separating them from their principle and the superior separation performance is shown by a high theoretical plate number.14) Even structural isomers (e.g. leucine and isoleucine; glucose-1-phosphate, glucose-6-phosphate and fluctose-6-phosphate, etc.) that are usually difficult to separate and have slightly different ionic radii, can be separated by CE-TOFMS.
However, the relevance between sunitinib resistance and cellular metabolism has not been fully elucidated. In this study, we comprehensively analyzed the metabolic changes in sunitinib-resistant RCC 786-O cells using CE-TOFMS and attempted to describe the phenotypical changes during acquired resistance to sunitinib in 786-O cells by the altered metabolic status.
MATERIALS AND METHODS
Cell Culture and Establishment of Sunitinib-Resistant CellsHuman RCC 786-O cells were acquired from the American Type Culture Collection (ATC C, Manassas, VA, U.S.A.). Cells were cultured in Dulbecco’s modified Eagle’s medium (DMEM; Wako, Osaka, Japan) containing 10% fetal bovine serum (FBS), 1.0 unit/mL penicillin, and 2.0 mg/mL streptomycin (Gibco BRL, Grand Island, NY, U.S.A.) in 5% CO2 at 37°C. Sunitinib-resistant 786-O (786-O Res) cells were generated via prolonged exposure to 10 µM sunitinib, and subcultured every 3–4 d for >20 passages as previously described.15,16)
3-(4,5-Dimethylthiazol-2-yl)-2,5-diphenyltetrazolium Bromide (MTT) AssayCells were seeded in 96-well plates at approximately 3×10³ cells/100 µL/well. After 24 h, 100 µL of sunitinib-containing medium was added to each well. Cells were further incubated for 48 h, and 100 µL of 3-(4,5-dimetylthiazol-2-yl)-2,5-diphenyltetrazolium bromide (MTT; DOJINDO, Kumamoto, Japan) solution (0.25 mg/mL) was added to each well, prior to further incubation for 1 h at 37°C. The MTT-containing medium was removed, and 100 µL of dimethyl sulfoxide (DMSO) was added to each well to solubilize the MTT-formazan product. Absorbance was measured at 540 nm and 650 nm (for reference) using a microplate reader (SpectraMax i3, Molecular Devices, Sunnyvale, CA, U.S.A.). The IC50 and 95% confidence intervals (CI) were calculated via curve fitting using the GraphPad Prism 5 (GraphPad Software, San Diego, CA, U.S.A.).
RNA Isolation and Quantitative (q)RT-PCRRNA was isolated from cultured cells using RNAzol (Molecular Research Center, Cincinnati, OH, U.S.A.) according to the manufacturer’s protocol. RNA quality and quantity were assessed using a NanoDrop One (Thermo Fisher Scientific, Wilmington, DE, U.S.A.). cDNA was synthesized from 1000 ng of RNA by using a ReverTra Ace qPCR RT Master Mix (TOYOBO, Osaka, Japan) following the manufacturer’s instructions. Analysis of mRNA expression in the cells was performed using a StepOne Real Time PCR System (Applied Biosystems, Foster City, CA, U.S.A.) with THUNDERBIRD SYBR qPCR Mix (TOYOBO). Each PCR cycle consisted of 5 s of denaturation at 95°C and 31 s of annealing and extension at 60°C (40 cycles). The amount of target gene in the cells was calculated using the ΔΔCt method, normalized according to glyceraldehyde-3-phosphate dehydrogenase (GAPDH) mRNA. Primers used in qRT-PCR were as follows: TFEB (forward) 5′-aaggtgcagtcctacctgga-3′ and (reverse) 5′-gtctttcttctgccgctcct-3′, GAPDH (forward) 5′-ccaacgtgtcagtggtggac-3′ and (reverse) 5′-cagcgtcaaaggtgtggaggag-3′.
Metabolite ExtractionIntact metabolism of parental 786-O (786-O Par) and 786-O Res were examined by CE-TOFMS. Ionic metabolites were extracted from approximately 2–3 ×10⁶ 786-O Res cells which were exposed to sunitinib at 10 mM for 5 d prior to extraction. Exact cell numbers in each sample were counted for normalization of constituent metabolites. The cells were washed twice with 5% mannitol and detached using trypsin-ethylenediaminetetraacetic acid (EDTA). The cell pellets were resuspended in 1 mL of methanol containing 0.1% (v/v) internal standard solution 1 (Human Metabolome Technologies (HMT), Tsuruoka, Japan). The suspended cells were then lysed by sonication for 30 s using a sonicator (Handy Sonic UR-20P, TOMY, Japan) and vortexed in a solution of 1 mL chloroform and 0.4 mL ultra-pure water for 30 s. Following centrifugation at 2300×g for 5 min at 4°C, the aqueous layers were filtered through an UltrafreeMC-PLHCC 5-kDa cutoff filter (HMT), and further centrifuged at 9100×g for 2.5 h at 4°C to remove proteins and phospholipids. The resulting filtrate was lyophilized and mixed with 25 µL ultra-pure water containing 0.25% (v/v) internal standard solution 3 (HMT) prior to CE-TOFMS analysis.
CE-TOFMS Quantification of Ionic MetabolitesCE-TOFMS was performed using an Agilent 7100 CE system equipped with Agilent 6230 TOFMS system, Agilent isocratic 1260 pump, Agilent 1260 degasser for sheath flow, an Agilent G1603A CE-MS adaptor kit, and an Agilent G1607A CE-electrospray ionization (ESI)-MS sprayer kit (Agilent Technologies, Palo Alto, CA, U.S.A.). The system was controlled using MassHunter software (Data Acquisition, Method Editor and Worklist Editor, Agilent). Metabolites were analyzed using a fused silica capillary (50 µm internal diameter ×80 cm length) with commercial electrophoresis buffer (H3301-2021 for cation analysis and H3302-2021 for anion analysis, HMT). The samples were injected at a pressure of 50 mbar for 10 s (approximately 10 nL) for cation analysis, and 50 mbar for 25 s (approximately 25 nL) for anion analysis. The applied voltage was set to 27 and 30 kV for cation and anion analyses, respectively. The spectrometer was set to scan a range of 50 m/z to 1000 m/z.
Data ProcessingThe CE-TOFMS results were processed using MassHunter software (Quantitative analysis, Agilent). Signal peaks corresponding to isotopomers, adduct ions, and other product ions of known metabolites were excluded, and the remaining peaks were annotated to include putative metabolites from the HMT metabolite database based on migration time (MT) and m/z value. The tolerance range for peak annotation was set to ±0.5 min for MT and ±10 ppm for m/z. A calibration curve was drawn for each metabolite and the concentration of the metabolite in the sample was calculated from the peak area. Peak areas were normalized to those of the internal standards and the resultant relative area values were normalized by cell count of each sample. According to a previous report, metabolite contents were finally expressed as nmol per unit cell (1.0×10⁶ cells).11,17)
Metabolomics AnalysisPrincipal component analyses (PCA) were carried out using R statistical software. Fold change and p-values for the metabolites in the 786-O Res cells were calculated relative to those in the 786-O Par cells. Metabolites with a fold change greater than 3 and p-value less than 0.05 were considered as significantly different and were subjected to identification of enriched metabolic pathways using the Metabolite Set Enrichment Analysis (MSEA) (http://www.msea.ca).18)
Quantification of Intracellular Sunitinib LevelsThe 786-O Par and 786-O Res cells were cultured with sunitinib at a concentration equal to IC50 for 24 h. After harvesting, the cells were lysed using lysis buffer (50 mM Tris–HCl, 10 mM β-glycerophosphate, 150 mM NaCl, 1 mM EDTA, 1 mM Na3VO4, 1% Triton X-100, 1% protease inhibitor cocktail, 1 mM phenylmethylsulfonyl fluoride (PMSF)) and centrifuged at 20000×g for 20 min at 4°C. Sunitinib fluorescence in supernatant (Ex 480 nm, Em 520 nm) was measured using a microplate reader (SpectraMax i3). Protein concentrations were determined using a DC Protein Assay Kit (Bio-Rad).
Intracellular Lysosome and Nucleus VisualizationTo determine the area occupied by lysosomes and nuclei in the 786-O Par and 786-O Res cells, 786-O Par or Res cells (1×10⁵ cells/1 mL/dish) were seeded in 35-mm glass-bottom dishes (IWAKI, Chiba, Japan) for 24 h. Lysosomes and nuclei were stained with 50 nM Lysotracker Red DND-99 (Invitrogen, Carlsbad, CA, U.S.A.) and 0.5 µg/mL Hoechst 33258 (Polysciences, Warrington, PA, U.S.A.) for 10 min. The cells were washed with Hanks Basic Salt Solution (HBSS), and images of cells were captured using an LSM780 (Carl Zeiss, Jena, Germany) confocal laser scanning microscope (CLSM). The average area of lysosomal and nuclear a/cell in each image was calculated by normalizing lysosomal and nuclear pixel area to the number of nuclei in each image.
Statistical AnalysisAll pairwise comparisons of groups were performed using a two-tailed t-test, and the comparisons were considered as statistically significant when p<0.05.
RESULTS
Establishment of Sunitinib-Resistant 786-O Cells786-O Res cells were generated via persistent treatment of 786-O Par cells with 10 µM sunitinib. Cell viability is shown in Fig. 1a. The IC50 (95% CI) values of the 786-O Par and Res cells were 7.4 (7.0–7.7) and 13.1 (12.5–13.7) µM, respectively. The IC50 of the 786-O Res cells was approximately 2-fold higher than that of the 786-O Par cells, which is consistent with previous reports.19,20) Sunitinib levels in the 786-O Res cells were found to be three times higher than those in 786-O Par cells following incubation with 10 µM sunitinib, suggesting that the 786-O Res cells retain higher amounts of sunitinib than the 786-O Par cells, rather than expelling the sunitinib into the extracellular environment (Fig. 1b). The sizes of the acidic lysosomal compartments, as indicated by Lysotracker, were greater in the 786-O Res cells than those of lysosomes in the 786-O Par cells (Figs. 1c and d). Lysosomal stress has been reported to trigger lysosomal biogenesis through transcription factor EB (TFEB).21) Gene expression of TFEB was increased by 1.8-fold in 786-O Res cells compared to that in 786-O Par cells (Fig. 1e), which could support lysosomal expansion in 786-O Res cells. We also observed that the sizes of nuclei in 786-O Res cells were increased by 3-fold when compared to the nuclei in 786-O Par cells (Figs. 1c and d).
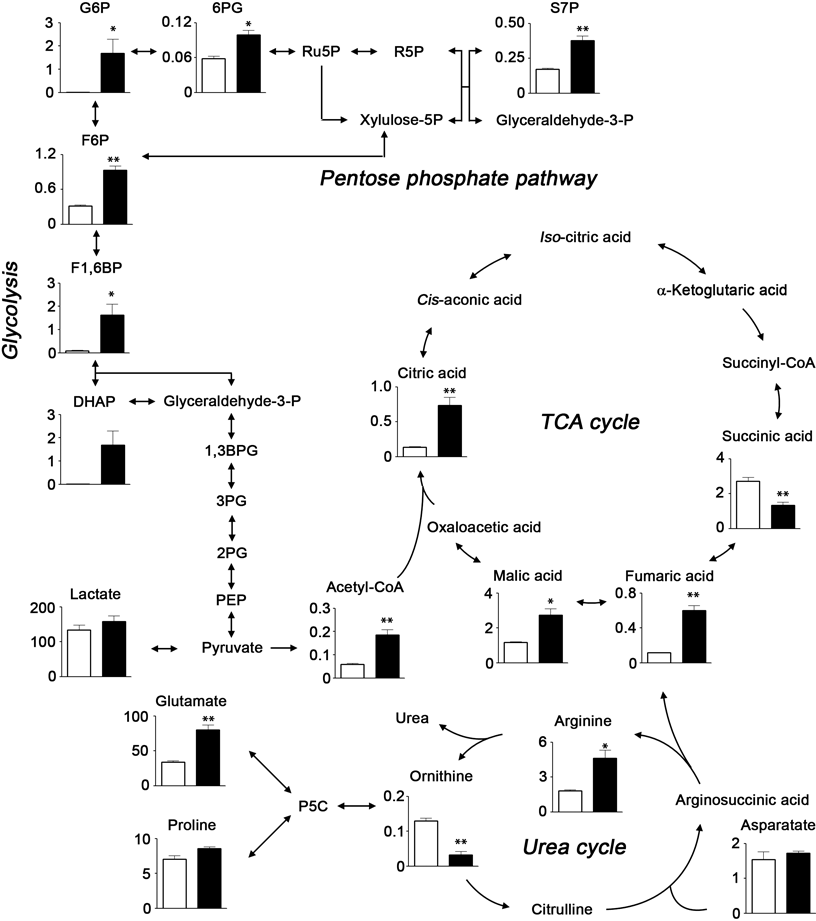
Enriched Metabolic Pathways in 786-O Res CellsWe examined the metabolic changes in the 786-O cells following the acquisition of resistance. The concentrations of 110 metabolites were quantified as shown in Table 1. Our PCA score plot showed a clear separation between the 786-O Par and 786-O Res cells for the first (PC1, 89.3%) and second principal components (PC2, 15.8%; Fig. 2a). These results indicated that persistent exposure to sunitinib causes notable changes in the metabolism of 786-O Res cells. We identified 13 up-regulated and 4 down-regulated metabolites in the 786-O Res cells (p<0.05, fold change >3; Fig. 2b) and analyzed the affected pathways in the 786-O Res using Metabolite Set Enrichment Analysis (MSEA) (Fig. 2c). The top ranked pathways altered by sunitinib-resistance in the 786-O Res cells included the glycolytic pathway and the mitochondrial tricarboxylic acid (TCA) cycle, as well as pathways involved in urea, arginine, and proline metabolism (Fig. 3). Glycolysis is an essential process by which cancer cells generate the energy required to support rapid cell division and cancer progression. As most of the metabolites that were found to be up-regulated in the 786-O Res cells were involved in glycolysis and the TCA cycle, the activation of energy-generating pathways may play an important role in the acquisition of sunitinib resistance.
Table 1. Metabolites in 786-O Par and 786-O Res Cells
| Metabolite (nnol/106 cells) | 786-O Par | 786-O Res | Fold change (Log 2) | p-Value (−Log 10) |
|---|
| Dihydroxyacetone phosphate | 0.014 | 6.920 | 6.92 | 1.24 |
| F1,6P | 0.093 | 1.620 | 4.13 | 1.34 |
| Choline | 0.425 | 3.356 | 2.98 | 1.66 |
| Cys | 0.270 | 1.862 | 2.79 | 2.66 |
| Met | 0.143 | 0.960 | 2.75 | 2.19 |
| Hydroxyproline | 0.010 | 0.062 | 2.61 | 0.61 |
| Thymidine | 0.150 | 0.814 | 2.44 | 1.49 |
| Citric acid | 0.137 | 0.736 | 2.42 | 1.70 |
| Glycerophosphorate | 0.253 | 1.306 | 2.37 | 1.48 |
| Fumaric acid | 0.117 | 0.599 | 2.36 | 2.10 |
| G6P | 0.688 | 2.909 | 2.08 | 2.40 |
| Trp | 0.074 | 0.302 | 2.02 | 2.03 |
| ADP | 0.892 | 3.205 | 1.84 | 1.71 |
| Creatine | 3.111 | 10.212 | 1.71 | 2.71 |
| Acetyl-CoA | 0.059 | 0.185 | 1.64 | 1.80 |
| F6P | 0.314 | 0.929 | 1.56 | 2.14 |
| 3-Hydroxybutyric acid | 0.114 | 0.316 | 1.47 | 1.28 |
| ATP | 5.683 | 15.682 | 1.46 | 2.05 |
| GTP | 1.273 | 3.262 | 1.36 | 1.92 |
| Arg | 1.825 | 4.610 | 1.34 | 1.43 |
| GSH | 9.844 | 24.805 | 1.33 | 2.11 |
| CMP | 0.218 | 0.546 | 1.32 | 1.92 |
| Lys | 1.603 | 3.904 | 1.28 | 1.52 |
| Glu | 34.009 | 80.204 | 1.24 | 1.86 |
| Malic acid | 1.164 | 2.741 | 1.24 | 1.59 |
| CTP | 0.232 | 0.527 | 1.18 | 1.44 |
| His | 0.375 | 0.849 | 1.18 | 1.77 |
| UTP | 1.626 | 3.630 | 1.16 | 2.03 |
| S7P | 0.172 | 0.378 | 1.14 | 1.72 |
| GDP | 0.291 | 0.636 | 1.13 | 1.90 |
| Gly | 6.078 | 13.234 | 1.12 | 1.72 |
| Tyr | 0.843 | 1.830 | 1.12 | 1.81 |
| Val | 1.627 | 3.191 | 0.97 | 1.80 |
| Ile | 1.165 | 2.257 | 0.95 | 1.61 |
| Phe | 0.816 | 1.574 | 0.95 | 1.64 |
| Homoserine | 1.945 | 3.746 | 0.95 | 1.94 |
| Gln | 1.048 | 2.005 | 0.94 | 1.38 |
| NAD | 0.984 | 1.803 | 0.87 | 1.58 |
| NADP | 0.053 | 0.091 | 0.78 | 0.99 |
| 6PG | 0.058 | 0.099 | 0.77 | 1.46 |
| CDP | 0.055 | 0.089 | 0.68 | 1.08 |
| UDP | 0.861 | 1.282 | 0.57 | 1.43 |
| Hypoxinthine | 0.458 | 0.556 | 0.28 | 0.52 |
| Pro | 7.049 | 8.555 | 0.28 | 1.29 |
| Lactic acid | 133.759 | 158.113 | 0.24 | 0.88 |
| Asp | 1.540 | 1.720 | 0.16 | 0.70 |
| IMP | 0.383 | 0.423 | 0.14 | 0.83 |
| Cytidine | 0.068 | 0.068 | 0.00 | 0.30 |
| GMP | 0.455 | 0.432 | −0.07 | 0.45 |
| Inosine | 0.152 | 0.138 | −0.14 | 0.43 |
| Ser | 1.133 | 1.016 | −0.16 | 0.72 |
| UMP | 0.821 | 0.728 | −0.17 | 0.73 |
| GABA | 0.301 | 0.244 | −0.30 | 1.02 |
| Gluconic acid | 0.218 | 0.174 | −0.32 | 0.52 |
| AMP | 2.244 | 1.769 | −0.34 | 1.28 |
| Asn | 0.521 | 0.386 | −0.43 | 1.54 |
| S-Adenosylmethionine | 0.233 | 0.119 | −0.97 | 1.72 |
| Succinic acid | 2.718 | 1.325 | −1.04 | 3.02 |
| Guanocine | 0.048 | 0.020 | −1.26 | 0.83 |
| b-Ala | 4.998 | 1.772 | −1.50 | 1.93 |
| GSSG | 3.188 | 0.827 | −1.95 | 2.22 |
| Ornithine | 0.130 | 0.032 | −2.02 | 2.29 |
| Creatinine | 0.081 | 0.005 | −4.07 | 2.36 |
| Guanine | 0.094 | 0.001 | −6.78 | 2.27 |
| Glycolic acid | 1.226 | 0.000 | — | 1.50 |
Abbreviations: F1,6P, fructose 1,6-bisphosphate; G6P, glucose-6-phosphate; F6P, fructose-6-phosphate; GSH, reduced glutathione; CMP, cytidine monophosphate; CTP, cytidine triphosphate; UTP, uridine triphosphate; S7P, sedoheptulose-7-phosphate; GDP, guanosine diphosphate; NAD, nicotinamide adenine dinucleotide; 6PG, 6-phosphogluconate; CDP, cytidine diphosphate; UDP, uridine diphosphate; IMP, inosine monophosphate; UMP, uridine monophosphate; GABA, γ-aminobutyric acid; GSSG, oxidized glutathione.
Next, we examined the relationship between enhanced lysosomes and metabolic changes in the 786-O Res cells. One of the mechanisms of chemoresistance in cancer cells is the elimination of chemotherapeutic drugs from the cancerous cells via ATP-binding cassette (ABC) transporters, such as P-gp.22,23) However, 786-O Res cells retained higher amounts of sunitinib than the 786-O Par cells, rather than expelling the sunitinib into the extracellular environment (Fig. 1b). As reported previously, intracellular sunitinib is sequestered in the acidic lysosomal compartments, because sunitinib is a hydrophobic, weak base (pKa 8.95),19,20) which allows sunitinib to readily diffuse through cell membranes at physiological pH. Upon entry into lysosomes, the tertiary amine moiety of sunitinib undergoes protonation so that it gets entrapped in lysosomes.24) Thus, we hypothesized that the increased size of lysosomes accounted for the increased levels of intracellular sunitinib. The acidic luminal pH of the lysosome is maintained via the activity of the proton-pumping vacuolar type H+ ATPase (V-ATPase), which consumes ATP to pump protons into the lysosome’s lumen.25) Because metabolic pathways of glycolysis and TCA cycle in the 786-O Res cells were found to be up-regulated, we predicted that energy production was also increased. As we predicted, cellular energy identified as ATP/AMP ratio and adenosine energy charge26) were significantly higher in the 786-O Res cells than in the 786-O Par cells (Fig. 4a). It is possible that the up-regulation in energy metabolism contributed to the larger lysosomal compartments.
We also hypothesized that the increased size of nuclei in the 786-O Res cells (Figs. 1c and d) might require enhanced nucleic acid biosynthesis. Concurrent with the increased activity of the glycolytic pathway, the levels of several metabolites involved in the pentose phosphate pathway (PPP) were also found to be increased in the 786-O Res cells (Figs. 2c and 3) than in the 786-O Par cells. In addition, the metabolites involved in purine and pyrimidine metabolisms were also increased in 786-O Res cells than in 786-O Par cells (Fig. 4b). This enhanced PPP might assist the up-regulation of nucleic acid synthesis in the 786-O Res cells than in the 786-O Par cells. The PPP also acts as a metabolic redox sensor and regulates reduced glutathione (GSH) levels via reduced nicotinamide adenine dinucleotide phosphate (NADPH).27) As shown in Fig. 4c, an increase in GSH levels and the ratio of GSH to oxidized glutathione (GSSG) was observed in the 786-O Res cells compared to the 786-O Par cells. It has been reported that GSH plays a key role in the regulation of cytotoxic stress generated by anti-cancer drugs.28) Therefore, it is likely that the increased GSH levels protect the 786-O Res cells from the cytotoxic effect of sunitinib and the reactive oxygen species (ROS) generated by the mitochondrial electron transport chain in the tricarboxylic acid cycle (TCA cycle). Even though the direct link between the mechanism of resistance acquisition to sunitinib and metabolic feature in 786-O Res cells remains to be examined, metabolomic investigation could offer the key to an understanding of the phenotypical alternations acquired in resistant cancer cells.
DISCUSSION
Cellular metabolism is often dysregulated during the development and progression of cancer.29,30) However, the relevance between sunitinib resistance mechanism and cellular metabolism has not yet been investigated. In this study, we have examined the metabolic differences between RCC 786-O Par and Res cells using CE-TOFMS. 786-O cell is a well-characterized epithelial cell, derived from primary human clear cell adenocarcinoma (major type of RCC).31) Most types of RCC show either mutation or loss of the von Hippel–Lindau (VHL) gene, which regulates significant biological molecules such as angiogenic factor, vascular endothelial growth factor (VEGF)-A and also a growth factor, TGF-β. Because 786-O lacks VHL,32) it is often used appropriately as a representative RCC tumor cells to explore new targets for possible therapy.33) Our results show that the pathways related to glycolysis and the TCA cycle were enriched in the 786-O cells that had acquired resistance to sunitinib (Figs. 2b and 3).
Previous results indicated that sunitinib was sequestrated at high levels in the acidic lysosome compartments of the resistant 786-O cells.19,20) We also observed that intracellular sunitinib was increased in the 786-O Res cells compared to the 786-O Par cells (Fig. 1b). Confocal microscopic analyses of 786-O cells demonstrated that the sizes of lysosomes and nuclei were increased in the 786-O Res cells (Figs. 1c and d). While lipids were hardly detected by CE-TOFMS technique, intermediate metabolites in lipid biosynthesis such as dihydroxyacetone phosphate (DHAP), choline and acetyl-CoA were increased in 786-O Res cells (Table 1 and Fig. 3), hence suggesting that lipid biosynthesis was up-regulated in the sunitinib-resistant 786-O cells and might accelerate membrane construction in both enlarged nuclei and lysosomes. The activity of TFEB was up-regulated through its phosphorylation by the mammalian target of rapamycin complex 1 (mTORC1), which is activated by AKT pathway.34) In addition, lamin A, a major component of nuclear envelope is stabilized by AKT phosphorylation, which could alter nuclear size and morphology.35) Although further studies are required to determine the molecular mechanism of nuclear enlargement in sunitinib resistant 786-O cells, there is a possibility that AKT/lamin phosphorylation axis may be involved in the nuclear enlargement.
Due to enriched glycolysis and TCA cycle, energy status was up-regulated in the 786-O Res than in the 786-O Par cells. (Fig. 4a). The enlargement of the lysosomal compartments requires the up-regulation of the V-ATPase activity to maintain luminal acidic pH, which consumes ATP to pump protons into the lysosomal lumen.25) It is possible that the enriched metabolism contributed to the maintenance of luminal pH in acidic compartment by supplying ATP.
Previously, it has been shown that the predominant way cancer cells produce energy is through an increase in the rate of glycolysis, which results in the production of excess lactic acid, known as the Warburg effect.36) However, in this study the rate of production of lactic acid in the 786-O Res cells was comparable to that of the 786-O Par cells (Fig. 3). Therefore, it is likely that the observed increase in ATP production is a result of the up-regulation of the TCA cycle following glycolysis. As mentioned above, it has been reported that the 786-O cells have a defect in VHL gene.32) This defect in VHL results in the constitutive up-regulation of hypoxia inducible factor-α (HIF-α) and promotes glutamine carboxylation even under normoxic conditions, which allows the cancer cells to obtain citric acid and acetyl-CoA.37) These findings might explain the further increase in the levels of various metabolites in the TCA cycle as seen in the 786-O Res cells.38,39)
Sunitinib has also been shown to act as an efflux substrate for various ABC transporters, including P-gp (ABCB1) and breast cancer resistant protein (ABCG2).40–42) It has also been reported that tyrosine kinase inhibitors (TKIs) have concentration-dependent bimodal interactions with ABC transporters.43) At low concentrations sunitinib acts as the substrate, while at higher concentrations, it acts as an inhibitor of ABC transporters.44) In this study, the 786-O Res cells were exposed to sunitinib for long periods of time and sunitinib accumulated in the resistant 786-O cells, which would likely result in the inhibition of these transporters. Therefore, it appears that the acquired resistance to sunitinib is a result of intracellular sunitinib sequestration rather than release into the extracellular space via efflux pumps.
In addition to the energy-producing pathways, the arginine and proline pathways and the urea cycle were also found to be up-regulated in the 786-O Res cells (Fig. 2b). Arginine, a semi-essential amino acid, has been shown to be critical for the growth of cancer, particularly in those that exhibit de novo chemoresistance and poor clinical outcomes.45) Therefore, up-regulation of the arginine and proline pathways may accelerate malignancy and the acquisition of resistance in the 786-O cells to sunitinib.
Persistent exposure of RCC cells to sunitinib induces AXL- and MET-mediated cellular epithelial mesenchymal transition (EMT), VEGF secretion, and activates extracellular signal-regulated kinase (ERK) and phosphatidylinositol 3-kinase (PI3K)/AKT signaling.38,46) The AKT pathway is involved in energy production via translocation of glucose transporter (GLUT1) to the plasma membrane, and the activation of various rate-limiting enzymes involved in glycolysis, such as phosphofructokinase-2 (PFK-2).47) Therefore, it is possible that the activation of the AKT pathway, induced by prolonged sunitinib exposure, causes the up-regulation of the metabolic pathways, such as the glycolytic pathway, identified in this study.
The CE-TOFMS technique has shown to be an accurate method for the analysis of highly polar and ionic metabolites.48) Therefore, in this study we used CE-TOFMS to examine the dynamic changes of various hydrophilic metabolites in the 786-O Res cells. However, hydrophobic metabolites, such as those involved in lipid metabolism, would need to be examined using LC-MS or GC-MS to obtain a comprehensive picture of the metabolic changes associated with the acquisition of sunitinib resistance.
In summary, in this study we investigated the differences in several metabolic pathways between sunitinib-sensitive and -resistant 786-O cells. The results of our metabolic analyses indicated that glycolysis, the PPP, and the TCA cycle are up-regulated in the 786-O Res cells, suggesting a sunitinib-resistance mechanism. Even though further investigations are required to identify the direct link between mechanism of sunitinib resistance and metabolic alternation, these results provided novel insights into the mechanism of sunitinib resistance, which may facilitate the discovery of alternative therapeutic strategies for use in the treatment of sunitinib-resistant cancers.
Acknowledgments
This work was supported, in part, by the Program for Dissemination of the Tenure-Track System in Japan which is funded by the Ministry of Education, Culture, Sports, Science and Technology (to H.H.), and by a Grant-in-Aid for Young Scientists (B) (15K19161) from the Japan Society for the Promotion of Sciences. We would like to thank Dr. Chisato Mori (Center of Preventive Medical Science, Chiba University) for the use of the CE-TOFMS system.
Conflict of Interest
The authors declare no conflict of interest.
REFERENCES
- 1) Su D, Stamatakis L, Singer EA, Srinivasan R. Renal cell carcinoma: molecular biology and targeted therapy. Curr. Opin. Oncol., 26, 321–327 (2014).
- 2) Rini BI, Atkins MB. Resistance to targeted therapy in renal-cell carcinoma. Lancet Oncol., 10, 992–1000 (2009).
- 3) Zhou J, Yun EJ, Chen W, Ding Y, Wu K, Wang B, Ding C, Hernandez E, Santoyo J, Pong RC, Chen H, He D, Zhou J, Hsieh JT. Targeting 3-phosphoinositide-dependent protein kinase 1 associated with drug-resistant renal cell carcinoma using new oridonin analogs. Cell Death Dis., 8, e2701 (2017).
- 4) Vermeersch KA, Styczynski MP. Applications of metabolomics in cancer research. J. Carcinog., 12, 9 (2013).
- 5) Rahman M, Hasan MR. Cancer metabolism and drug resistance. Metabolites, 5, 571–600 (2015).
- 6) Soga T. Cancer metabolism: key players in metabolic reprogramming. Cancer Sci., 104, 275–281 (2013).
- 7) Wen S, Li Z, Feng J, Bai J, Lin X, Huang H. Metabonomic changes from pancreatic intraepithelial neoplasia to pancreatic ductal adenocarcinoma in tissues from rats. Cancer Sci., 107, 836–845 (2016).
- 8) Yoshie T, Nishiumi S, Izumi Y, Sakai A, Inoue J, Azuma T, Yoshida M. Regulation of the metabolite profile by an APC gene mutation in colorectal cancer. Cancer Sci., 103, 1010–1021 (2012).
- 9) Sellers K, Fox MP, Bousamra M 2nd, Slone SP, Higashi RM, Miller DM, Wang Y, Yan J, Yuneva MO, Deshpande R, Lane AN, Fan TW. Pyruvate carboxylase is critical for non-small-cell lung cancer proliferation. J. Clin. Invest., 125, 687–698 (2015).
- 10) Alonezi S, Tusiimire J, Wallace J, Dufton MJ, Parkinson JA, Young LC, Clements CJ, Park JK, Jeon JW, Ferro VA, Watson DG. Metabolomic profiling of the effects of melittin on cisplatin resistant and cisplatin sensitive ovarian cancer cells using mass spectrometry and biolog microarray technology. Metabolites, 6, (2016).
- 11) Hirayama A, Kami K, Sugimoto M, Sugawara M, Toki N, Onozuka H, Kinoshita T, Saito N, Ochiai A, Tomita M, Esumi H, Soga T. Quantitative metabolome profiling of colon and stomach cancer microenvironment by capillary electrophoresis time-of-flight mass spectrometry. Cancer Res., 69, 4918–4925 (2009).
- 12) Fujita M, Imadome K, Imai T. Metabolic characterization of invaded cells of the pancreatic cancer cell line, PANC-1. Cancer Sci., 108, 961–971 (2017).
- 13) Kitazawa S, Nishizawa S, Nakagawa H, Funata M, Nishimura K, Soga T, Hara T. Cancer with low cathepsin D levels is susceptible to vacuolar (H+)-ATPase inhibition. Cancer Sci., 108, 1185–1193 (2017).
- 14) Soga T, Baran R, Suematsu M, Ueno Y, Ikeda S, Sakurakawa T, Kakazu Y, Ishikawa T, Robert M, Nishioka T, Tomita M. Differential metabolomics reveals ophthalmic acid as an oxidative stress biomarker indicating hepatic glutathione consumption. J. Biol. Chem., 281, 16768–16776 (2006).
- 15) Sakai I, Miyake H, Fujisawa M. Acquired resistance to sunitinib in human renal cell carcinoma cells is mediated by constitutive activation of signal transduction pathways associated with tumour cell proliferation. BJU Int., 112, E211–E220 (2013).
- 16) Gao H, Deng L. Sphingosine kinase-1 activation causes acquired resistance against Sunitinib in renal cell carcinoma cells. Cell Biochem. Biophys., 68, 419–425 (2014).
- 17) Kinoshita A, Tsukada K, Soga T, Hishiki T, Ueno Y, Nakayama Y, Tomita M, Suematsu M. Roles of hemoglobin Allostery in hypoxia-induced metabolic alterations in erythrocytes: simulation and its verification by metabolome analysis. J. Biol. Chem., 282, 10731–10741 (2007).
- 18) Xia J, Wishart DS. MSEA: a web-based tool to identify biologically meaningful patterns in quantitative metabolomic data. Nucleic Acids Res., 38 (Web Server), W71–W77 (2010).
- 19) Gotink KJ, Broxterman HJ, Labots M, de Haas RR, Dekker H, Honeywell RJ, Rudek MA, Beerepoot LV, Musters RJ, Jansen G, Griffioen AW, Assaraf YG, Pili R, Peters GJ, Verheul HM. Lysosomal sequestration of sunitinib: a novel mechanism of drug resistance. Clin. Cancer Res., 17, 7337–7346 (2011).
- 20) Nowak-Sliwinska P, Weiss A, van Beijnum JR, Wong TJ, Kilarski WW, Szewczyk G, Verheul HM, Sarna T, van den Bergh H, Griffioen AW. Photoactivation of lysosomally sequestered sunitinib after angiostatic treatment causes vascular occlusion and enhances tumor growth inhibition. Cell Death Dis., 6, e1641 (2015).
- 21) Sardiello M, Palmieri M, di Ronza A, Medina DL, Valenza M, Gennarino VA, Di Malta C, Donaudy F, Embrione V, Polishchuk RS, Banfi S, Parenti G, Cattaneo E, Ballabio A. A gene network regulating lysosomal biogenesis and function. Science, 325, 473–477 (2009).
- 22) Kibria G, Hatakeyama H, Akiyama K, Hida K, Harashima H. Comparative study of the sensitivities of cancer cells to doxorubicin, and relationships between the effect of the drug-efflux pump P-gp. Biol. Pharm. Bull., 37, 1926–1935 (2014).
- 23) Kibria G, Hatakeyama H, Harashima H. Cancer multidrug resistance: mechanisms involved and strategies for circumvention using a drug delivery system. Arch. Pharm. Res., 37, 4–15 (2014).
- 24) Zhitomirsky B, Assaraf YG. Lysosomal sequestration of hydrophobic weak base chemotherapeutics triggers lysosomal biogenesis and lysosome-dependent cancer multidrug resistance. Oncotarget, 6, 1143–1156 (2015).
- 25) Maxson ME, Grinstein S. The vacuolar-type H(+)-ATPase at a glance—more than a proton pump. J. Cell Sci., 127, 4987–4993 (2014).
- 26) Fredholm BB. Adenosine, an endogenous distress signal, modulates tissue damage and repair. Cell Death Differ., 14, 1315–1323 (2007).
- 27) Boroughs LK, DeBerardinis RJ. Metabolic pathways promoting cancer cell survival and growth. Nat. Cell Biol., 17, 351–359 (2015).
- 28) Traverso N, Ricciarelli R, Nitti M, Marengo B, Furfaro AL, Pronzato MA, Marinari UM, Domenicotti C. Role of glutathione in cancer progression and chemoresistance. Oxid. Med. Cell. Longev., 2013, 972913 (2013).
- 29) Hanahan D, Weinberg RA. Hallmarks of cancer: the next generation. Cell, 144, 646–674 (2011).
- 30) Kroemer G, Pouyssegur J. Tumor cell metabolism: cancer’s Achilles’ heel. Cancer Cell, 13, 472–482 (2008).
- 31) Williams RD, Elliott AY, Stein N, Fraley EE. In vitro cultivation of human renal cell cancer. II. Characterization of cell lines. In Vitro, 14, 779–786 (1978).
- 32) Jiang Y, Zhang W, Kondo K, Klco JM, St Martin TB, Dufault MR, Madden SL, Kaelin WG Jr, Nacht M. Gene expression profiling in a renal cell carcinoma cell line: dissecting VHL and hypoxia-dependent pathways. Mol. Cancer Res., 1, 453–462 (2003).
- 33) Luan FL, Ding R, Sharma VK, Chon WJ, Lagman M, Suthanthiran M. Rapamycin is an effective inhibitor of human renal cancer metastasis. Kidney Int., 63, 917–926 (2003).
- 34) Settembre C, Zoncu R, Medina DL, Vetrini F, Erdin S, Erdin S, Huynh T, Ferron M, Karsenty G, Vellard MC, Facchinetti V, Sabatini DM, Ballabio A. A lysosome-to-nucleus signalling mechanism senses and regulates the lysosome via mTOR and TFEB. EMBO J., 31, 1095–1108 (2012).
- 35) Cenni V, Bertacchini J, Beretti F, Lattanzi G, Bavelloni A, Riccio M, Ruzzene M, Marin O, Arrigoni G, Parnaik V, Wehnert M, Maraldi NM, de Pol A, Cocco L, Marmiroli S, Lamin A. Ser404 is a nuclear target of Akt phosphorylation in C2C12 cells. J. Proteome Res., 7, 4727–4735 (2008).
- 36) Liberti MV, Locasale JW. The Warburg effect: How does it benefit cancer cells? Trends Biochem. Sci., 41, 211–218 (2016).
- 37) Wise DR, Ward PS, Shay JE, Cross JR, Gruber JJ, Sachdeva UM, Platt JM, DeMatteo RG, Simon MC, Thompson CB. Hypoxia promotes isocitrate dehydrogenase-dependent carboxylation of alpha-ketoglutarate to citrate to support cell growth and viability. Proc. Natl. Acad. Sci. U.S.A., 108, 19611–19616 (2011).
- 38) Baldewijns MM, van Vlodrop IJ, Vermeulen PB, Soetekouw PM, van Engeland M, de Bruine AP. VHL and HIF signalling in renal cell carcinogenesis. J. Pathol., 221, 125–138 (2010).
- 39) Joosten SC, Hamming L, Soetekouw PM, Aarts MJ, Veeck J, van Engeland M, Tjan-Heijnen VC. Resistance to sunitinib in renal cell carcinoma: From molecular mechanisms to predictive markers and future perspectives. Biochim. Biophys. Acta, 1855, 1–16 (2015).
- 40) Haouala A, Rumpold H, Untergasser G, Buclin T, Ris HB, Widmer N, Decosterd LA. siRNA-mediated knock-down of P-glycoprotein expression reveals distinct cellular disposition of anticancer tyrosine kinases inhibitors. Drug Metab. Lett., 4, 114–119 (2010).
- 41) Hu S, Chen Z, Franke R, Orwick S, Zhao M, Rudek MA, Sparreboom A, Baker SD. Interaction of the multikinase inhibitors sorafenib and sunitinib with solute carriers and ATP-binding cassette transporters. Clin. Cancer Res., 15, 6062–6069 (2009).
- 42) Sato H, Siddig S, Uzu M, Suzuki S, Nomura Y, Kashiba T, Gushimiyagi K, Sekine Y, Uehara T, Arano Y, Yamaura K, Ueno K. Elacridar enhances the cytotoxic effects of sunitinib and prevents multidrug resistance in renal carcinoma cells. Eur. J. Pharmacol., 746, 258–266 (2015).
- 43) Brózik A, Hegedus C, Erdei Z, Hegedus T, Ozvegy-Laczka C, Szakacs G, Sarkadi B. Tyrosine kinase inhibitors as modulators of ATP binding cassette multidrug transporters: substrates, chemosensitizers or inducers of acquired multidrug resistance? Expert Opin. Drug Metab. Toxicol., 7, 623–642 (2011).
- 44) Shukla S, Robey RW, Bates SE, Ambudkar SV. Sunitinib (Sutent, SU11248), a small-molecule receptor tyrosine kinase inhibitor, blocks function of the ATP-binding cassette (ABC) transporters P-glycoprotein (ABCB1) and ABCG2. Drug Metab. Dispos., 37, 359–365 (2009).
- 45) Phang JM, Liu W, Hancock CN, Fischer JW. Proline metabolism and cancer: emerging links to glutamine and collagen. Curr. Opin. Clin. Nutr. Metab. Care, 18, 71–77 (2015).
- 46) Zhou L, Liu XD, Sun M, Zhang X, German P, Bai S, Ding Z, Tannir N, Wood CG, Matin SF, Karam JA, Tamboli P, Sircar K, Rao P, Rankin EB, Laird DA, Hoang AG, Walker CL, Giaccia AJ, Jonasch E. Targeting MET and AXL overcomes resistance to sunitinib therapy in renal cell carcinoma. Oncogene, 35, 2687–2697 (2016).
- 47) Bost F, Decoux-Poullot AG, Tanti JF, Clavel S. Energy disruptors: rising stars in anticancer therapy? Oncogenesis, 5, e188 (2016).
- 48) Iwasaki Y, Sawada T, Hatayama K, Ohyagi A, Tsukuda Y, Namekawa K, Ito R, Saito K, Nakazawa H. Separation technique for the determination of highly polar metabolites in biological samples. Metabolites, 2, 496–515 (2012).