Abstract
Protein quality control (PQC) in the heart plays an important role to maintain cellular protein homeostasis. Impairment of PQC may cause the development of heart failure. It is well known that histone deacetylase 6 (HDAC6) is an essential enzyme for regulating the cellular PQC response. In this study, we aimed at examining the association between HDAC6 and the chaperone system and the effects of HDAC6 inhibition in the development of heart failure following myocardial infarction (MI). MI was induced by coronary artery ligation. Coronary artery-ligated and sham-operated rats were divided into groups that were orally administered suberoylanilide hydroxamic acid (SAHA) or vehicle from the 2nd to 8th week after the operation. The cardiac function and protein expression levels in the viable left ventricle were analyzed by echocardiography, Western blotting, and immunohistochemistry at the 2nd and 8th weeks after the operation. The deacetylase activity of HDAC6 was markedly elevated during the development of heart failure after MI. In the failing heart, a decrease in heat-shock protein (HSP) contents and an accumulation of ubiquitinated proteins were observed, indicating PQC dysfunction. Inhibition of HDAC6 activity by SAHA treatment enhanced the translocation of heat-shock transcription factor 1 to the nucleus and induced the expression of HSP, resulting in maintenance of cellular protein homeostasis. The cardiac pump function after MI was also improved by SAHA administration. Our findings suggest that inhibition of HDAC6 activity is a novel approach for the treatment of heart failure following MI.
INTRODUCTION
Maintaining protein homeostasis is essential for proper cellular function in various tissues, especially the heart,1,2) since it is generally accepted that cardiomyocytes are terminally differentiated cells and have a very limited regenerative potential.3) Pathophysiological cardiac stresses such as ischemia, hypertension, and certain genetic disorders may compromise protein homeostasis and induce misfolding of cellular proteins.4–6) Intracellular accumulation of toxic misfolded proteins and their aggregates may cause the development of heart failure. Cells possess an innate mechanism to sense protein misfolding by which they can restore or remove these misfolded proteins. This mechanism is termed “protein quality control (PQC)”, which consists of 3 major pathways.7,8) Misfolded proteins are first refolded by heat-shock proteins (HSPs), which are molecular chaperones. When the chaperone system fails to refold denatured proteins, the second pathway is engaged, by which these proteins are ubiquitinated and guided to the proteasomal machinery for protein degradation. Under conditions where these systems are impaired or overwhelmed, such ubiquitinated proteins accumulate in perinuclear structures, the so-called “aggresomes”, which are eventually digested by the third pathway, autophagy. Thus, the accumulation of ubiquitinated proteins implies PQC dysfunction. Histone deacetylase 6 (HDAC6) is involved in all 3 PQC pathways.9–13)
Histone deacetylases catalyze the removal of acetyl groups from lysine residues of histones and non-histone proteins for regulation various gene expression and cellular signaling systems.14) HDAC6 is an isozyme in the class IIb subgroup, which play a pivotal role in the cellular PQC response. HDAC6 is unique among its family members, because of its structural features and substrate specificity.15,16) HDAC6 is predominantly localized to the cytoplasm and deacetylates non-histone substrates including α-tubulin, HSP90, and cortactin. In its N-terminal region, HDAC6 has 2 deacetylase domains that play essential roles in deacetylating various cytoplasmic proteins; and in its C-terminal region, it also has a zinc-finger ubiquitin-binding domain (ZnF-UBP).
We focused on the association between HDAC6 and the chaperone system, which is the first line of defense against cytotoxicity of misfolded proteins among the PQC pathways.17,18) In unstressed cells, HDAC6 is present within a cytoplasmic complex including HSP90 and heat-shock transcription factor 1 (HSF1). HDAC6 deacetylates HSP90 and modulates its chaperone activity. HSF1, a transcription factor essential in the activation of the HSP-encoding genes, is maintained in an inactive form through its association with HSP90. When the cells are overloaded with misfolded proteins, HDAC6 senses the accumulation of ubiquitinated proteins via its ZnF-UBP and dissociates from the complex, triggering acetylation of HSP90 and the release of HSF1, subsequently inducing HSP expression. These chaperones play an important role in protecting cells from stress. However, pathophysiological roles of HDAC6 in PQC during the development of heart failure after myocardial infarction (MI) remain unclear. In this study, time-course changes of myocardial HDAC6 content and activity were examined to elucidate the involvement of HDAC6 in HSP expression after MI. Suberoylanilide hydroxamic acid (SAHA) is a pan-HDAC inhibitor with potent inhibitory effect towards HDAC6.19,20) Furthermore, we inhibited HDAC6 deacetylase activity by using SAHA and also investigated the effects of SAHA treatment on HSP contents and cardiac function.
MATERIALS AND METHODS
Animals and OperationMale Wistar rats (10-week-old, weighing 220–240 g) were purchased from SLC, Inc. (Shizuoka, Japan). The animals were conditioned according to the Guide for the Care and Use of Laboratory Animals published by the US National Institutes of Health (NIH Publication No. 85-23, revised 1996). The protocol of this study was approved by the Committee of Animal Care and Welfare of Tokyo University of Pharmacy and Life Sciences.
The rat MI model was produced by ligating the left ventricular (LV) anterior descending coronary artery according to the method described previously.21) Rats with MI (coronary artery ligation [CAL] rats) and having an infarct area comprising approximately 40% of the left ventricle were consistently produced under our experimental conditions.22) Sham-operated rats (Sham rats) were treated in a similar manner except that CAL was not performed.
Oral gavage treatment of the Sham and CAL rats with 50 mg/kg/d of SAHA (Cayman Chemical, Ann Arbor, MI, U.S.A.) or vehicle was performed from the 2nd (2W) to the 8th (8W) week after the operation. SAHA was suspended in 1.0% sodium carboxymethyl cellulose solution containing 0.5% Tween 80 for the oral administration. Sham and CAL rats were each divided into 3 groups: the groups at the onset of SAHA treatment (2W-Sham and 2W-CAL), vehicle-treated groups (8W-Sham-Vehicle and 8W-CAL-Vehicle), and SAHA-treated groups (8W-Sham-SAHA and 8W-CAL-SAHA). Since scar tissue had already formed in the 2W-CAL rat, the effect of SAHA treatment was not due to a reduction in the infarct size.
Echocardiographic MeasurementsTwo and eight weeks after the operation, CAL and Sham rats were anesthetized with 40 mg/kg pentobarbital sodium intraperitoneally, and then their left hemithorax hair was shaved off before examination. Transthoracic echocardiography was performed by using an ARIETTA 70 (Hitachi, Ltd., Tokyo, Japan) equipped with an 7–13 MHz transducer as described previously.23) The LV internal diameters at end diastole (LVIDd) and systole (LVIDs) were measured by M-mode tracings, and then the LV end-diastolic volume (EDV) and end-systolic volume (ESV) were calculated. The LV fractional shortening (FS) and ejection fraction (EF) were calculated from the LV diameters and volumes. After determination of the pulmonary arterial flow by using long-axis view, heart rate (HR), velocity time integral, pulmonary arterial diameter, and pulmonary artery acceleration time (PAAT) were measured, and then the cardiac output (CO) and stroke volume (SV) at the pulmonary artery were calculated. CO and SV were normalized to body weight (BW) of the animal to express CO and SV indices, respectively. The LV E/A ratio and the LV and right ventricular (RV) Tei indices24) were measured based on the apical four-chamber and long-axis views.
Western Blotting and Detection of ProteinsHearts were quickly isolated and divided into LV wall, septum (Sep), and RV wall, and the isolated LV wall was separated into viable area (viable LV) and scar tissue; and then these tissues were weighed. The viable LV was minced and homogenized in a homogenization buffer (250 mM sucrose, 20 mM 2-[4-(2-hydroxyethyl)-1-piperazinyl]ethanesulfonic acid (HEPES), 1 mM dithiothreitol, 1 mM ethylene glycol-bis(2-aminoethylether)-N,N,N′,N′-tetraacetic acid (EGTA), cOmplete™ Mini EDTA-free protease inhibitor cocktail (Roche, Basel, Switzerland), and PhosSTOP™ phosphatase inhibitor cocktail (Roche); pH 7.4, at 4°C). Protein concentration was measured by the Bradford method. Proteins were separated by sodium dodecyl sulfate-polyacrylamide gel electrophoresis (SDS-PAGE) and transferred onto polyvinylidene difluoride membranes (Immobilon-P; Millipore, Billerica, MA, U.S.A.) before blocking in 50% Blocking One (Nacalai Tesque, Kyoto, Japan) in Tris-buffered saline with Tween 20 (TBST). The membranes were first incubated overnight at 4°C with the primary antibodies and thereafter probed with appropriate secondary horseradish peroxidase-conjugated antibodies by incubated for 1 h at the room temperature (r.t.). For visualization of proteins transferred to the membrane, Chemi-Lumi One L (Nacalai Tesque) or Chemi-Lumi One Super (Nacalai Tesque) was used. Densitometric analysis was performed by using ImageJ software (NIH, Bethesda, MD, U.S.A.). The following primary antibodies were used: anti-HDAC6 rabbit monoclonal (D21B10, Cell Signaling Technology, Inc., Danvers, MA, U.S.A.), anti-glyceraldehyde-3-phosphate dehydrogenase (GAPDH) mouse monoclonal (6C5, Millipore), anti-acetylated α-tubulin mouse monoclonal (6-11B-1, Sigma-Aldrich Co., St. Louis, MO, U.S.A.), anti-α-tubulin mouse monoclonal (B-5-1-2, Sigma-Aldrich Co.), anti-HSP90 mouse monoclonal (68/Hsp90, BD Transduction Laboratories, Lexington, KY, U.S.A.), anti-HSF1 rat monoclonal (10H8, StressMarq Biosciences Inc., Victoria, BC, Canada), anti-HSP72 mouse monoclonal (W27, Calbiochem, San Diego, CA, U.S.A.), anti-HSPB1 rabbit polyclonal (Enzo Life Sciences, Inc., Farmingdale, NY, U.S.A.), anti-HSPB5 mouse monoclonal (1B6.1-3G4, Enzo Life Sciences, Inc.), and anti-mono and polyubiquitinylated conjugate mouse monoclonal (FK2, Enzo Life Sciences, Inc.).
Immunoprecipitation of HSP90 and Immunoblot AnalysisFor immunoprecipitation (IP) of HSP90, 800 µg protein of tissue homogenates were diluted with IP buffer (50 mM HEPES, 150 mM NaCl, 2 mM ethylenediamine-N,N,N′,N′-tetraacetic acid (EDTA), 1% Triton X-100, 10% glycerol, 500 nM trichostatin A (Sigma-Aldrich Co.), cOmplete™ Mini EDTA-free protease inhibitor cocktail (Roche), and PhosSTOP™ phosphatase inhibitor cocktail (Roche); pH 7.4). Samples were preincubated for 1 h with protein G-agarose beads (Life Technologies Co., Carlsbad, CA, U.S.A.) and then centrifuged to remove any proteins that adhered nonspecifically to the protein G-agarose. The supernatant was then incubated with 2 µg anti-HSP90 mouse monoclonal antibody (86/Hsp90) overnight at 4°C. Next, protein G-agarose was added, and the incubation continued for 2 h at 4°C. The immunoprecipitates were washed 3 times with IP buffer, and the proteins bound to the beads were eluted with Laemmli’s buffer prior to immunoblot analysis with anti-acetyl HSP90 (Lys294) rabbit polyclonal antibody (Rockland Immunochemicals Inc., Limerick, PA, U.S.A.). Blots were stripped and reprobed for detection of HSP90.
Immunohistochemical AnalysisHearts were quickly excised and fixed by coronary perfusion with 4% paraformaldehyde in 0.1 M phosphate buffer containing 50 mM sodium fluoride and 30 mM sodium pyrophosphate. The fixed hearts were immersed in 30% sucrose in 0.1 M phosphate buffer and then embedded in Neg-50™ (Thermo Fisher Scientific, Inc., Waltham, MA, U.S.A.). Ten-micrometer-thick cryosections, prepared by using a Microm HM550 cryostat (Thermo Fisher Scientific, Inc.), were rendered permeable by incubation with 1% Triton X-100 in phosphate-buffered saline (PBS) for 30 min. Then, the sections were incubated with 50% Blocking One Histo (Nacalai Tesque) in PBS for 30 min. After having been blocked, the sections were incubated with anti-HSF1 rabbit polyclonal (Enzo Life Sciences, Inc.) overnight at 4°C, and then with Cy3-conjugated goat anti-rabbit immunoglobulin G (IgG) (GE Healthcare UK Ltd., Little Chalfont, U.K.) for 1 h at the r.t. Subsequently, for double immunofluorescence staining, the same sections were incubated with anti-α-actinin mouse monoclonal (EA-53, Sigma-Aldrich Co.) overnight at 4°C, and then with fluorescein isothiocyanate (FITC)-conjugated horse anti-mouse IgG (Vector Laboratories, Inc., Burlingame, CA, U.S.A.) for 1 h at the r.t. These sections were counterstained with 4,’6-diamidino-2-phenylindole (DAPI) and mounted by using Dako Fluorescence Mounting Medium (Agilent Technologies, Ltd., Santa Clara, CA, U.S.A.). Sections in which the primary antibodies were omitted served as negative controls for the staining procedure. No immuno-positive cells were detected in these sections. Fluorescent images were obtained by using a CCD camera (DP70; Olympus, Tokyo, Japan) mounted on a BX52 microscope (Olympus).
Statistical AnalysisThe results were presented as the means ± standard error of the mean (S.E.M.). Statistical analysis among multiple groups was performed by using ANOVA followed by Scheffe’s test as a post hoc test (StatView version 5.0; SAS Institute Inc., Cary, NC, U.S.A.). Differences with a probability of less than 5% were considered to indicate statistical significance (p < 0.05).
RESULTS
Changes in Echocardiographic Parameters after CALThe cardiac parameters of the Sham and CAL rats were determined by the echocardiographic method at the 2nd and 8th weeks after the operation (Table 1). The left ventricular FS, an index of LV systolic function, of the 2W-CAL and 8W-CAL-Vehicle rats was reduced to approximately 35 and 19%, respectively, of that of the corresponding Sham rats. There was no significant difference in the CO index between the 2W-Sham and 2W-CAL groups. In contrast, the CO index of the 8W-CAL-Vehicle group was decreased to approximately 75% of that of the corresponding Sham group. PAAT, which provides an accurate estimate of the systolic pulmonary arterial pressure, was reduced in the 2W-CAL and 8W-CAL-Vehicle groups. The LV and RV Tei indices, which are comprehensive indices of cardiac functions covering both systolic and diastolic functions and whose values rise with the development of the left and right ventricular dysfunction, were increased in CAL groups compared with those in Sham groups at the 2nd and 8th weeks after the operation. The rise in these indices of 8W-CAL-Vehicle rats was greater than that of 2W-CAL rats. These results indicate that the 2W-CAL rats were in the compensatory phase of cardiac function and that the 8W-CAL-Vehicle rats were in the heart failure phase, as was shown in a series of our earlier studies.23,25)
Table 1. Changes in Echocardiographic Parameters of Sham-Operated (Sham) and Coronary Artery-Ligated (CAL) Rats with and without Suberoylanilide Hydroxamic Acid (SAHA) Treatment at the 2nd (2W) and 8th (8W) Weeks after the Operation
| 2W | 8W |
|---|
| | | Vehicle | SAHA |
|---|
| Sham | CAL | Sham | CAL | Sham | CAL |
|---|
| M-mode | | | | | | |
| LVIDd (mm) | 5.55 ± 0.02 | 8.91 ± 0.04* | 5.78 ± 0.04 | 10.19 ± 0.07*# | 5.59 ± 0.06 | 9.67 ± 0.12*#† |
| LVIDs (mm) | 2.59 ± 0.02 | 7.26 ± 0.05* | 2.74 ± 0.02 | 9.16 ± 0.09*# | 2.65 ± 0.05 | 8.05 ± 0.11*#† |
| FS (%) | 53.0 ± 0.3 | 18.4 ± 0.2* | 52.5 ± 0.1 | 10.0 ± 0.2*# | 52.3 ± 0.5 | 16.8 ± 0.3*#† |
| ESV (µL) | 17.4 ± 0.4 | 382.1 ± 7.6* | 20.6 ± 0.5 | 770.9 ± 21.5*# | 18.8 ± 1.1 | 522.5 ± 20.5*#† |
| EDV (µL) | 171 ± 2 | 707 ± 9* | 194 ± 4 | 1059 ± 23*# | 175 ± 5 | 905 ± 32*#† |
| EF (%) | 89.8 ± 0.2 | 45.9 ± 0.5* | 89.4 ± 0.1 | 27.3 ± 0.6*# | 89.3 ± 0.3 | 42.3 ± 0.6*#† |
| D-mode | | | | | | |
| HR (bpm) | 408 ± 2 | 406 ± 2 | 407 ± 3 | 402 ± 1 | 411 ± 4 | 400 ± 2 |
| CO (mL/min) | 112.3 ± 1.4 | 86.3 ± 1.8* | 139.9 ± 2.3 | 73.9 ± 3.0*# | 131.2 ± 2.9 | 113.0 ± 1.6*#† |
| CO index (µL/min/g) | 409 ± 1 | 404 ± 1 | 404 ± 1 | 302 ± 1*# | 406 ± 2 | 403 ± 3† |
| SV (µL) | 275 ± 4 | 213 ± 5* | 344 ± 7 | 184 ± 7*# | 320 ± 8 | 282 ± 5*#† |
| SV index (µL/g) | 1.00 ± 0.01 | 1.00 ± 0.01 | 0.99 ± 0.01 | 0.75 ± 0.01*# | 0.99 ± 0.01 | 1.01 ± 0.01† |
| PAAT (msec) | 28.4 ± 0.3 | 20.6 ± 0.4* | 29.9 ± 0.6 | 16.0 ± 0.1*# | 29.9 ± 0.7 | 20.2 ± 0.2*† |
| LV E/A ratio | 1.52 ± 0.01 | 1.83 ± 0.01* | 1.53 ± 0.01 | 2.22 ± 0.04*# | 1.53 ± 0.01 | 1.55 ± 0.01#† |
| LV Tei index | 0.31 ± 0.01 | 0.69 ± 0.03* | 0.33 ± 0.01 | 1.18 ± 0.04*# | 0.33 ± 0.01 | 0.67 ± 0.03*† |
Each value represents the means ± S.E.M. of 6 independent experiments.* p<0.05 vs. the corresponding Sham groups. # p<0.05 vs. 2W-CAL group. † p<0.05 vs. 8W-CAL-Vehicle group. Abbreviations: LVIDd, left ventricular internal diameter at end-diastole; LVIDs, left ventricular internal diameter at end-systole; FS, fractional shortening; ESV, end-systolic volume; EDV, end-diastolic volume; EF, ejection fraction; HR, heart rate; CO, cardiac output; SV, stroke volume; PAAT, pulmonary artery acceleration time; LV, left ventricular; RV, right ventricular.
Tissue weight of the Sham and CAL rats was measured at the 2nd and 8th weeks after the operation (Table 2). There were no significant differences in the LVW/BW ratios between the 2W-CAL and 8W-CAL-Vehicle groups and the corresponding Sham groups. The SepW/BW ratios of the 2W-CAL and 8W-CAL-Vehicle rats were increased to approximately 130 and 170%, respectively, of those of the corresponding Sham rats; and their RVW/BW ratios, to approximately 230 and 300%, respectively, of those of the corresponding Sham rats. Similarly, the heart weight (HW)/BW ratios, an index of cardiac hypertrophy, of the 2W-CAL and 8W-CAL-Vehicle rats were respectively increased to approximately 135 and 155% of those of the corresponding Sham rats.
Table 2. Changes in Tissue-Weight Parameters of Sham-Operated (Sham) and Coronary Artery-Ligated (CAL) Rats with and without Suberoylanilide Hydroxamic Acid (SAHA) Treatment at the 2nd (2W) and 8th (8W) Weeks after the Operation
| 2W | 8W |
|---|
| | | Vehicle | SAHA |
|---|
| Sham | CAL | Sham | CAL | Sham | CAL |
|---|
| BW (g) | 271 ± 2 | 209 ± 3* | 326 ± 9 | 238 ± 5*# | 310 ± 11 | 266 ± 4*#† |
| Tissue weight | | | | | | |
| LVW (mg) | 324 ± 6 | 245 ± 6* | 381 ± 9 | 257 ± 7* | 380 ± 18 | 291 ± 15* |
| LVW/BW (mg/g) | 1.20 ± 0.03 | 1.17 ± 0.03 | 1.17 ± 0.02 | 1.08 ± 0.02 | 1.22 ± 0.02 | 1.09 ± 0.05 |
| SepW (mg) | 159 ± 4 | 160 ± 4 | 178 ± 2 | 221 ± 9*# | 180 ± 4 | 199 ± 7# |
| SepW/BW (mg/g) | 0.59 ± 0.01 | 0.76 ± 0.02* | 0.55 ± 0.02 | 0.93 ± 0.03*# | 0.58 ± 0.01 | 0.75 ± 0.03*† |
| RVW (mg) | 130 ± 3 | 233 ± 6* | 152 ± 4 | 327 ± 22*# | 150 ± 4 | 302 ± 15*# |
| RVW/BW (mg/g) | 0.48 ± 0.01 | 1.12 ± 0.03* | 0.47 ± 0.02 | 1.37 ± 0.07*# | 0.48 ± 0.01 | 1.13 ± 0.05*† |
| HW (mg) | 614 ± 4 | 638 ± 13 | 711 ± 7 | 805 ± 31*# | 709 ± 25 | 791 ± 25# |
| HW/BW (mg/g) | 2.27 ± 0.01 | 3.06 ± 0.06* | 2.18 ± 0.03 | 3.38 ± 0.06*# | 2.29 ± 0.01 | 2.97 ± 0.07*† |
Each value represents the means ± S.E.M. of 4–6 independent experiments. * p<0.05 vs. the corresponding Sham groups. # p<0.05 vs. 2W-CAL group. † p<0.05 vs. 8W-CAL-Vehicle group. Abbreviations: BW, body weight; LVW, left ventricular weight; SepW, septal weight; RVW, right ventricular weight; HW, heart weight.
Time–course changes in HDAC6 content in the viable LV during the development of heart failure following MI were examined. The myocardial HDAC6 content of the 2W-CAL rats was increased to approximately 155% of that of the corresponding Sham rats. In contrast, that of the 8W-CAL-Vehicle rats was similar to that of the corresponding Sham rats (Figs. 1A, B). HDAC6 deacetylase activity can be assessed by monitoring changes in the acetylation level of α-tubulin.26,27) The acetylation level of myocardial α-tubulin in the 2W-CAL rats was increased to approximately 380% of that in the corresponding Sham rats. On the other hand, the level of in the 8W-CAL-Vehicle rats was similar to that in the corresponding Sham rats (Figs. 1C, D).
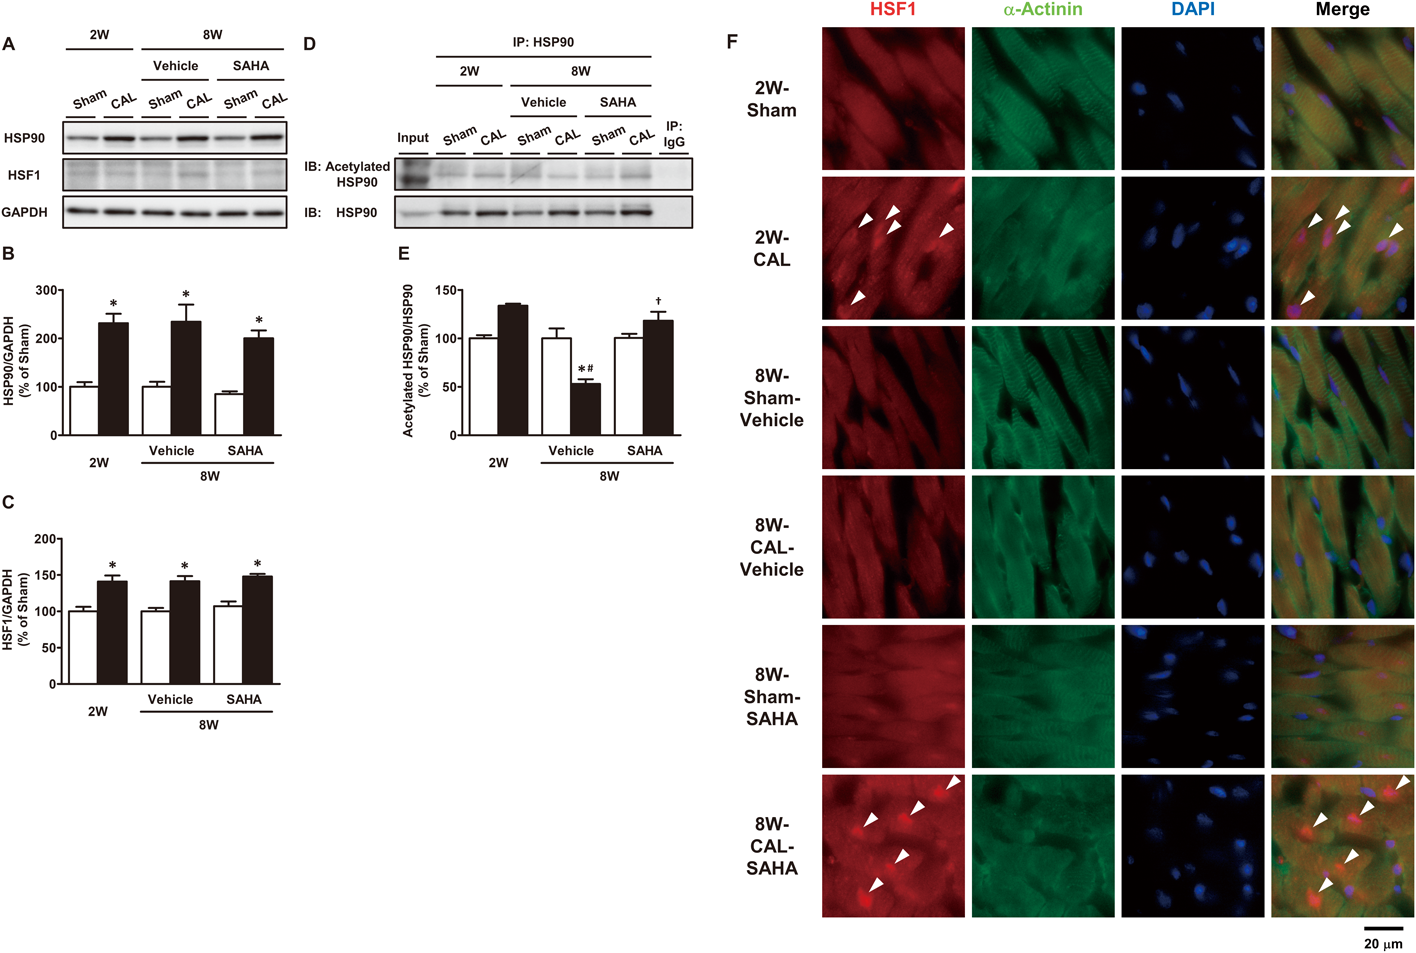
Changes in HSP90 and HSF1 Contents, the Acetylation Level of HSP90, and Subcellular Localization of HSF1 in the Viable LV after CALNext, we determined the contents of HSP90 and HSF1. The chaperone function of HSP90 is regulated by deacetylation by HDAC6.28) HSF1 is a client protein of HSP90 and a transcription factor of HSP.29) Myocardial HSP90 and HSF1 contents of the 2W-CAL rats were increased to approximately 2- and 1.4-fold, respectively, of those of the corresponding Sham rats. These contents in the 8W-CAL-Vehicle rats were similar to those in the 2W-CAL rats (Figs. 2A–C). We next examined the changes in the acetylation state of HSP90. The acetylation level of HSP90 in the 2W-CAL rats tended to be increased compared to that in the corresponding Sham rats. In contrast, the acetylation level of HSP90 in the 8W-CAL-Vehicle rats was decreased to approximately 50% of that in the corresponding Sham rats (Figs. 2D, E). Subsequently, we observed the changes in the subcellular localization of HSF1 in the myocardium at the 2nd and 8th weeks after the operation by using an immunohistochemical method. Immunohistochemical localization of myocardial HSF1 was predominantly cytosolic in the 2W-Sham and 8W-Sham-Vehicle rats. Obvious nuclear localization of HSF1 was seen in the 2W-CAL rats, whereas in the 8W-CAL-Vehicle rats there was no fluorescence of HSF1 in their nucleus (Fig. 2F).
Changes in HSP and Ubiquitinated Protein Contents in the Viable LV after CALHSF1 regulates the expression of HSPs such as HSP72, HSPB1, and HSPB5.30,31) We examined the changes in these HSP contents during the development of heart failure. Consistent with the changes in the subcellular localization of HSF1, myocardial HSP72, HSPB1, and HSPB5 contents of the 2W-CAL rats were respectively increased to approximately 195, 220, and 145% of those of the corresponding Sham rats. In contrast, the contents of these 3 HSPs in the 8W-CAL-Vehicle rats were similar to those in the corresponding Sham rats (Figs. 3A–D). In the 8W-CAL-Vehicle rats, the accumulation of ubiquitinated proteins was observed in the myocardium, with a concomitant decrease in these HSP contents (Figs. 3E, F).
Effects of SAHA Treatment on Changes in HDAC6 Content and Its Deacetylase ActivityNext, we administered SAHA, an HDAC inhibitor, from the 2nd to the 8th week after sham- or CAL-operation. Myocardial HDAC6 contents of both Sham and CAL rats treated with SAHA were increased to approximately 140 and 150%, respectively, of those of vehicle-treated groups (Figs. 1A, B). On the other hand, the acetylation level of α-tubulin in the 8W-CAL-SAHA group was increased to approximately 3-fold of that in the 8W-CAL-Vehicle group, indicating that SAHA had inhibited the deacetylase activity of HDAC6. The acetylated α-tubulin level in the 8W-Sham-SAHA group was 130% of that in the 8W-Sham-Vehicle group, suggesting that SAHA may have exerted even greater inhibition of HDAC6 under pathophysiological conditions (Figs. 1C, D).
Effects of SAHA Treatment on Changes in HSP90 and HSF1 Contents, the Acetylation Level of HSP90, and Subcellular Localization of HSF1Next, we examined the effects of SAHA treatment on myocardial contents of HSP90 and HSF1, which are complex components associated with the regulation of HSP expression. Myocardial HSP90 and HSF1 contents of the CAL rats were respectively increased to approximately 2- and 1.4-fold of those of the corresponding Sham rats. There were no differences in HSP90 and HSF1 contents between vehicle and SAHA treatment (Figs. 2A–C). Subsequently, we investigated the effects of SAHA administration on the acetylation state of HSP90. The acetylation level of HSP90 in the 8W-CAL-SAHA rats was elevated to more than twice that in the 8W-CAL-Vehicle rats and was maintained at the level similar to that in the 2W-CAL rats. Thereafter, we also examined immunohistochemically the effects of SAHA treatment on subcellular localization of HSF1. Nuclear localization of HSF1 was not seen in the 8W-CAL-Vehicle rats, while there was a significant increase in the fluorescence of HSF1 in the nucleus of cardiomyocytes in the 8W-CAL-SAHA rats (Fig. 2F).
Effects of SAHA Treatment on Changes in HSP and Ubiquitinated Protein ContentsWe examined the effects of SAHA treatment on myocardial HSP72, HSPB1, and HSPB5 contents, whose expression levels were regulated by HSF1. There were no significant differences in these myocardial HSP contents between vehicle-treated Sham and CAL rats. On the other hand, the contents of these 3 HSPs in the CAL rats treated with SAHA were greater than those in the 8W-CAL-Vehicle and 8W-Sham-SAHA groups. These results were consistent with the localization of HSF1 to the nucleus. The myocardial HSP72 content of the 8W-CAL-SAHA group was increased to approximately 250% of that of the 8W-CAL-Vehicle group and to approximately 155% of that of the 8W-Sham-SAHA group. The myocardial HSPB1 content of the 8W-CAL-SAHA group was increased to approximately 170% of that of the 8W-CAL-Vehicle group and to approximately 185% of that of the 8W-Sham-SAHA group. The content of myocardial HSPB5 of the 8W-CAL-SAHA group was increased to approximately 135% of that of the 8W-Sham-SAHA group. Although HSPB1 and HSPB5 contents in the 8W-Sham-SAHA group did not significantly increase compared with those of the 8W-Sham-Vehicle group, the HSP72 content of the 8W-Sham-SAHA group was increased to approximately twice that of the 8W-Sham-Vehicle group (Figs. 3A–D). Furthermore, the accumulation of ubiquitinated proteins in the 8W-CAL-Vehicle rats was alleviated by treatment with SAHA (Figs. 3E, F).
Effects of SAHA Treatment on Changes in Echocardiographic ParametersNext, we examined whether HDAC6 inhibition could prevent cardiac dysfunction after MI. The cardiac parameters of Sham and CAL rats with and without SAHA treatment were determined by use of the echocardiographic method (Table 1). The left ventricular FS of the 8W-CAL-SAHA rats was approximately 32% of that of the 8W-Sham-SAHA rats and was approximately 1.7-fold of that of the 8W-CAL-Vehicle rats. The CO index was decreased in the 8W-CAL-Vehicle group compared with that in the 8W-Sham-Vehicle group, whereas the value in the 8W-CAL-SAHA group was similar to that in the 8W-Sham-SAHA group. The PAAT of the 8W-CAL-Vehicle group was significantly decreased compared with that of the 8W-Sham-Vehicle group. In the 8W-CAL-SAHA group, the decrease in this value was attenuated. The LV and RV Tei indices of the 8W-CAL-Vehicle group were increased to 3.6- and 2.8-fold of those of the 8W-Sham-Vehicle group. The rise in these indices was attenuated to approximately 60 and 70%, respectively, of those of the 8W-CAL-Vehicle group by SAHA treatment. The HR did not differ between these experimental groups. There were no significant differences in echocardiographic parameters between the 8W-Sham-Vehicle and 8W-Sham-SAHA groups in this experiment.
Effects of SAHA Treatment on Changes in Tissue-Weight ParametersWhen the tissue weights of Sham and CAL rats with and without SAHA treatment were measured (Table 2), no significant differences in the LVW/BW ratio were found between the 8W-CAL-Vehicle and 8W-CAL-SAHA rats. The SepW/BW, RVW/BW, and HW/BW ratios of the 8W-CAL-Vehicle group were respectively increased to approximately 170, 300, and 155% of those of the corresponding Sham group. In the 8W-CAL-SAHA group, SepW/BW, RVW/BW, and HW/BW ratios were approximately 130, 235, and 130%, respectively, of those in the corresponding Sham group. The values of these 3 parameters in the 8W-CAL-SAHA group were lower than those in the 8W-CAL-Vehicle group.
DISCUSSION
In the present study, we observed systolic dysfunction as suggested by decreases in the FS and EF in the 2W-CAL rats. In addition, the elevated E/A ratio in the 2W-CAL rats showed impaired diastolic function. The cardiac pump function, indicated by CO and SV indices, was preserved at the 2nd week after MI. These findings suggest that the cardiac function of the 2W-CAL rats was compensated under the present experimental conditions. In the 8W-CAL-Vehicle rats, both systolic and diastolic functions were further decreased to lower levels than those in the 2W-CAL rats. Furthermore, the cardiac pump function was also reduced at the 8th week after MI. These findings indicate that possible signs of chronic heart failure were present at the 8th week after MI in this model.23,25)
Several investigators have reported that proteotoxicity caused by accumulation of misfolded proteins and their aggregates may be a key contributor to the progression of heart failure.1,2,8) Although it is well known that HDAC6 is an essential enzyme for regulating the cellular PQC response,9–13,17,18) its role in the heart during the development of heart failure following MI has not yet been elucidated. Therefore, we first investigated the changes in myocardial HDAC6 content and its deacetylase activity during the development of heart failure. At the 2nd week after MI, the HDAC6 content was increased compared with that of the Sham group; whereas at the 8th week after MI, this content was reversed to a level similar to that of the Sham group. Although the content of HDAC6 was decreased from the 2nd to 8th week after MI, the acetylation level of α-tubulin was reduced. Recently, several proteins that interact with HDAC6 and regulate its deacetylase activity have been reported.32–35) These proteins may control HDAC6 activity in the myocardium after MI. These findings indicate that deacetylase activity of HDAC6 was markedly elevated in the development of heart failure after MI. HSP90 and HSF1 contents, which are components of the HDAC6-HSP90-HSF1 complex, were greater in the CAL groups than in the Sham groups. However, the up-regulation of these 2 proteins at the 8th week was similar to that at the 2nd week after MI. On the other hand, the acetylation level of HSP90 tended to be increased at the 2nd week, and was decreased at the 8th week after MI compared to that of the corresponding Sham rats. HSF1 released from the complex by acetylation of HSP90 becomes translocated from the cytoplasm to the nucleus, where it induces the expression of HSP genes.29–31) Although myocardial HSF1 content did not change, we assumed that there may have been difference in the subcellular localization of HSF1 between the 2nd and 8th weeks after MI. In the 2W-CAL rats, HSF1 was seen in the nucleus of cardiomyocytes in the viable LV. In contrast, in the 8W-CAL-Vehicle rats, there was no fluorescence of HSF1 in the nucleus of the cells. Consistent with the alteration in HSF1 intracellular localization, HSP contents such as HSP72, HSPB1, and HSPB5, which are highly expressed in the myocardium,36,37) were increased in the 2W-CAL rats. On the other hand, these HSP expression levels of the 8W-CAL-Vehicle rats were reversed to the levels similar to those of the corresponding Sham rats. In the 2W-CAL rats, there was no accumulation of ubiquitinated proteins compared with that for the corresponding Sham rats, suggesting that cellular protein homeostasis in the viable LV of the 2W-CAL rats was maintained by the induced expression of these HSPs. However, the content of ubiquitinated proteins in the 8W-CAL-Vehicle rats was increased, indicating an impairment of PQC pathways in the viable LV. Taken together, in the compensated heart, the low deacetylase activity of HDAC6 may have caused the dissociation of HSF1 from the HDAC6-HSP90-HSF1 complex, leading to an increase in HSP expression in the viable LV. In contrast, in the failing heart, it is assumed that HSP90 is deacetylated due to markedly elevated HDAC6 activity and HSF1 is not activated, resulting in abolished HSP induction and impairment of protein homeostasis. These findings suggest that alterations in the heat-shock response mediated by an aberrant increase in deacetylase activity of HDAC6 is involved in the development of heart failure. Therefore, we considered that suppression of the increase in HDAC6 activity may prevent cardiac dysfunction. To test this hypothesis, we administered SAHA, a clinically used HDAC inhibitor, from the compensated phase to the heart failure phase after MI. HDAC inhibitors are classified into 4 classes such as hydroxamic acids, benzamides, short-chain fatty acids, and cyclic peptides. Most HDAC inhibitors consist of 3 groups of zinc binding sites, linker, and surface recognition site, and these groups contribute to exert HDAC isoform selectivity.14) The hydroxamic acid-type HDAC inhibitor SAHA is a pan-HDAC inhibitor with high affinity for HDAC1–3 and 6. SAHA is clinically used as a low-toxicity approved drug for the treatment of cutaneous T-cell lymphoma. In this study, we used SAHA because it has a more potent inhibitory effect towards HDAC6 among pan-HDAC inhibitors.19,20) Recently, HDAC inhibitors with enhanced isoform selectivity based on hydroxamic acid structure have been developed. Tubastatin A is well known as an HDAC inhibitor with high selectivity for HDAC6. Tubastatin A is composed of 1,4-phenylene linker, hydroxamic acid, and tricyclic group. Although this linker exerts the selectivity to HDAC6, it makes the compound poorly soluble. In addition, hydroxamic acid derivatives with high selectivity for HDAC isoform including tubastatin A are susceptible to hydrolysis in plasma.38) Therefore, we used SAHA, but not tubastatin A, in this study. We first determined the acetylation level of α-tubulin as an index for HDAC6 deacetylase activity26,27) and found that its acetylation level by SAHA treatment was markedly higher than that by vehicle treatment. These data indicate that daily administration of SAHA may have inhibited HDAC6 activity in the viable LV. On the other hand, we found that SAHA treatment increased the content of HDAC6. This reduced level of HDAC6 activity by SAHA treatment may have resulted in an increase in HDAC6 expression via a feedback system. The contents of the other components of the HDAC6-containing complex, HSP90 and HSF1, were increased in CAL rats compared with those of the Sham rats, but there were no significant differences in the contents of these 2 proteins between vehicle and SAHA treatments in the CAL rats. On the other hand, SAHA treatment after MI increased the acetylation level of HSP90 compared to vehicle treatment. SAHA treatment did not alter the content of HSF1 in 8W-CAL rats; whereas HSF1 translocation to the nucleus was seen, and HSP expression was subsequently increased. In addition, SAHA administration attenuated the accumulation of ubiquitinated proteins compared with that found for the vehicle treatment.
Next, we determined the cardiac function of SAHA-treated rats with MI. SAHA treatment attenuated the decreases in FS and EF in the 8W-CAL-Vehicle rats. Furthermore, the elevation of E/A ratio was also attenuated in the 8W-CAL-SAHA group. These results showed that SAHA treatment attenuated the reduction in systolic and diastolic functions at the 8th week after MI. Such attenuation was capable of lowering the HW/BW ratio, especially the SepW/BW ratio and RVW/BW ratio, of the SAHA-treated CAL rats. The LV Tei index, an index of global cardiac function combining systolic and diastolic function, was also improved by SAHA treatment. The improvement of cardiac parameters in the 8W-CAL-SAHA group was associated with preservation of the SV and CO indices, which are direct indicators of cardiac pump function, during the development of heart failure following MI.
CONCLUSION
In the present study, we showed that treatment of rats with the HDAC inhibitor SAHA from the 2nd to 8th weeks after MI may have enhanced HSF1 translocation to the nucleus through an elevation of the HSP90 acetylation level. Consistently, the reduction in HSP expression and the accumulation of ubiquitinated proteins in the rats with heart failure were alleviated by long-term administration of SAHA. We also found that SAHA treatment preserved cardiac pump function at the 8th week after MI. These findings suggest that the increase in HSP expression by SAHA treatment contributed to the maintenance of protein homeostasis in the infarcted heart, leading to an improvement of cardiac function and an attenuation of the development of heart failure after MI. Since SAHA has an inhibitory effect on HDAC1–3 as well as HDAC6, we cannot rule out the possibility that inhibition of these other HDACs by SAHA treatment may contribute to the induction of HSP expression in the heart after MI. Therefore, further studies using HDAC6-selective inhibitor are necessary to elucidate the therapeutic effect of HDAC6 inhibition for heart failure after MI.
Acknowledgments
We thank Dr. Larry D. Frye for proofreading the English manuscript.
Conflict of Interest
The authors declare no conflict of interest.
REFERENCES
- 1) Willis MS, Patterson C. Proteotoxicity and cardiac dysfunction—Alzheimer’s disease of the heart? N. Engl. J. Med., 368, 455–464 (2013).
- 2) McLendon PM, Robbins J. Proteotoxicity and cardiac dysfunction. Circ. Res., 116, 1863–1882 (2015).
- 3) David R, Franz W-M. From pluripotency to distinct cardiomyocyte subtypes. Physiology, 27, 119–129 (2012).
- 4) Tsukamoto O, Minamino T, Kitakaze M. Functional alterations of cardiac proteasomes under physiological and pathological conditions. Cardiovasc. Res., 85, 339–346 (2010).
- 5) Tannous P, Zhu H, Nemchenko A, Berry JM, Johnstone JL, Shelton JM, Miller FJ Jr, Rothermel BA, Hill JA. Intracellular protein aggregation is a proximal trigger of cardiomyocyte autophagy. Circulation, 117, 3070–3078 (2008).
- 6) McLendon PM, Robbins J. Desmin-related cardiomyopathy: an unfolding story. AJP Hear. Circ. Physiol., 301, H1220–H1228 (2011).
- 7) Pilla E, Schneider K, Bertolotti A. Coping with protein quality control failure. Annu. Rev. Cell Dev. Biol., 33, 439–465 (2017).
- 8) Wang X, Su H, Ranek MJ. Protein quality control and degradation in cardiomyocytes. J. Mol. Cell. Cardiol., 45, 11–27 (2008).
- 9) Kawaguchi Y, Kovacs JJ, McLaurin A, Vance JM, Ito A, Yao TP. The deacetylase HDAC6 regulates aggresome formation and cell viability in response to misfolded protein stress. Cell, 115, 727–738 (2003).
- 10) Boyault C, Sadoul K, Pabion M, Khochbin S. HDAC6, at the crossroads between cytoskeleton and cell signaling by acetylation and ubiquitination. Oncogene, 26, 5468–5476 (2007).
- 11) Aldana-Masangkay GI, Sakamoto KM. The role of HDAC6 in cancer. J. Biomed. Biotechnol., 2011, 1–10 (2011).
- 12) Li Y, Shin D, Kwon SH. Histone deacetylase 6 plays a role as a distinct regulator of diverse cellular processes. FEBS J., 280, 775–793 (2013).
- 13) Richter-Landsberg C, Leyk J. Inclusion body formation, macroautophagy, and the role of HDAC6 in neurodegeneration. Acta Neuropathol., 126, 793–807 (2013).
- 14) de Ruijter AJM, van Gennip AH, Caron HN, Kemp S, van Kuilenburg ABP. Histone deacetylases (HDACs): characterization of the classical HDAC family. Biochem. J., 370, 737–749 (2003).
- 15) Zhang Y, Gilquin B, Khochbin S, Matthias P. Two catalytic domains are required for protein deacetylation. J. Biol. Chem., 281, 2401–2404 (2006).
- 16) Hook SS, Orian A, Cowley SM, Eisenman RN. Histone deacetylase 6 binds polyubiquitin through its zinc finger (PAZ domain) and copurifies with deubiquitinating enzymes. Proc. Natl. Acad. Sci. U.S.A., 99, 13425–13430 (2002).
- 17) Boyault C, Zhang Y, Fritah S, Caron C, Gilquin B, Kwon SH, Garrido C, Yao TP, Vourc’h C, Matthias P, Khochbin S. HDAC6 controls major cell response pathways to cytotoxic accumulation of protein aggregates. Genes Dev., 21, 2172–2181 (2007).
- 18) Pernet L, Faure V, Gilquin B, Dufour-Guerin S, Khochbin S, Vourc’h C. HDAC6-ubiquitin interaction controls the duration of HSF1 activation after heat shock. Mol. Biol. Cell, 25, 4187–4194 (2014).
- 19) Arts J, Angibaud P, Mariën A, Floren W, Janssens B, King P, Van Dun J, Janssen L, Geerts T, Tuman RW, Johnson DL, Andries L, Jung M, Janicot M, Van Emelen K. R306465 is a novel potent inhibitor of class I histone deacetylases with broad-spectrum antitumoral activity against solid and haematological malignancies. Br. J. Cancer, 97, 1344–1353 (2007).
- 20) Moriya S, Komatsu S, Yamasaki K, Kawai Y, Kokuba H, Hirota A, Che XF, Inazu M, Gotoh A, Hiramoto M, Miyazawa K. Targeting the integrated networks of aggresome formation, proteasome, and autophagy potentiates ER stress-mediated cell death in multiple myeloma cells. Int. J. Oncol., 46, 474–486 (2015).
- 21) Sanbe A, Tanonaka K, Hanaoka Y, Katoh T, Takeo S. Regional energy metabolism of failing hearts following myocardial infarction. J. Mol. Cell. Cardiol., 25, 995–1013 (1993).
- 22) Yoshida H, Takahashi M, Koshimizu M, Tanonaka K, Oikawa R, Toyo-oka T, Takeo S. Decrease in sarcoglycans and dystrophin in failing heart following acute myocardial infarction. Cardiovasc. Res., 59, 419–427 (2003).
- 23) Marunouchi T, Abe Y, Murata M, Inomata S, Sanbe A, Takagi N, Tanonaka K. Changes in small heat shock proteins HSPB1, HSPB5 and HSPB8 in mitochondria of the failing heart following myocardial infarction in rats. Biol. Pharm. Bull., 36, 529–539 (2013).
- 24) Tei C. new non-invasive index for combined systolic and diastolic ventricular function. J. Cardiol., 26, 135–136 (1995).
- 25) Marunouchi T, Murata M, Takagi N, Tanonaka K. Possible involvement of phosphorylated heat-shock factor-1 in changes in heat shock protein 72 induction in the failing rat heart following myocardial infarction. Biol. Pharm. Bull., 36, 1332–1340 (2013).
- 26) Zhang Y, Li N, Caron C, Matthias G, Hess D, Khochbin S, Matthias P. HDAC-6 interacts with and deacetylates tubulin and microtubules in vivo. EMBO J., 22, 1168–1179 (2003).
- 27) Du Y, Seibenhener ML, Yan J, Jiang J, Wooten MC. aPKC phosphorylation of HDAC6 results in increased deacetylation activity. PLOS ONE, 10, e0123191 (2015).
- 28) Kovacs JJ, Murphy PJM, Gaillard S, Zhao X, Wu JT, Nicchitta CV, Yoshida M, Toft DO, Pratt WB, Yao TP. HDAC6 regulates Hsp90 acetylation and chaperone-dependent activation of glucocorticoid receptor. Mol. Cell, 18, 601–607 (2005).
- 29) Zou J, Guo Y, Guettouche T, Smith DF, Voellmy R. Repression of heat shock transcription factor HSF1 activation by HSP90 (HSP90 complex) that forms a stress-sensitive complex with HSF1. Cell, 94, 471–480 (1998).
- 30) Sarge KD, Murphy SP, Morimoto RI. Activation of heat shock gene transcription by heat shock factor 1 involves oligomerization, acquisition of DNA-binding activity, and nuclear localization and can occur in the absence of stress. Mol. Cell. Biol., 13, 1392–1407 (1993).
- 31) Morimoto RI. Regulation of the heat shock transcriptional response: cross talk between a family of heat shock factors, molecular chaperones, and negative regulators. Genes Dev., 12, 3788–3796 (1998).
- 32) Salemi LM, Almawi AW, Lefebvre KJ, Schild-Poulter C. Aggresome formation is regulated by RanBPM through an interaction with HDAC6. Biol. Open, 3, 418–430 (2014).
- 33) Tao H, Yang JJ, Shi KH, Li J. Epigenetic factors MeCP2 and HDAC6 control α-tubulin acetylation in cardiac fibroblast proliferation and fibrosis. Inflamm. Res., 65, 415–426 (2016).
- 34) Yan J, Seibenhener ML, Calderilla-Barbosa L, Diaz-Meco MT, Moscat J, Jiang J, Wooten MW, Wooten MC. SQSTM1/p62 interacts with HDAC6 and regulates deacetylase activity. PLOS ONE, 8, e76016 (2013).
- 35) Yang Y, Ran J, Liu M, Li D, Li Y, Shi X, Meng D, Pan J, Ou G, Aneja R, Sun SC, Zhou J. CYLD mediates ciliogenesis in multiple organs by deubiquitinating Cep70 and inactivating HDAC6. Cell Res., 24, 1342–1353 (2014).
- 36) Kato K, Shinohara H, Kurobe N, Inaguma Y, Shimizu K, Ohshima K. Tissue distribution and developmental profiles of immunoreactive alpha B crystallin in the rat determined with a sensitive immunoassay system. Biochim. Biophys. Acta, 1074, 201–208 (1991).
- 37) Kato K, Shinohara H, Goto S, Inaguma Y, Morishita R, Asano T. Copurification of small heat shock protein with alpha B crystallin from human skeletal muscle. J. Biol. Chem., 267, 7718–7725 (1992).
- 38) Butler KV, Kalin J, Brochier C, Vistoli G, Langley B, Kozikowski AP. Rational design and simple chemistry yield a superior, neuroprotective hdac6 inhibitor, tubastatin A. J. Am. Chem. Soc., 132, 10842–10846 (2010).