Abstract
Protein expression in human umbilical vein endothelial cells (HUVECs) is a useful indicator of maternal condition and the intrauterine environment during pregnancy. Therefore, we investigated protein expression in HUVECs obtained from patients with gestational diabetes mellitus (GDM). HUVECs were prepared from the umbilical cords of GDM patients and controls who underwent planned cesarean section between 2013 and 2014 at Teikyo University Hospital (Tokyo, Japan). There were no differences in blood glucose levels between the GDM patients and controls at admission. However, pre-pregnancy body mass index (BMI) was higher in GDM patients, although the changes in gestational BMI were smaller during hospitalization. To evaluate the state of the endothelium, we examined the protein expression levels of vascular adhesion molecule-1 (VCAM-1), intercellular adhesion molecule-1, thrombomodulin (TM), endothelial nitric oxide synthase, plasminogen activator inhibitor-1 (PAI-1), cyclooxygenase-2 (COX-2), and VE-cadherin, which are altered by various factors in endothelial tissue. VCAM-1, PAI-1, and COX-2 expression was higher in HUVECs from patients with GDM than the controls. Because the pre-pregnancy BMI was higher in GDM patients, we examined the relationship between BMI and protein expression. However, the expression levels of these proteins were not correlated with pre-pregnancy BMI and were higher in HUVECs from BMI-matched GDM patients than from BMI-matched controls. Intriguingly, TM expression was also higher in HUVECs from BMI-matched GDM patients. Thus, expression of VCAM-1, PAI-1, COX-2, and TM may reflect certain factors in the intrauterine environment that are altered in hospitalized GDM patients with controlled body weight.
INTRODUCTION
The maternal intrauterine environment is affected by various physical conditions, such as energy metabolism, sleep quality, and inflammation,1) and is considered to be one of the most important determinants of the development of illnesses upon reaching adulthood, including cardiovascular diseases, diabetes mellitus, hypertension, and dyslipidemia.2) Therefore, identifying factors to assess the condition of the intrauterine environment may be useful for the prediction and prevention of future chronic diseases in children. However, conventional intrauterine environment assessment methods, such as biopsy, are invasive and improved methods have yet to be established.
Several recent studies have investigated the use of the umbilical cord, which develops within the intrauterine environment together with the fetus and can be collected noninvasively after delivery. Reports have shown that promoter DNA methylation of some genes in the umbilical cord is related to fetal growth and the mother’s physical condition during pregnancy.3,4) Moreover, several studies have found that mRNA or protein expression levels in human umbilical vein endothelial cells (HUVECs) differed between controls and patients with hypertensive disorder,5) hyperglycemic disorder,6) and hypercholesterolemia,7) although additional evidence is required. Given that blood from the mother passes through the umbilical vein, the mother’s physical condition may greatly influence HUVECs. Therefore, an analysis of protein expression levels in the umbilical cord and HUVECs may represent a useful tool for assessing the intrauterine condition during pregnancy.
Gestational diabetes mellitus (GDM) is defined as glucose intolerance with onset or first recognition during pregnancy. The prevalence of GDM in women is approximately 14.3%.8) Moreover, infant body weight and the risk of future chronic disease development are high in the children of GDM patients.9) However, the intrauterine environment of patients with GDM remains unclear. Thus, measurement of protein expression in HUVECs obtained from GDM patients may enable assessment of the maternal condition and intrauterine environment during pregnancy. Therefore, in this study, we examined whether there were differences in protein expression levels between HUVECs obtained from GDM patients and those from controls.
MATERIALS AND METHODS
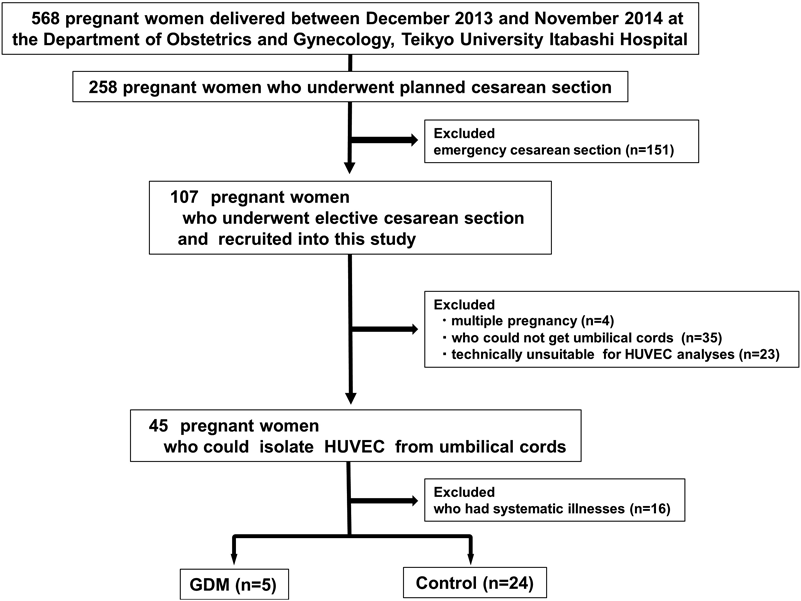
Participants and Data Collection (Fig. 1)A total of 568 pregnant women delivered between December 2013 and November 2014 at the Department of Obstetrics and Gynecology, Teikyo University Itabashi Hospital (Tokyo, Japan). Among these patients, 258 were hospitalized for planned cesarean section (e.g., due to previous cesarean section). After excluding 151 patients who had an emergency operation, 107 patients underwent elective surgery and were recruited into this study. We further excluded four patients with multiple pregnancies, 35 patients whose fresh cords were not sampled appropriately due to a lack of human resources during nighttime operation, and 23 patients whose cords were damaged by needle insertions.
The remaining 45 umbilical cords were undamaged, although we excluded 16 from patients with systematic illnesses, such as pregnancy-induced hypertension (blood pressure of 140/90 mmHg or higher), asthma, and cardiomyopathy. GDM refers to hyperglycemic disorder during pregnancy and was diagnosed using a two-step approach: an initial screening of plasma glucose concentration 1 h after a 50-g glucose challenge test, followed by a diagnostic test using an oral glucose load of 75 g in the subset of pregnant women who exceeded the threshold glucose concentration (>140 mg/dL; 7.8 mmol/L)10,11) before admission to Teikyo University Itabashi Hospital. Pregnant women whose hyperglycemia was at the diagnostic level of diabetes were categorized as having overt diabetes in pregnancy.10) The remaining 29 umbilical cords were divided into 24 controls and 5 GDM cases. The present study was approved by the ethical committee of Teikyo University (No. 12-081 and No. 14-123) and all participants provided informed consent.
Preparation of HUVECsUmbilical cords collected immediately following delivery within gestational weeks 28–40 were briefly and gently washed with sterile phosphate buffered saline (PBS). Each umbilical cord was washed twice with PBS and filled with Dulbecco’s modified Eagle’s medium (DMEM) (Life Technologies, Carlsbad, CA, U.S.A.) containing 1.0 g/L D-glucose and 0.5 mg/mL collagenase (Wako, Osaka, Japan), and incubated for 15 min at 37°C. The cords were gently squeezed to collect collagenase-dissolved material and flushed DMEM. The collected medium was centrifuged (433 × g for 5 min), and 10 mL of flushed DMEM was added to the sediment followed by centrifugation using the same protocol. Finally, the sediments were resuspended in DMEM supplemented with 20% defined fetal bovine serum (FBS) (Biowest, Nuaillé, France), 100 units/mL penicillin, and 100 µg/mL streptomycin (Sigma-Aldrich, St. Louis, MO, U.S.A.) without growth factors.
Then, HUVECs were cultured in dishes with DMEM containing 20% FBS for 24 h at 37°C under 5% CO2 to remove nonadherent cells such as erythrocytes. Cells were washed twice with cold PBS and then scraped in the PBS. Scraped cells were centrifuged (800 × g for 5 min at 4°C) and the sediments were lysed in TNE buffer (1 M Tris–HCl, pH 7.4, 150 mM NaCl, and 1 mM ethylenediaminetetraacetic acid) with 1% Triton X-100 and a phosphatase and protease inhibitor cocktail (Roche Applied Science, Mannheim, Germany) followed by sonication for 10 s (5 times at 2-s intervals) (UR-21P; TOMY, Tokyo, Japan) after 2 cycles of freezing at −80°C and thawing at room temperature. Lysates were collected from the supernatant after centrifugation (800 × g for 5 min at 4°C).
ImmunoblottingLysates prepared from HUVECs underwent immunoblot analysis to determine protein expression. Before immunoblotting, the protein content of the lysates was determined with the Lowry method using the DC Protein Assay Kit (Bio-Rad, Hercules, CA, U.S.A.). Identical amounts of protein (8–10 µg) from each lysate were subjected to 8.5–10% sodium dodecyl sulfate polyacrylamide gel electrophoresis. Thereafter, the separated proteins were transferred onto a polyvinylidene fluoride membrane (Immobilon-P; Merck Millipore, Billerica, MA, U.S.A.) using the ATTO semi-dry blotting system (ATTO, Tokyo, Japan). The membrane was blocked for 1 h with 25 mM Tris-buffered saline (TBS) containing 0.5% or 1% skim milk (Wako) and 0.05% Tween 20 (Wako). Immunoblotting analysis was performed with specific antibodies directed against intercellular adhesion molecule-1 (ICAM-1; #4915; Cell Signaling Technology, Danvers, MA, U.S.A.), endothelial nitric oxide synthase (eNOS; 610296; BD Biosciences, San Diego, CA, U.S.A.), thrombomodulin (TM; #HPA002982; Sigma-Aldrich), vascular adhesion molecule-1 (VCAM-1; sc-1504; Santa Cruz Biotechnology, Santa Cruz, CA, U.S.A.), plasminogen activator inhibitor-1 (PAI-1; #ASHPAI-GF; Molecular Innovations, Novi, MI, U.S.A.), cyclooxygenase-2 (COX-2; Cayman Chemical, Ann Arbor, MI, U.S.A.), VE-cadherin (#2500; Cell Signaling Technology), and β-actin (#4967; Cell Signaling Technology). The membrane was washed with 0.05% Tween 20–TBS and incubated with anti-rabbit (#7074; Cell Signaling Technology) or anti-mouse (A9044; Sigma-Aldrich) immunoglobulin G antibody coupled with horseradish peroxidase. The membrane was visualized via enhanced chemiluminescence using ImmunoStar LD reagent (Wako). The results were analyzed using an Image Station 4000MM (Kodak, Rochester, NY, U.S.A.) and the intensity of each signal was quantified using ImageJ software (National Institutes of Health, Bethesda, MD, U.S.A.). ICAM-1, eNOS, TM, VCAM-1, PAI-1, COX-2, and VE-cadherin expression levels were normalized to that of β-actin. The values were expressed as relative to standard samples such as one of control HUVECs (for ICAM-1, eNOS, TM and VE-cadherin) or the HUVECs excluded from this study (for PAI-1, COX-2 and VCAM-1).
Patient DataData retrieved from electronic medical records included age, parity, body mass index (BMI) during pre-pregnancy, admission, and delivery, and gestational age at birth. Pre-pregnancy body weight was determined retrospectively during the first prenatal visit. BMI was calculated by dividing the weight (kg) by the square of the height (m2). Changes in gestational BMI were calculated by subtracting the pre-pregnancy BMI from that at delivery. Laboratory data evaluated at admission included C reactive protein (CRP), white blood cell (WBC) count, activated partial thromboplastin time (APTT), prothrombin time and international normalized ratio (PT-INR), D-dimer, fibrinogen, and blood glucose (BG). Blood gas analysis (BGA) of umbilical cord blood, including oxygen (PaO2) and carbon dioxide (PaCO2) levels, as well as oxygen saturation and pH, was performed at delivery. Items associated with the infant included placenta weight, birth weight, and sex.
Statistical AnalysisData from GDM patients and controls, including HUVEC protein expression, were compared statistically using a t-test and chi-squared test or Fisher’s exact test for continuous and categorical variables, respectively. All analyses were performed using Statistical Analysis System ver. 9.3 (SAS Institute, Cary, NC, U.S.A.), and the significance level was set to 0.05.
RESULTS
Table 1 shows the characteristics of the GDM patients and controls. There were no differences in maternal age, parity, or gestational weeks between the two groups. Although no differences were observed in infant-associated variables (e.g., placenta weight, birth weight, or gender) and BMI at delivery, pre-pregnancy BMI was higher in patients with GDM than in the controls. Meanwhile, patients with GDM exhibited small changes in gestational BMI, because BMI was reduced during hospitalization in two GDM patients whose pre-pregnancy BMI was over 30. In addition, no differences were observed in laboratory data, including blood glucose at admission or umbilical vein gas analysis data, between the GDM patients and controls at delivery (Table 2).
Table 1. Patients’ Characteristics between Gestational Diabetes Mellitus Group and Control Group
| All (n = 29) | GDM (n = 5) | Control (n = 24) | p |
|---|
| Mother |
| Age | 34.5 ± 4.41 (27–45) | 35.4 ± 6.95 (28–43) | 34.4 ± 4.22 (27–45) | 0.64 |
| Parity | | | | 0.44 |
| Nullparious | 6 (21.4%) | 2 (40%) | 4 (18.2%) | |
| 2 | 16 (57.2%) | 2 (40%) | 13 (59.1%) | |
| 3 | 6 (21.4%) | 1 (20%) | 5 (22.7%) | |
| Gestational weeks | 37.2 ± 1.34 (32.1–38.1) | 36.9 ± 0.99 (35.2–37.7) | 37.3 ± 0.58 (32.1–38.1) | 0.58 |
| Pre-pregnancy_BMI | 22.2 ± 4.3 (15.2–34.2) | 26.1 ± 6.0 (20.9–34.2) | 21.3 ± 3.5 (15.2–28.0) | 0.02 |
| BMI at delivery | 29.5 ± 3.9 (15.2–34.2) | 29.5 ± 2.8 (25.2–32.8) | 29.5 ± 4.2 (18.3–34.7) | 0.99 |
| BMI change | 3.87 ± 2.20 (−2.66–6.37) | 1.72 ± 3.81 (−2.66–4.93) | 4.40 ± 1.23 (1.18–6.37) | 0.01 |
| Child indicators |
| Placenta_wt | 548.6 ± 103.5 (425–860) | 610.0 ± 63.2 (540–680) | 534.7 ± 106.7 (425–860) | 0.14 |
| Infant_BW | 2883.2 ± 336.9 (2248–3416) | 2861.6 ± 293.9 (2506–3416) | 2888.1 ± 352.0 (2248–3416) | 0.88 |
| Infant_sex |
| Male | 14 (50.0%) | 4 (80%) | 10 (43.5%) | 0.15 |
| Female | 14 (50.0%) | 1 (20%) | 13 (56.5%) | |
Table 2. Difference in Laboratory Data and Data from Umbilical Cord Vein Gas Analyses between Gestational Diabetes Mellitus Group and Control Group
| All (n = 29) | GDM (n = 5) | Control (n = 24) | p |
|---|
| Clinical data |
| Laboratory data at the time of admission |
| CRP | 0.16 ± 0.16 (0.02–0.67) | 0.09 ± 0.37 (0.02–0.11) | 0.17 ± 0.17 (0.02–0.67) | 0.30 |
| WBC | 78.0 ± 21.2 (47–144) | 80.6 ± 28.5 (58–129) | 77.4 ± 20.1 (47–144) | 0.77 |
| APTT | 28.3 ± 1.49 (25.6–32.2) | 28.1 ± 0.69 (27.3–28.9) | 28.4 ± 1.61 (25.6–32.2) | 0.75 |
| PT_INR | 0.98 ± 0.045 (0.89–1.09) | 0.99 ± 0.060 (0.93–1.09) | 0.98 ± 0.04 (0.89–1.08) | 0.60 |
| D-dimer | 2.00 ± 1.19 (0.8–6.5) | 2.04 ± 0.86 (0.8–2.9) | 1.99 ± 1.27 (0.9–6.5) | 0.93 |
| Fibrinogen | 457.2 ± 48.9 (367–564) | 455.2 ± 40.3 (432–515) | 457.6 ± 51.2 (367–564) | 0.92 |
| BG | 80.1 ± 11.4 (61–119) | 79.8 ± 6.13 (71–84) | 80.2 ± 12.4(61–119) | 0.95 |
| Umbilical cord vein gas analyses |
| paO2 | 36.6 ± 11.1 (19.6–76.3) | 41.9 ± 9.74 (38.9–48.1) | 35.4 ± 11.2 (19.6–76.3) | 0.24 |
| paCO2 | 40.1 ± 9.59 (14.4–52.1) | 41.9 ± 6.95 (31.1–48.1) | 39.7 ± 10.3 (14.4–52.1) | 0.66 |
| OsSAT | 73.3 ± 14.7 (26.0–96.1) | 77.0 ± 18.9 (44.7–90.2) | 72.4 ± 14.0 (26.0–96.1) | 0.54 |
| pH | 7.34 ± 0.040 (7.27–7.44) | 7.32 ± 0.033 (7.27–7.35) | 7.34 ± 0.041 (7.27–7.44) | 0.28 |
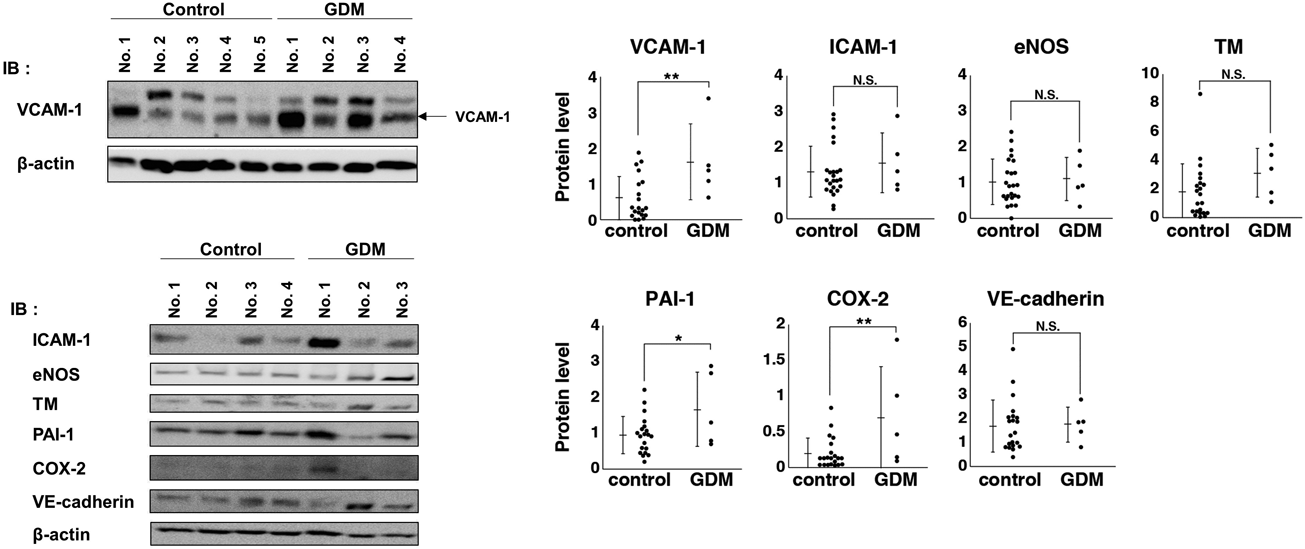
Figure 2 shows the protein expression in HUVECs obtained from the GDM patients and controls. To evaluate the state of the endothelium, we examined the expression levels of VCAM-1, ICAM-1, eNOS, TM, PAI-1, COX-2, and VE-cadherin, which are involved in inflammation, immune response, oxidative stress, and thrombosis in endothelial tissue12,13) and are altered by various stimuli.14–18) We found that VCAM-1 (p = 0.009), PAI-1 (p = 0.04), and COX-2 (p = 0.008) levels were higher in HUVECs obtained from patients with GDM than from the controls. Meanwhile, ICAM-1 and TM protein levels tended to be higher, albeit not significantly, in HUVECs obtained from GDM patients.
Next, we examined the patient factors that affected VCAM-1, PAI-1, and COX-2 expression. Because pre-pregnancy BMI was significantly higher in GDM patients (Table 1), we examined the relationship between BMI and protein expression of VCAM-1, PAI-1, and COX-2. The expression levels of these proteins were not correlated with pre-pregnancy BMI, BMI at delivery, or changes in BMI in the GDM patients or controls (Table 3), suggesting that differences in BMI are not explanatory factors for the elevated expression of VCAM-1, PAI-1, and COX-2.
Table 3. Correlation Analysis between Pre-pregnancy BMI or BMI at Delivery and Protein Expression of Gestational Diabetes Mellitus Group and Control Group
| Pre-pregnancy BMI | BMI at delivery | BMI change |
|---|
| Spearman correlation index | p | Spearman correlation index | p | Spearman correlation index | p |
|---|
| VCAM-1 |
| Control | 0.3386 | 0.16 | 0.3775 | 0.14 | 0.1569 | 0.55 |
| GDM | 0.5000 | 0.39 | 0.1000 | 0.87 | 0.0000 | 1.00 |
| PAI-1 |
| Control | 0.0912 | 0.71 | −0.1000 | 0.71 | −0.3652 | 0.15 |
| GDM | −0.7000 | 0.19 | 0.6000 | 0.28 | 0.8000 | 0.10 |
| COX-2 |
| Control | 0.1158 | 0.63 | 0.1250 | 0.63 | −0.3284 | 0.20 |
| GDM | −0.1000 | 0.87 | 1.0000 | 0.11 | 0.9000 | 0.37 |
To confirm the results, the GDM patients and controls were selected on the basis of a standard BMI (18.50–24.99 kg/m2). There were no differences in patient characteristics or clinical data between the two groups, excluding placenta weight and paO2 (Table 4). Furthermore, we examined the protein expression levels in BMI-matched GDM patients and controls, and found that the expression levels of VCAM-1 (p = 0.03), PAI-1 (p = 0.004), COX-2 (p = 0.004), and TM (p = 0.02) were elevated in BMI-matched GDM patients (Fig. 3). These results suggest that elevated expression of VCAM-1, PAI-1, COX-2, and TM may be caused by certain factors other than obesity that are altered in hospitalized GDM patients.
Table 4. Patients’ Characteristics and Clinical Data between BMI-Matched Gestational Diabetes Mellitus Group and Control Group
| GDM (n = 3) | Control (n = 12) | p |
|---|
| Mother |
| Pre-pregnancy_BMI | 21.9 ± 1.0 (20.9–23.0) | 21.5 ± 1.6 (18.7–23.7) | 0.72 |
| BMI at delivery | 30.9 ± 2.0 (28.9–32.8) | 30.3 ± 2.6 (24.0–34.0) | 0.75 |
| BMI change | 4.50 ± 0.47 (4.00–4.93) | 4.39 ± 1.21 (2.64–6.37) | 0.89 |
| Age | 36.3 ± 7.64 (28–43) | 36.0 ± 4.13 (31–45) | 0.92 |
| Parity | | | 0.83 |
| Nullparious | 1 (33.3%) | 4 (33.3%) | |
| 2 | 1 (33.3%) | 4 (33.3%) | |
| 3 | 1 (33.3%) | 4 (33.3%) | |
| Gestational weeks | 37.0 ± 1.87 (32.1–38.0) | 37.5 ± 0.41 (37.0–37.7) | 0.66 |
| Child indicators |
| Placenta_wt | 590.0 ± 70.0 (540–670) | 504.0 ± 59.3 (425–593) | 0.04 |
| Infant_BW | 2997.3 ± 283.9 (2670–3416) | 2798.8 ± 339.3 (2248–3352) | 0.37 |
| Infant_sex |
| Male | 3 (100%) | 6 (50.0%) | 0.13 |
| Female | 0 (0%) | 6 (50.0%) | |
| Clinical data |
| Laboratory data at the time of admission |
| CRP | 0.10 ± 0.01 (0.1–0.11) | 0.13 ± 0.11 (0.03–0.33) | 0.62 |
| WBC | 94.3 ± 30.1 (74–129) | 79.8 ± 11.3 (62–94) | 0.17 |
| APTT | 28.3 ± 0.85 (27.3–28.9) | 28.2 ± 1.78 (25.6–32.2) | 0.85 |
| PT_INR | 1.01 ± 0.07 (0.96–1.09) | 0.98 ± 0.04 (0.93–1.08) | 0.26 |
| D-dimer | 1.70 ± 0.95 (0.8–2.7) | 1.84 ± 0.89 (1.0–3.7) | 0.81 |
| Fibrinogen | 465.7 ± 43.7 (432–515) | 447.3 ± 35.1 (395–487) | 0.45 |
| BG | 79.7 ± 7.50 (71–84) | 83.1 ± 16.4 (61–119) | 0.74 |
| Umbilical cord vein gas analyses |
| paO2 | 45.0 ± 5.28 (38.9–48.1) | 31.8 ± 6.16.2 (19.6–39.8) | 0.005 |
| paCO2 | 44.6 ± 4.96 (38.9–48.1) | 39.3 ± 12.3 (14.4–49.6) | 0.50 |
| OsSAT | 83.8 ± 5.83 (78.8–82.4) | 68.5 ± 15.9 (26.0–85.1) | 0.14 |
| pH | 7.31 ± 0.045 (7.27–7.35) | 7.33 ± 0.042 (7.27–7.41) | 0.61 |
DISCUSSION
The present study demonstrated that expression of VCAM-1, PAI-1, and COX-2 was high in HUVECs obtained from patients with GDM, even though body weight was controlled during hospitalization. Moreover, expression of these proteins and TM was higher in HUVECs from BMI-matched GDM patients than from BMI-matched controls. Therefore, elevated expression of VCAM-1, PAI-1, COX-2, and TM may reflect certain factors in the intrauterine environment that are altered by GDM, but not obesity, during pregnancy.
Although there were no differences in most of the laboratory data at admission and patient characteristics at delivery, paO2 levels and placenta weight were higher in BMI-matched GDM patients than in the controls, consistent with a previous study.19) However, these factors were not correlated with the expression of VCAM-1, PAI-1, COX-2, or TM (data not shown), raising the question of the identity of the factor inducing expression of VCAM-1, PAI-1, COX-2, and TM in HUVECs. One possibility is that some factors were temporally or continuously altered during hospitalization but within the normal range at admission. Another possibility is that protein expression in HUVECs was affected by factors that had been altered during the early stage of pregnancy, and these effects remained at delivery, because the developmental origins of health and disease hypothesis proposes that the intrauterine environment can affect the health of offspring even decades later.20)
In vitro studies have reported that high glucose conditions induce VCAM-1 and COX-2 expression in cultured endothelial cells.21,22) However, TM expression is reduced under high glucose conditions.23) Therefore, glucose concentrations alter the expression of these proteins. In this study, although the fasting blood glucose levels in patients with GDM were within the normal range at admission, they were diagnosed with GDM before admission to Teikyo University Hospital, and the mean blood glucose levels during the oral glucose tolerance test (OGTT) were 163 ± 35.4 mg/dL at 60 min and 152 ± 37.2 mg/dL at 120 min (n = 4). Therefore, temporarily high glucose conditions may repeatedly occur after meals during hospitalization. Thus, the high expression of VCAM-1 and COX-2 may reflect previous temporarily, but not continuously, high glucose states before or during hospitalization.
Another possible factor is inflammation. Reports have shown that high glucose concentrations are closely associated with induction of the inflammatory response in vivo and in vitro,24,25) and that VCAM-1, PAI-1, and COX-2 expression is induced by inflammatory cytokines such as tumor necrosis factor (TNF)-α or interleukin (IL)-1.26,27) By contrast, TM expression is reduced by TNF-α and IL-1.28) In the present study, although the patients with GDM had low CRP levels at admission (Table 2), a temporary inflammatory response might have occurred in the umbilical vein of pregnant mothers before or during hospitalization, since the blood glucose levels during the OGTT were high in the GDM patients. Although the high expression of TM cannot be explained by a high glucose level or inflammation, further analyses of the relationships between VCAM-1, PAI-1, and COX-2 expression and inflammatory mediators such as TNF-α and IL-1 should be conducted to assess the effects of the past inflammatory state of the mother and intrauterine environment via the umbilical cord.
The major strength of the present study lies in the use of fresh umbilical cords; however, this study had several limitations. First, in addition to the small sample size, we did not examine mRNA levels, but rather measured protein expression via immunoblotting. Therefore, because expression patterns of mRNA and protein may not match, the results of the present study require careful interpretation. Second, for technical reasons, we artificially cultured HUVECs for 24 h to remove contamination of blood cells and obtain sufficient sample for the protein expression analysis. Although this may have affected some of the results, all samples were compared under the same conditions. Finally, we could not monitor blood glucose levels and other laboratory data during hospitalization. Therefore, although our GDM patients were well controlled in terms of blood glucose levels and other factors at admission, alteration of certain factors may have occurred during hospitalization. Thus, monitoring patient parameters during hospitalization could clarify the factors related to the elevated expression of VCAM-1, PAI-1, COX-2, and TM.
In conclusion, this study demonstrates for the first time that expression of VCAM-1, PAI-1, COX-2, and TM is high in HUVECs obtained from hospitalized GDM patients with controlled body weight. Further analyses of protein expression in HUVECs together with blood glucose and cytokine levels could clarify the factors that affect the intrauterine environment of GDM patients during pregnancy.
Acknowledgments
We thank Dr. H. Yoshida (Kanagawa University of Human Services) for advice regarding the interpretation of patient data.
Conflict of Interest
The authors declare no conflict of interest.
REFERENCES
- 1) Wu G, Bazer FW, Cudd TA, Meininger CJ, Spencer TE. Maternal nutrition and fetal development. J. Nutr., 134, 2169–2172 (2004).
- 2) Godfrey KM, Barker DJ. Fetal nutrition and adult disease. Am. J. Clin. Nutr., 71 (Suppl.), 1344S–1352S (2000).
- 3) Gemma C, Sookoian S, Alvariñas J, García SI, Quintana L, Kanevsky D, González CD, Pirola CJ. Maternal pregestational BMI is associated with methylation of the PPARGC1A promoter in newborns. Obesity, 17, 1032–1039 (2009).
- 4) Godfrey KM, Sheppard A, Gluckman PD, Lillycrop KA, Burdge GC, McLean C, Rodford J, Slater-Jefferies JL, Garratt E, Crozier SR, Emerald BS, Gale CR, Inskip HM, Cooper C, Hanson MA. Epigenetic gene promoter methylation at birth is associated with child’s later adiposity. Diabetes, 60, 1528–1534 (2011).
- 5) Gu Y, Lewis DF, Zhang Y, Groome LJ, Wang Y. Increased superoxide generation and decreased stress protein Hsp90 expression in human umbilical cord vein endothelial cells (HUVECs) from pregnancies complicated by preeclampsia. Hypertens. Pregnancy, 25, 169–182 (2006).
- 6) Ambra R, Manca S, Palumbo MC, Leoni G, Natarelli L, De Marco A, Consoli A, Pandolfi A, Virgili F. Transcriptome analysis of human primary endothelial cells (HUVEC) from umbilical cords of gestational diabetic mothers reveals candidate sites for an epigenetic modulation of specific gene expression. Genomics, 103, 337–348 (2014).
- 7) Leiva A, de Medina CD, Salsoso R, Sáez T, San Martín S, Abarzúa F, Farías M, Guzmán-Gutiérrez E, Pardo F, Sobrevia L. Maternal hypercholesterolemia in pregnancy associates with umbilical vein endothelial dysfunction: role of endothelial nitric oxide synthase and arginase II. Arterioscler. Thromb. Vasc. Biol., 33, 2444–2453 (2013).
- 8) Waters TP, Dyer AR, Scholtens DM, Dooley SL, Herer E, Lowe LP, Oats JJ, Persson B, Sacks DA, Metzger BE, Catalano PM, HAPO Cooperative Study Research Group. Maternal and neonatal morbidity for women who would be added to the diagnosis of GDM using IADPSG criteria: a secondary analysis of the hyperglycemia and adverse pregnancy outcome study. Diabetes Care, 39, 2204–2210 (2016).
- 9) Boney CM, Verma A, Tucker R, Vohr BR. Metabolic syndrome in childhood: association with birth weight, maternal obesity, and gestational diabetes mellitus. Pediatrics, 115, e290–e296 (2005).
- 10) Weinert LS. International Association of Diabetes and Pregnancy Study Groups recommendations on the diagnosis and classification of hyperglycemia in pregnancy: comment to the International Association of Diabetes and Pregnancy Study Groups Consensus Panel. Diabetes Care, 33, e97, author reply, e98 (2010).
- 11) Minakami H, Maeda T, Fujii T, Hamada H, Iitsuka Y, Itakura A, Itoh H, Iwashita M, Kanagawa T, Kanai M, Kasuga Y, Kawabata M, Kobayashi K, Kotani T, Kudo Y, Makino Y, Matsubara S, Matsuda H, Miura K, Murakoshi T, Murotsuki J, Ohkuchi A, Ohno Y, Ohshiba Y, Satoh S, Sekizawa A, Sugiura M, Suzuki S, Takahashi T, Tsukahara Y, Unno N, Yoshikawa H. Guidelines for obstetrical practice in Japan: Japan Society of Obstetrics and Gynecology (JSOG) and Japan Association of Obstetricians and Gynecologists (JAOG) 2014 edition. J. Obstet. Gynaecol. Res., 40, 1469–1499 (2014).
- 12) Scarpati EM, Sadler JE. Regulation of endothelial cell coagulant properties. Modulation of tissue factor, plasminogen activator inhibitors, and thrombomodulin by phorbol 12-myristate 13-acetate and tumor necrosis factor. J. Biol. Chem., 264, 20705–20713 (1989).
- 13) Higashi Y, Noma K, Yoshizumi M, Kihara Y. Endothelial function and oxidative stress in cardiovascular diseases. Circ. J., 73, 411–418 (2009).
- 14) Altannavch TS, Roubalová K, Kucera P, Andel M. Effect of high glucose concentrations on expression of ELAM-1, VCAM-1 and ICAM-1 in HUVEC with and without cytokine activation. Physiol. Res., 53, 77–82 (2004).
- 15) Vaughan DE. PAI-1 and atherothrombosis. J. Thromb. Haemost., 3, 1879–1883 (2005).
- 16) Vestweber D. VE-cadherin: the major endothelial adhesion molecule controlling cellular junctions and blood vessel formation. Arterioscler. Thromb. Vasc. Biol., 28, 223–232 (2008).
- 17) Iantorno M, Campia U, Di Daniele N, Nistico S, Forleo GB, Cardillo C, Tesauro M. Obesity, inflammation and endothelial dysfunction. J. Biol. Regul. Homeost. Agents, 28, 169–176 (2014).
- 18) Nan B, Lin P, Lumsden AB, Yao Q, Chen C. Effects of TNF-α and curcumin on the expression of thrombomodulin and endothelial protein C receptor in human endothelial cells. Thromb. Res., 115, 417–426 (2005).
- 19) Kucuk M, Doymaz F. Placental weight and placental weight-to-birth weight ratio are increased in diet- and exercise-treated gestational diabetes mellitus subjects but not in subjects with one abnormal value on 100-g oral glucose tolerance test. J. Diabetes Complications, 23, 25–31 (2009).
- 20) Barrett JR. Programming the future: epigenetics in the context of DOHaD. Environ. Health Perspect., 125, A72 (2017).
- 21) Cosentino F, Eto M, De Paolis P, van der Loo B, Bachschmid M, Ullrich V, Kouroedov A, Delli Gatti C, Joch H, Volpe M, Lüscher TF. High glucose causes upregulation of cyclooxygenase-2 and alters prostanoid profile in human endothelial cells: role of protein kinase C and reactive oxygen species. Circulation, 107, 1017–1023 (2003).
- 22) Quagliaro L, Piconi L, Assaloni R, Da Ros R, Maier A, Zuodar G, Ceriello A. Intermittent high glucose enhances ICAM-1, VCAM-1 and E-selectin expression in human umbilical vein endothelial cells in culture: the distinct role of protein kinase C and mitochondrial superoxide production. Atherosclerosis, 183, 259–267 (2005).
- 23) Isermann B, Vinnikov IA, Madhusudhan T, Herzog S, Kashif M, Blautzik J, Corat MA, Zeier M, Blessing E, Oh J, Gerlitz B, Berg DT, Grinnell BW, Chavakis T, Esmon CT, Weiler H, Bierhaus A, Nawroth PP. Activated protein C protects against diabetic nephropathy by inhibiting endothelial and podocyte apoptosis. Nat. Med., 13, 1349–1358 (2007).
- 24) Ling PR, Mueller C, Smith RJ, Bistrian BR. Hyperglycemia induced by glucose infusion causes hepatic oxidative stress and systemic inflammation, but not STAT3 or MAP kinase activation in liver in rats. Metabolism, 52, 868–874 (2003).
- 25) Shanmugam N, Reddy MA, Guha M, Natarajan R. High glucose-induced expression of proinflammatory cytokine and chemokine genes in monocytic cells. Diabetes, 52, 1256–1264 (2003).
- 26) Crofford LJ. COX-1 and COX-2 tissue expression: implications and predictions. J. Rheumatol. Suppl., 49, 15–19 (1997).
- 27) Ren G, Zhao X, Zhang L, Zhang J, L’Huillier A, Ling W, Roberts AI, Le AD, Shi S, Shao C, Shi Y. Inflammatory cytokine-induced intercellular adhesion molecule-1 and vascular cell adhesion molecule-1 in mesenchymal stem cells are critical for immunosuppression. J. Immunol., 184, 2321–2328 (2010).
- 28) Maruyama I. Thrombomodulin, an endothelial anticoagulant; its structure, function and expression. Jpn. Circ. J., 56, 187–191 (1992).