Abstract
This study focused on the differential metabolomic effects between water extracts of Polygoni Multiflori Radix and Polygoni Multiflori Radix Preparata in rats. The extracts were subsequently administered for 28 d. Serum biochemical indicators were tested, hematoxylin–eosin staining and immunohistochemistry staining were used to detect histopathological changes in the livers. Ultra-performance LC/quadrupole time-of-flight mass spectrometry was used to detect the changes in endogenous metabolites. Finally, we performed detailed analysis of the changes in metabolic pathways. Hematoxylin–eosin staining and immunohistochemistry staining results indicated that the water extracts of Polygoni Multiflori Radix and Polygoni Multiflori Radix Preparata had mild liver injury effect. Fifty-two differential endogenous biomarkers were confirmed as potential biomarkers between Polygoni Multiflori Radix and Polygoni Multiflori Radix Preparata groups. In the positive ion mode, the biomarkers included 31 Phosphatidyl cholines (PCs), six lysoPCs, and ceramide. In the negative ion mode, 12 biomarkers were confirmed, including glycodeoxycholic acid, chenodeoxycholic acid, and deoxycholic acid, etc. In Hydrophilic Interaction Liquid Chromatography (HILIC) mode, nine biomarkers were confirmed, including niacinamide, L-palmitoylcarnitine, and butyrylcarnitine, etc. Using MetaboAnalyst 4.0, six related metabolic pathways, including taurine and hypotaurine metabolism, sphingolipid metabolism, glycerophospholipid metabolism, nicotinate and nicotinamide metabolism, arginine and proline metabolism, and tryptophan metabolism and primary bile synthesis, were confirmed as the most differential pathways between the Polygoni Multiflori Radix and Polygoni Multiflori Radix Preparata groups.
INTRODUCTION
Polygoni Multiflori Radix (PMR) and Polygoni Multiflori Radix Preparata (PMRP) have been used as traditional Chinese Medicine for centuries throughout the world.1) They are two forms of clinical preparation of Polygonum multiflorum Thunb.2) Due to the processing method, they display marked differences in clinical use. PMR is used as an antioxidant and for purgation, whereas PMRP is used as a tonic and an antiaging drug.3) The pharmacological effects of PMR are detoxification, elimination, malarial treatment, and laxative, whereas PMRP has been shown to have positive effects on the liver and kidneys, as well as display benefits for the blood, anticancer, hepatoprotective and immunomodulation effects, turbidity and lipid lowering anti-Alzheimer’s disease activity.4–11)
Increasing reports of drug induced liver damage (DILI) caused by traditional Chinese medicine (TCM) have been reported in recent years, with many of these reports being attributed to systemic liver toxicity.12–14) As a commonly used tonic with a wide range of applications, these frequently reported adverse reactions caused by PMR or PMRP have become a major issue.15–18) PMR and its prescriptions can lead to pronounced liver damage. Official documents attributed to the medicine include relevant warning information and the correction scope of prescription. Animal studies have indicated that PMR has a significant interference effect on the bile acids composition of rats.19) PMR-induced liver damage is mainly due to its effect on CYP7A1, a key enzyme in bile acid metabolism.20) Rats treated with PMR for seven days did not experience liver damage, but did show accelerated bile acid enterohepatic circulation. This, in turn, changed the composition of intestinal bile acids, leading to the activation of an fxr-fgf15 signal in intestines, which can inhibit the expression of CYP7A1 in the liver.21)
DILI has occurred in only a small number of individuals when taking other medicines. These patients all presented with the typical characteristics of idiosyncratic drug-induced liver injury.22,23) The level of cis-stilbene glycoside was significantly increased in most PMR samples, which induced liver injury in patients. It was also observed that that cis-stilbene glycoside positively correlated with PMR-induced liver injury.15,24) The study demonstrated that PMR and PMRP do not induce liver damage as judged from cell proliferation, the integrity of cell membranes, and overall enzyme secretion in vitro. Moreover, three major chemical constituents of PMR, stilbene glycoside, physcion, and emodin showed no clear cytotoxicity against the human liver cell line L02.15) Chemical constituents–cytotoxicity relationship investigations revealed that stilbene glycoside and physcion had an attenuating effect on emodin. The processing of PMR may reduce its effect on cell proliferation and enzyme secretion in liver cells.15) Based on this, it is necessary to study liver damage caused by PMR and PMRP.
Metabolomics is a new approach for comprehensively profiling small molecules that can be used to detect and semi-quantitatively measure the levels of hundreds of unique metabolites from a broad range of metabolic pathways.25) In agreement with the holistic concept of TCM, metabolomics has shown great potential in efcacy and toxicity evaluation of TCM. A major aim of metabolomics is to obtain answers to provide insight into biological questions. Metabolomics is suitable for revealing the biochemical changes of disease pathogenesis.26,27) In this study, we systematically studied the differential metabolism effects of water extracts between PMR and PMRP on rats. We intended to discover endogenous differential metabolites and metabolic pathways, while analyzing the functions of these biomarkers and metabolic pathways.
MATERIALS AND METHODS
Chemicals and ReagentsMethanol, acetonitrile, formic acid, and ammonium acetate were purchased from Sigma-Aldrich (Shanghai, China). Water was available from a Milli-Q water purification system (Milford, MA, U.S.A.). Solvents and other chemicals of analytical grade were purchased from Beijing Chemical Engineering Company (Beijing, China).
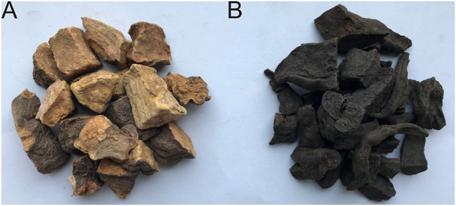
Preparation of PMR and PMRPPMR and PMRP were purchased from Tong Ren Tang medicinal materials Co., Ltd., (Fig. 1). PMR and PMRP were accurately weighed, soaked for 1 h, and boiled for 1 h. After filtration, a 10-times volume of distilled water was added and boiled for 1 h again, then the mix was filtrated. The two filtrates were combined and rotary evaporated to 1g/mL.
Ultra-Performance (UP) LC/Quadrupole Time-of-Flight (Q-TOF)-MS Chemical Profiles Detecting between PMR and PMRPWe performed UPLC/Q-TOF-MS to detect the chemical profiles of PMR and PMRP. The Chromatography conditions were as follows. Column was Waters HSS T3 (2.1 × 100 mm, 1.8 µm); mobile phase: A was an aqueous solution containing 0.1% formic acid, B was an acetonitrile solution containing 0.1% formic acid; flow rate was 0.5 mL/min; injection volume was 5 µL. Column temperature was 30°C. The mobile phase was eluted with gradient: 0–2 min, 20% B; 2–6 min, 20–30% B; 6–10 min, 30–50% B; 10–12 min, 50–80% B; 13–14 min, 80–100% B; 14–16 min, 20% B. DAD full wavelength scanning range was 200–400 nm.
Animal TreatmentFifteen male Sprague–Dawley rats (weighing 180–220 g each) were obtained from animal experimental center of Academy of Military Medical Science. Rats were housed with temperature and humidity at 22 ± 2°C and 45 ± 15%, under a natural light–dark cycle. All animal experiment protocols were carried out in accordance with the guidelines established by the animal experimental center of Academy of Military Medical Sciences (IACUC-AMMS-13-2017-012, May 2017). After 1 week acclimation period, rats were randomly divided into three groups, with five rats each, Control group, PMR group and PMRP group. Rats were all administered 1920 mg/kg/d orally for 28 d.28)
Sample PreparationAfter 28 d administrated, all rats were bled through the orbital iliac vein. After an allotted clotting time of the plasma solution of 10 min, all plasma samples were centrifuged at 3000 rpm for 10 min. Two hundred micro liters aliquot of plasma samples were added 800 µL of methanol, the resulting solution mixture was vortexed for 30 s and then centrifuged at 13000 rpm for 15 min at 4°C. All supernatant samples were transferred to new RNAase free tubes and evaporated to full dryness under stream of nitrogen. The residue was dissolved with 200 µL of methanol, followed by vortexing for 60 s and centrifuging at 13000 rpm for 15 min. The supernatant was transferred to a sampling vial for UPLC/Q-TOF-MS analysis.29) Quality control samples were prepared by pooling aliquots from all samples. Serum samples were allowed to thaw on ice at 4°C for 30 min, then a 100 µL aliquot of serum was added to a labeled 1.5 mL microcentrifuge tube, and 300 µL of acetonitrile was subsequently added. The preparation was thoroughly mixed on a vortex mixer for 15 s, then protein precipitate was pelleted by centrifugation at 12000 rpm for 10 min at 4°C. Finally, 100 µL of supernatant was transferred to a 200 µL vial for further analysis.
Biochemical Analysis and Histopathological ExaminationWhole blood was centrifuged at 3000 rpm for 15 min at 4°C to obtain the serum. levels of alanine aminotransferase (ALT), Aspartate aminotransferase (AST), alkaline phosphatase (ALP), lactate dehydrogenase (LDH), and total bilirubin (TBIL) were tested by using biochemical analyzer (Rayto, Shenzhen, China). Liver tissues were fixed in 10% neutral buffered formalin for 24 h, then embedded in paraffin, cut into sections (about 4–5 µm thick) by using a microtome. Hematoxylin–eosin (H&E) and immunohistochemistry (IHC) staining were used for highlighting the liver damage. For H&E staining, liver tissues were prepared and stained with H&E stain. For IHC Staining, the activity of endogenous peroxidase in the tissue sections or fixed cells was blocked with 3% hydrogen peroxide solution. The antigens were retrieved, and the nonspecific binding was blocked by 3% bovine serum albumin (BSA; Roche). Subsequently, tissue sections or cell coverslips were incubated with different primary antibodies (Anti-CD3 antibody (ab135372) (1 : 150) and Anti-CD4 antibody (ab183685) (1 : 200) (purchased from Abcam Shanghai, China), followed by incubation with horseradish peroxidase (HRP) conjugated goat anti-rabbit immunoglobulin G (IgG) (1 : 1000, Cell Signaling, MA, U.S.A.). Then, 3,3′-diaminobenzidine (DAB) chromogen substrate solution was utilized to visualize the results.30)
UPLC/Q-TOF-MS Analysis ConditionsChromatographic ConditionsHPLC-Q-TOF-MS system was used for serum metabolic spectrum analysis. One microliter aliquot of each sample was injected into the system on a HSS T3 column analytical column (2.1 × 100 mm, 1.8 µm, waters) for sample separation at 45°C. Solvent A (acetonitrile/water (60/40)) and solvent B (isopropanol/acetonitrile (90/10)) were used as the mobile phase for a linear gradient separation at a fow rate of 0.30 mL/min for 20 min with a linear gradient of 100% A over 0–1.0 min, 100–60% A over 1.0–9.0 min, 60–10% A over 9.0–19.0 min, 10–0% A over 19.0–20.0 min. Both positive and negative mode electrospray ionization sources were used. For hydrophilic interaction liquid chromatography (HILIC) separation, mobile phase A was acetonitrile and mobile phase B was water; both A and B contained 0.1% formic acid and 10 mmol/L ammonium acetate. The column was a BEH Amide column (2.1 × 100 mm, 1.7 µm, Waters) operated at 40°C. Column separation was performed by different gradient elution program. For 0 min, 80% A; 2 min, 70% A; 5 min 55% A; 6.5 min 40% A; 12 min 35% A; 14 min, 15% A; 17.5 min, 0% A; 18 min 0% A; 18.1 min 80% A.
MS ConditionsA Thermo Scientific™ Q Exactive™ hybrid quadrupole Orbitrap mass spectrometer equipped with a HESI-II probe was employed. Positive and negative HESI-II spray voltages were 3.7 and 3.5 kV, respectively. The heating capillary temperature was 320°C. Sheath gas pressure was 30 psi, auxiliary gas pressure was 10 psi, and collision gas pressure was 1.5 mTorr. Heated vaporizer temperature was 300°C. Sheath gas, auxiliary gas, and collision gas were all nitrogen. Parameters of the full mass scan were as follows: a resolution of 70000, an auto gain control target under 1 × 10⁶, a maximum isolation time of 50 ms, and a m/z range 50–1500. LC-MS system was controlled by using Xcalibur 2.2 SP1.48 software (Thermo Fisher Scientific). Data were collected and processed.
Quality Control AnalysisWe took 20 µL from each prepared samples extract and mix to get the quality control (QC) samples. They were injected among every three detecting samples throughout the analytical run. We selected features based on samples’ coefficients of variation, sample features with coefficients of variation over 15% were eliminated.29)
Data Processing and Pattern Recognition AnalysisRaw MS data were analyzed using MarkerLynx Applications Manager (Version 4.1). Data were imported to SIMCA-P software (v14.0, Umetric, Umea, Sweden) for principal component analysis (PCA) and orthogonal to partial least-squares-discriminate analysis (OPLS-DA) after the mean-centered and pareto-scaled procedures. PCA mode was assessed by the intercepts of R2X and Q2, while OPLS-DA mode was assessed by the intercepts of R2Y and Q2 in permutation test to avoid overfitting. Metabolite identification was processed based on results, database, and standards verification. Potential biomarkers were selected by variable importance in the projection (VIP). Ions with VIP > 1 were considered as relevant metabolites to explain the classification. Human Metabolome Database (HMDB) was exploited to identify the potential biomarkers and further elucidate the mechanisms.26) For visual description of significant changes, heat map and correlation analysis of biomarkers to biomarkers and pathway enrichment were generated by MetaboAnalyst 4.0.
Statistical AnalysisANOVA and Duncan’s multi-range test were performed to investigate alterations of biochemical indicators. Data was all analysised by using SPSS 22.0 and presented with GraphPad Prism 7.0 (Graphpad Software, San Diego, CA, U.S.A.). Statistical significance was defined at p < 0.05.
RESULTS
Fingerprints of PMR and PMRPUPLC/Q-TOF-MS analysis was applied to detect the chemical profiles of PMR and PMRP. The electrospray ionization (ESI) positive ion fingerprints were shown in Fig. 2. It can be seen that there is a significant difference in the chemical composition. The chemical profiles of Polygonum multiflorum Thunb have changed significantly before and after processing.
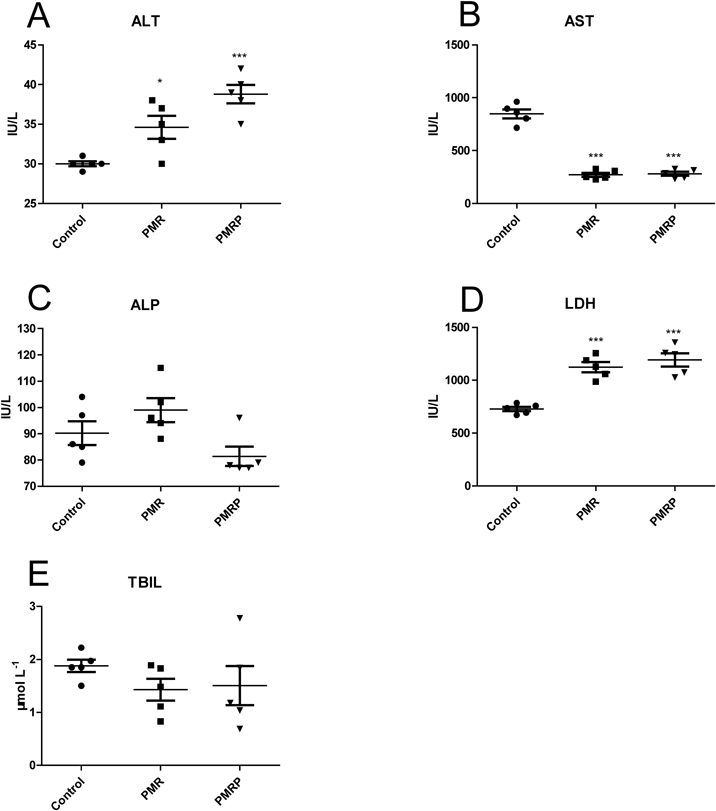
Levels of Serum Parameters and Histopathology TestThe levels of ALT and LDH were markedly increased in the PMR group and the PMRP group (Figs. 3A, D). Compared with the control group, the level of AST was markedly decreased in the PMR group and the PMRP group (Fig. 3B). The levels of ALP and TBIL had no obvious changes compared with the control group (Figs. 3C, E). serum parameters suggested that PMR and PMRP may have slight liver injury effects. H&E staining analysis showed the control group exhibited normal cellular structure (Fig. 4A), livers of the PMR group and the PMRP group presented no special changes (Figs. 4B, C). IHC results showed that there were almost no expression of CD3 and CD4 in control group (Figs. 4D, G). For CD3, there was slight expression in the RPMP group (Fig. 4E), and little higher expression in the PMR group (Fig. 4F). For CD4, there was no expression in the RPMP group (Fig. 4H), and slight expression in the PMR group (Fig. 4I). The results showed that PMR and PMR can cause mild immune inflammation.
Samples Quality Control AssessmentQC can determine whether the systematic error of the whole experiment is within the controllable range.31) In this study, QC samples and experimental samples were analyzed using unsupervised PCA. PCA scores of ESI positive ion mode, negative ion mode and HILIC mode are shown (Figs. 5A–C). The cluster analysis of QC samples showed that they were closely clustered in three modes respectively. The results proved that the detecting method has good stability and repeatability.
Multivariate Statistical AnalysisPCA and OPLS-DA can represent the differences in metabolomic profiles. PCA can provide an overview of the information hidden in multivariate data, whereas OPLS-DA can enhance the separation among groups of observations and improve interpretation. In this study, PCA was employed to reveal the metabolic changes.There were clear differences between the PMR and PMRP groups (Fig. 6). PCA score plot showed a clear trend of group clustering. Three models’ parameter showed R2X of 0.942 and Q2 of 0.820, R2X of 0.917 and Q2 of 0.872, and R2X of 0.781 and Q2 of 0.640, respectively (Figs. 6A, 7A, 8A).
To capture the distinctive metabolic phenotypes and maximize the discrimination between PMR and PMRP groups by means of all the identified metabolites, we applied a supervised OPLS-DA model. The OPLS-DA score plots model indicated that the cluster of PMR group was well separated from PMRP group. The variation values of the OPLS-DA model were R2Y of 0.997 and Q2 of 0.982, R2Y of 0.997 and Q2 of 0.996, R2Y of 0.997 and Q2 of 0.987, respectively (Figs. 6B, 7B, 8B). These results indicate that the model was valid and reliable. Permutation plots figure displayed Q2 points that intersected the vertical axis below zero suggesting a low risk of overfitting, indicating that the original models were valid (Figs. 6C, 7C, 8C). Difference variables were also revealed by S-plot of the OPLS-DA models (Figs. 6D, 7D, 8D).
The parameter indicated that these metabolites had high sensitivity and specificity for the identification, therefore the metabolites could be used as metabolic biomarkers between the PMR group and PMRP group.
Identifcation of Potential MetabolitesTotal ion current diagrams are shown in Fig. 9. VIP values indicate the separating power between groups. VIP values of all the metabolites from the OPLS-DA model were confirmed. Metabolites which had a VIP value >1 were considered as biomarkers. The biomarkers are listed in Table 1. Fifty-two serum metabolites were identified as biomarkers. In positive ion mode, 31 biomarkers were identified, including PC (16 : 0/14 : 0), PC (16 : 0/16 : 0), Ceramide (d18 : 1/16 : 0), LysoPC (18 : 0), LysoPC (22 : 0), LysoPC (24 : 0), PE (18 : 2(9Z,12Z)/16 : 0), and PE (20 : 4(8Z,11Z,14Z,17Z)/16 : 0), etc. In negative ion mode, 13 biomarkers were identified, including glycodeoxycholic acid, chenodeoxycholic acid, lithocholic acid, (Z)-9-Heptadecenoic acid, β-muricholic acid, taurocholic acid, cholic acid, and glycochenodeoxycholic acid, etc. In HILIC mode, nine biomarkers were identified, including niacinamide, L-palmitoylcarnitine, butyrylcarnitine, L-acetylcarnitine, L-kynurenine, taurine, L-alanine, 3-methylhistidine, and ornithine.
Table 1. Identification Results of Biomarkers between PMR Group and PMRP Group
| Mode | RTa) | VIPb) | FCc) | m/z | Formula | Identifier | CNd) | HMDB | KEGG |
|---|
| C18 + | 10.12 | 1.110 | 0.664 | 804.552 | C46H78NO8P | PC(18:2(9Z,12Z)/20:5(5Z,8Z,11Z,14Z,17Z)) | 1 | HMDB08149 | C00157 |
| 10.22 | 1.028 | 0.698 | 754.537 | C42H76NO8P | PC(20:4(8Z,11Z,14Z,17Z)/14:0) | 2 | HMDB08459 | C00157 |
| 10.38 | 1.074 | 0.663 | 730.537 | C40H76NO8P | PC(14:0/18:2(9Z,12Z)) | 3 | HMDB07874 | C00157 |
| 10.41 | 1.326 | 0.548 | 830.568 | C48H80NO8P | PC(20:4(8Z,11Z,14Z,17Z)/20:4(8Z,11Z,14Z,17Z)) | 4 | HMDB08477 | C00157 |
| 10.59 | 1.166 | 0.611 | 756.552 | C42H78NO8P | PC(16:0/18:3(9Z,12Z,15Z)) | 5 | HMDB07975 | C00157 |
| 10.60 | 1.265 | 0.565 | 780.552 | C44H78NO8P | PC(20:4(8Z,11Z,14Z,17Z)/16:1(9Z)) | 6 | HMDB08463 | C00157 |
| 10.77 | 1.139 | 0.620 | 768.552 | C43H78NO8P | PC(20:4(5Z,8Z,11Z,14Z)/15:0) | 7 | HMDB08428 | C00157 |
| 10.94 | 1.297 | 0.539 | 744.552 | C41H78NO8P | PC(18:2(9Z,12Z)/15:0) | 8 | HMDB08132 | C00157 |
| 10.01 | 1.521 | 0.436 | 756.552 | C42H78NO8P | PC(18:3(6Z,9Z,12Z)/16:0) | 9 | HMDB08166 | C00157 |
| 11.08 | 1.723 | 0.419 | 706.537 | C38H76NO8P | PC(16:0/14:0) | 10 | HMDB07965 | C00157 |
| 11.70 | 1.056 | 0.642 | 740.521 | C41H74NO8P | PE(20:4(8Z,11Z,14Z,17Z)/16:0) | 11 | HMDB09418 | C00350 |
| 11.90 | 1.464 | 0.452 | 716.522 | C39H74NO8P | PE(18:2(9Z,12Z)/16:0) | 12 | HMDB09088 | C00350 |
| 11.91 | 1.060 | 0.671 | 746.568 | C41H80NO8P | PC(18:1(11Z)/15:0) | 13 | HMDB08066 | C00157 |
| 12.08 | 1.293 | 0.543 | 796.584 | C45H82NO8P | PC(15:0/22:4(7Z,10Z,13Z,16Z)) | 14 | HMDB07955 | C00157 |
| 12.39 | 1.165 | 0.646 | 834.598 | C48H84NO8P | PC(22:6(4Z,7Z,10Z,13Z,16Z,19Z)/18:0) | 15 | HMDB08727 | C00157 |
| 12.43 | 1.352 | 0.551 | 734.568 | C40H80NO8P | PC(16:0/16:0) | 16 | HMDB00564 | C00157 |
| 12.66 | 1.095 | 0.661 | 760.583 | C42H82NO8P | PC(16:0/18:1(11Z)) | 17 | HMDB07971 | C00157 |
| 12.77 | 1.245 | 0.576 | 810.598 | C46H84NO8P | PC(20:4(8Z,11Z,14Z,17Z)/18:0) | 18 | HMDB08464 | C00157 |
| 12.85 | 1.222 | 0.594 | 836.614 | C48H86NO8P | PC(18:0/22:5(4Z,7Z,10Z,13Z,16Z)) | 19 | HMDB08055 | C00157 |
| 13.01 | 1.390 | 0.502 | 786.599 | C44H84NO8P | PC(18:0/18:2(9Z,12Z)) | 20 | HMDB08039 | C00157 |
| 13.04 | 1.120 | 1.804 | 538.518 | C34H67NO3 | Ceramide (d18:1/16:0) | 21 | HMDB04949 | C00195 |
| 13.23 | 1.287 | 0.538 | 768.554 | C43H78NO8P | PC(20:4(8Z,11Z,14Z,17Z)/15:0) | 22 | HMDB08461 | C00157 |
| 14.17 | 1.224 | 0.614 | 762.600 | C42H84NO8P | PC(18:0/16:0) | 23 | HMDB08034 | C00157 |
| 14.36 | 1.100 | 0.659 | 788.615 | C44H86NO8P | PC(18:0/18:1(11Z)) | 24 | HMDB08037 | C00157 |
| 14.59 | 1.281 | 0.570 | 814.631 | C46H88NO8P | PC(18:0/20:2(11Z,14Z)) | 26 | HMDB08045 | C00157 |
| 2.64 | 1.069 | 0.655 | 518.323 | C26H48NO7P | LysoPC(18:3(6Z,9Z,12Z)) | 26 | HMDB10387 | C04230 |
| 5.86 | 1.049 | 0.667 | 524.370 | C26H54NO7P | LysoPC(18:0) | 27 | HMDB10384 | C04230 |
| 6.17 | 1.001 | 0.691 | 550.386 | C28H56NO7P | LysoPC(20:1(11Z)) | 28 | HMDB10391 | C04230 |
| 8.85 | 1.130 | 0.633 | 580.433 | C30H62NO7P | LysoPC(22:0) | 29 | HMDB10398 | C04230 |
| 8.88 | 1.160 | 0.623 | 606.449 | C32H64NO7P | LysoPC(24:1(15Z)) | 30 | HMDB10406 | C04230 |
| 9.97 | 1.137 | 0.633 | 608.464 | C32H66NO7P | LysoPC(24:0) | 31 | HMDB10405 | C04230 |
| C18− | 10.10 | 1.642 | 0.228 | 448.307 | C26H43NO5 | Glycodeoxycholic acid | 32 | HMDB0000631 | C05464 |
| 11.24 | 1.604 | 0.235 | 391.286 | C24H40O4 | Chenodeoxycholic acid | 33 | HMDB0000518 | C02528 |
| 12.85 | 1.487 | 0.253 | 375.290 | C24H40O3 | Lithocholic acid | 34 | HMDB0000761 | C03990 |
| 13.27 | 1.079 | 2.375 | 227.201 | C14H28O2 | Myristic acid | 35 | HMDB00806 | C06424 |
| 14.62 | 1.095 | 2.455 | 267.233 | C17H32O2 | (Z)-9-Heptadecenoic acid | 36 | HMDB31046 | C16536 |
| 16.56 | 1.085 | 2.457 | 297.280 | C19H38O2 | Nonadecanoic acid | 37 | HMDB00772 | C16535 |
| 7.15 | 1.366 | 0.309 | 407.280 | C24H40O5 | β-Muricholic acid | 38 | HMDB0000415 | C17726 |
| 8.23 | 1.700 | 0.283 | 514.284 | C26H45NO7S | Taurocholic acid | 39 | HMDB0000036 | C05122 |
| 8.34 | 2.051 | 0.084 | 464.301 | C26H43NO6 | Glycocholic acid | 40 | HMDB0000138 | C01921 |
| 9.09 | 1.437 | 0.279 | 391.285 | C24H40O4 | Ursodeoxycholic acid | 41 | HMDB0000946 | C07880 |
| 9.60 | 1.551 | 0.219 | 407.280 | C24H40O5 | Cholic acid | 42 | HMDB0000619 | C00695 |
| 9.75 | 2.450 | 0.026 | 448.307 | C26H43NO5 | Glycochenodeoxycholic acid | 43 | HMDB0000637 | C05466 |
| Hilic | 1.33 | 1.265 | 0.659 | 123.055 | C6H6N2O | Niacinamide | 44 | HMDB01406 | C00153 |
| 1.38 | 1.023 | 0.763 | 400.341 | C23H45NO4 | L-Palmitoylcarnitine | 45 | HMDB00222 | C02990 |
| 2.19 | 1.718 | 0.483 | 232.154 | C11H21NO4 | Butyrylcarnitine | 46 | HMDB02013 | C02862 |
| 3.16 | 1.012 | 0.768 | 204.123 | C9H17NO4 | L-Acetylcarnitine | 47 | HMDB00201 | C02571 |
| 4.78 | 1.461 | 0.580 | 209.092 | C10H12N2O3 | L-Kynurenine | 48 | HMDB00684 | C00328 |
| 5.31 | 1.686 | 0.567 | 126.022 | C2H7NO3S | Taurine | 49 | HMDB00251 | C00245 |
| 5.86 | 1.340 | 0.626 | 90.055 | C3H7NO2 | L-Alanine | 50 | HMDB00161 | C00041 |
| 7.05 | 1.664 | 0.486 | 170.092 | C7H11N3O2 | 3-Methylhistidine | 51 | HMDB00479 | C01152 |
| 7.35 | 1.016 | 1.339 | 133.097 | C5H12N2O2 | Ornithine | 52 | HMDB00214 | C00077 |
a) RT, retention time, b) VIP, Variable Importance in the Projection. c) FC, fold change. d) CN, Corresponding number.
In order to investigate whether differences in metabolic pathways between the PMR and PMRP groups, the metabolic pathways were constructed by importing the identifed potential metabolites’ HMDB into MetaboAnalyst 4.0. It is a useful online tool for analyzing complex and intertwining or enriching metabolic pathways.32,33) The p-value of pathway impact was calculated. The threshold was set to 0.01, and values above this threshold were filtered out as significant pathways. HMDB of biomarkers were imported into the MetaboAnalyst 4.0 to find the specific pathways.
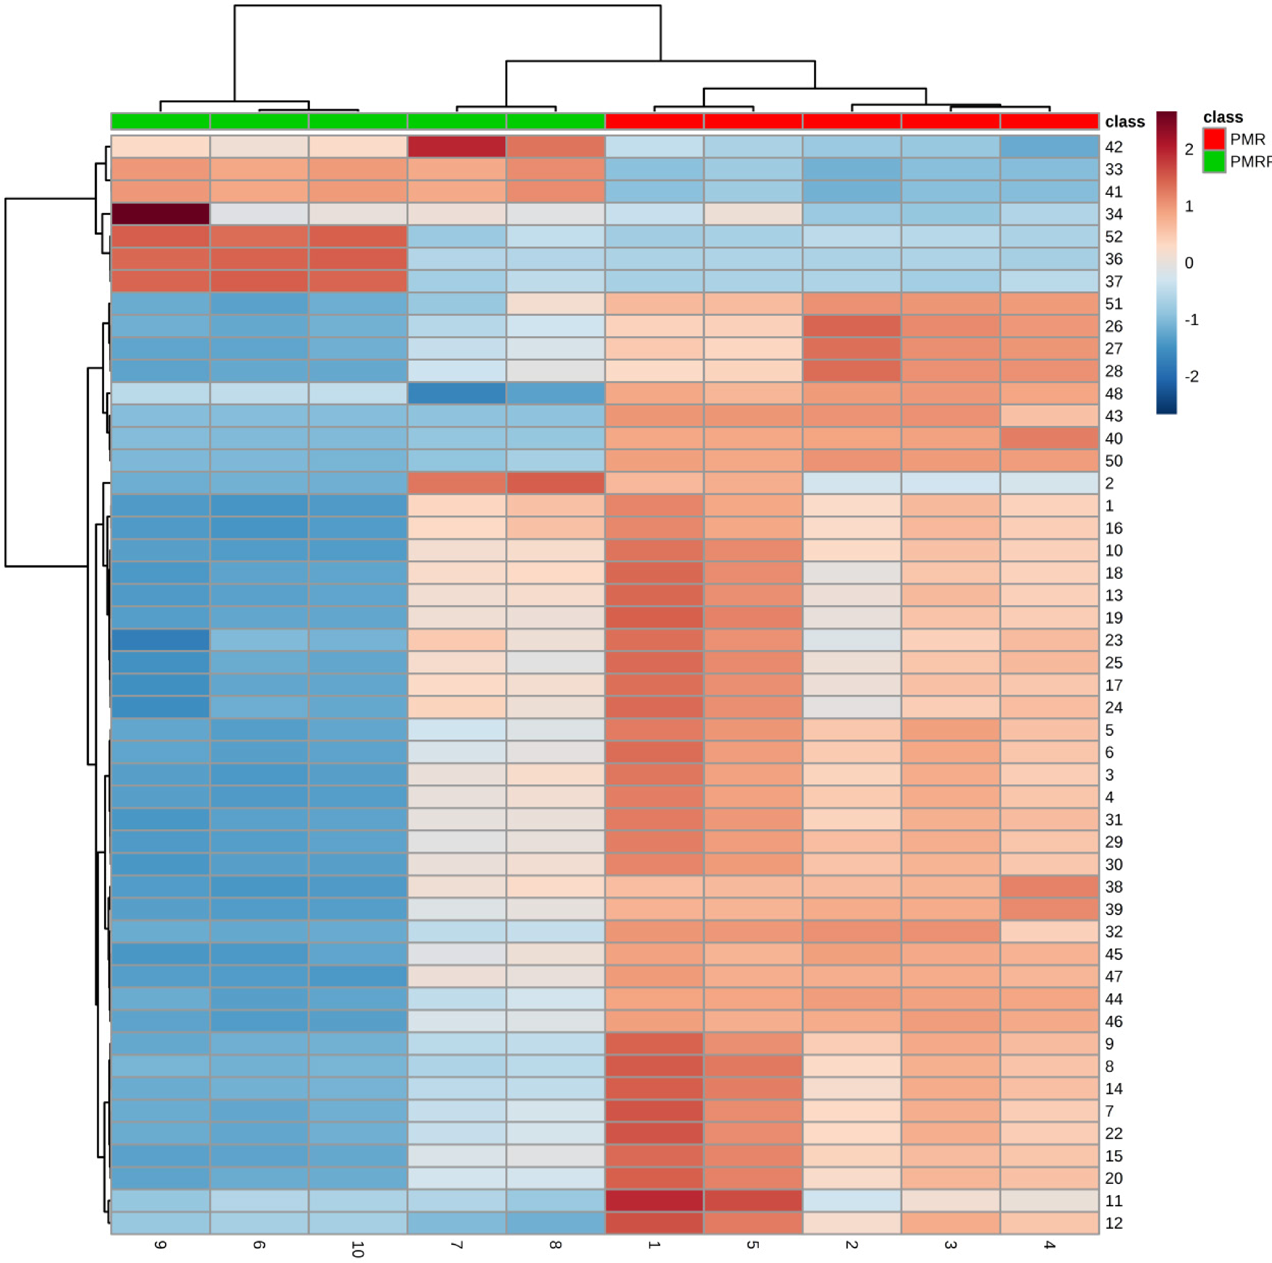
A clustering heat map directly revealed the variation of biomarkers (Fig. 10). Fold change is often used to further investigate the magnitude of change of biomarkers. Compared with the PMR group, the PMRP group showed increased levels of ceramide (d18 : 1/16 : 0), myristic acid, (Z)-9-heptadecenoic acid, and nonadecanoic acid, whereas the levels of other biomarkers were decreased (Table 1). Metabolite correlation analysis was revealed by heat map plotting (Fig. 11). We performed the metabolites sets enrichment analysis. The top six routes for scoring were taurine and hypotaurine metabolism, sphingolipid metabolism, glycerophospholipid metabolism, nicotinate and nicotinamide metabolism, arginine and proline metabolism, and primary bile acid biosynthesis. Bile acid biosynthesis was the most differential pathway (Figs. 12A, B, Table 2). Clicking the corresponding node (Fig. 13A), we can obverve the pathway view on the panel (Fig. 13). Labels within small boxes correspond to KEGG identifiers for metabolites. In Fig. 13A, the metabolites were taurine (C00245, HMDB0000251) and taurocholic acid (C05122, HMDB0000036). In Fig. 13B the metabolite was N-acylsphingosine (C00195, HMDB0004947). In Fig. 13C, the metabolites were phosphatidylcholine (C00157, HMDB00564), phosphatidylethanolamine (C00350, HMDB05779) and lyso-phosphatidylcholine (lysoPC) (18 : 1(9Z)) (C04230, HMDB0002815). In Fig. 13D, the metabolites were phosphatidylcholine (C00157, HMDB00564) and phosphatidylethanolamine (C00350, HMDB05779). In Fig. 13E, the metabolite was L-ornithine (C00077, HMDB0000214). In Fig. 13F, the metabolites were taurine (C00245, HMDB0000251), cholic acid (C00695, HMDB0000619), glycocholic acid (C01921, HMDB0000138), taurocholic acid (C05122, HMDB0000036), glycochenodeoxycholic acid (C05466, HMDB0000637), and chenodeoxycholic acid (C02528, HMDB0000518).
Table 2. The Main Pathway Affected between the PMR Group and the PMRP Group on Serum of Rats
| Main pathway | Totala) | Hitsb) | Raw Pc) | Holm Pd) | −log(P)e) | Impactf) |
|---|
| Primary bile acid biosynthesis | 46 | 6 | 0.0001 | 0.0077 | 9.279 | 0.1190 |
| Taurine and hypotaurine metabolism | 8 | 2 | 0.0078 | 0.6354 | 4.848 | 0.4286 |
| Glycerophospholipid metabolism | 30 | 3 | 0.0144 | 1 | 4.241 | 0.2750 |
| Nicotinate and nicotinamide metabolism | 13 | 1 | 0.2074 | 1 | 1.573 | 0.2381 |
| Sphingolipid metabolism | 21 | 1 | 0.3137 | 1 | 1.159 | 0.2807 |
| Arginine and proline metabolism | 44 | 1 | 0.5486 | 1 | 0.600 | 0.1274 |
a) Total: the total number of compounds in the pathway. b) Hits: the matched number of metabolites in one pathway. c) Raw P: the original p value calculated from the enrichment analysis. d) Holm P: the p value further adjusted using Holm–Bonferroni method. e) −log(P): Y-axis values. f) Impact: the pathway impact value calculated from pathway topology analysis.
DISCUSSION
Herbal medicine has become the second most common cause of drug-induced liver damage (DILI) in the United States.34) Rare and unpredictable herbal drug induced liver damage (HILI) with idiosyncratic reactions is well documented.35,36) Clinical features of liver injury by TCM drugs are variable, but specific diagnostic biomarkers are available for only a small subset of herbs, and reliable methods to identify the DILI of herbs remain elusive17,37) despite normal metabolic function of liver being compromised.38) Take PMR for example, evidence chain-based causality identification in HILI has been successfully studied.34) PMR has a wide range of clinical applications, but clinical DILI reports involving PMR are increasing.39) Due to the special nature of TCM drugs and complexity of clinical use, it is difficult to identify and evaluate the toxicity.40) Concurrently, the direct or indirect long-term DILI effects of TCM drugs are difficult to determine.
Recent research elucidating the mechanism of liver injury has focused on metabolomic methods in chronic liver injury caused by PMR or PMRP using specific animal models.41) Research has shown that toxicity of PMR is not dependent on the content of anthranoid derivatives but may correlate with the content of tetrahydroxystilbene glucosides.42) PMR did not cause acute toxicity. The toxic effects occurred when patients had taken a large dose of PMR over a prolonged period. A logical assumption being that the accumulation of toxic components in vivo resulted in the presentation of these toxic events over time.43,44) Furthermore, the acute toxicity caused by PMR typically occurred in patients with idiopathic symptoms. Relevant ingredients in PMR had a direct link to specific liver damage.34,41,45) Ruling out patients with idiosyncrasies, it is difficult to find chronic liver damage caused by PMR for ordinary patients. Researchers found that PMRP has a dose-time-toxicity dependent correlation. Serum metabonomics studies revealed 12 characteristic metabolites were obtained through metabolomic analysis and 7 metabolic pathways involved, resulting in significant disturbance in amino acid metabolism, energy metabolism, and bile acid metabolism.14)
Changes in endogenous metabolic profiles are more sensitive and easier to observe. Here, results show that bile acid metabolism is one of the most metabolic pathways in rats between PMR group and PMRP group. Recent research has indicated that anthraquinones derived from PMR can alter bile acid disposition through direct inhibition of bile acid transporters as well as regulated expression of bile acid transporters and enzymes.46) Due to the slow onset of a pharmacologically relevant effect, TCM herbs are typically taken over a long period. It is difficult to observe liver damage using biochemical indicators.
Metabolomics provide an opportunity to develop the systematic analysis of metabolites and have been successfully applied to establishing biomarkers and perturbed pathways which, in turn, can clarify the mechanism of action of traditional Chinese medicine.47–49) In this study, results show that biochemical indicators (such as ALT, AST, ALP, LDH, and TBIL) cannot be used as indicators of liver damage caused by PMR and PMRP. A nontargeted metabolic profile based on UPLC/Q-TOF-MS was developed to investigate significant metabolic changes in rat serum between PMR and PMRP groups. A holistic metabolic profile of serum was detected. Six pathways (taurine and hypotaurine metabolism, sphingolipid metabolism, glycerophospholipid metabolism, nicotinate and nicotinamide metabolism, arginine and proline metabolism, and primary bile acid biosynthesis) were confirmed as the most significant pathways.
Taurine exists in a free state in the body, it participates in protein synthesis. It has antioxidant and osmotic pressure regulation, and regulates bile acid binding, ion movement, and nerve transmission. In liver, the role of taurine is to combine with bile acids to form taurocholic acid, which is essential for the absorption of lipids in the digestive tract.50–53) Taurine and hypotaurine metabolism play an important role in bile acid transportation. Sphingolipids are important components of biofilm structure. Sphingolipids and their metabolites are important active molecules involved in many important signal transduction processes such as cell growth, differentiation, senescence, and programmed cell death.54,55) Glycerol phospholipid is the most abundant phospholipid in the body. It is an important component of bile and membrane surfactants can be involved in the recognition and signal transduction of proteins by cell membranes.56) Studies have indicated that PMR might have a more satisfactory effect in the clinical treatment of nonalcoholic fatty liver disease (NAFLD) or hyperlipidemia characterized by the elevation of cholesterol than processed PMR.26) Nicotinate (vitamin B3) is one of the 13 essential vitamins in the body. Nicotinate can convert into nicotinamide. Niacinamide is a component of coenzymes I and II, which participate in lipid metabolism, oxidation processes of tissue respiration, and anaerobic decomposition of carbohydrates.57,58) Arginine and proline participate in the ornithine cycle, promote the formation of urea, and convert the ammonia produced into a non-toxic urea through the ornithine cycle, which is discharged in the urine, thereby reducing the blood ammonia concentration.59) The arginine and proline metabolism pathway is affected by PMR and PMRP in this study.
Bile acids play an important role in lipid metabolism. Bile acids are mainly found in the enterohepatic circulatory system and play a protective role through recycling. Only small fraction of bile acids enter into the peripheral circulation. Though bile acids have been known as digestive juice, recent studies have revealed that bile acids act as signaling molecules to control metabolism and inflammation.60–62) Bile acids and urine tauro-beta-muricholic acid were considered promising biomarkers among PMR induced hepatotoxicity.
CONCLUSION
In this study, a metabolomic profile based on UPLC/Q-TOF-MS analysis was developed to investigate changes in the rat serum among water extracts between PMR and PMRP. Fifty-two biomarkers were confirmed, and six metabolic pathways, including taurine and hypotaurine metabolism, sphingolipid metabolism, glycerophospholipid metabolism, nicotinate and nicotinamide metabolism, arginine and proline metabolism, and tryptophan metabolism and primary bile synthesis were confirmed by MetaboAnalyst 4.0. This is first metabolomic study to identify potential differential endogenous metabolites and pathways that may be related to water extracts of between PMR and PMRP. However, the limitation is that we do not confirm the mechanisms. We will explore the effects of metabolite identification on pathway exploration in order to find out the hepatotoxicity mechanisms caused by PMR and PMRP. We will be focusing on identifying the specific compounds that may contribute to hepatotoxicity.
Acknowledgments
This work was supported by the National Major Science and Technology Project (No. 2015ZX09501004-003-003).
Conflict of Interest
The authors declare no conflict of interest.
REFERENCES
- 1) Lin L, Ni B, Lin H, Zhang M, Li X, Yin X, Qu C, Ni J. Traditional usages, botany, phytochemistry, pharmacology and toxicology of Polygonum multiflorum Thunb.: a review. J. Ethnopharmacol., 159, 158–183 (2015).
- 2) Committee CP. Chinese pharmacopoeia (2015 Edition). China Chemical Industry Press, Beijing, pp. 175–177 (2015).
- 3) Luo C, Huang X, Shi Y, Pu X. Safety study and risk factors analysis of Polygonum Multiflorum Thunb and its preparations. Asia-Pacific Traditional Medicine, (2018).
- 4) Chen L, Duan H, Xie F, Gao Z, Wu X, Chen F, Wu W. Tetrahydroxystilbene glucoside effectively prevents apoptosis induced hair loss. BioMed Research International, 4, 1–11 (2018).
- 5) Ya-Li LI, Chu W, Guo WC. The effect of Heshouwu decoction on anti-oxidation and blood lipid of aging rats. Chinese Journal of Gerontology, (2008).
- 6) Wang M, Zhao R, Wang W, Mao X, Yu J. Lipid regulation effects of Polygoni Multiflori Radix, its processed products and its major substances on steatosis human liver cell line L02. J. Ethnopharmacol., 139, 287–293 (2012).
- 7) Huang CH, Horng LY, Chen CF, Wu RT. Chinese herb Radix Polygoni Multiflori as a therapeutic drug for liver cirrhosis in mice. J. Ethnopharmacol., 114, 199–206 (2007).
- 8) Yang WT, Zheng XW, Chen S, Shan CS, Xu QQ, Zhu JZ, Bao XY, Lin Y, Zheng GQ, Wang Y. Chinese herbal medicine for Alzheimer’s disease: Clinical evidence and possible mechanism of neurogenesis. Biochem. Pharmacol., 141, 143–155 (2017).
- 9) Chen Q, Zhang SZ, Ying HZ, Dai XY, Li XX, Yu CH, Ye HC. Chemical characterization and immunostimulatory effects of a polysaccharide from Polygoni Multiflori Radix Praeparata in cyclophosphamide-induced anemic mice. Carbohydr. Polym., 88, 1476–1482 (2012).
- 10) Li Y, Han M, Lin P, He Y, Yu J, Zhao R. Hair growth promotion activity and its mechanism of polygonum multiflorum. EVID-BASED COMPL ALT, 2015, 517901 (2015).
- 11) Wang W, He Y, Lin P, Li Y, Sun R, Gu W, Yu J, Zhao R. In vitro effects of active components of Polygonum Multiflorum Radix on enzymes involved in the lipid metabolism. J. Ethnopharmacol., 153, 763–770 (2014).
- 12) Jing J, Teschke R. Traditional Chinese medicine and herb-induced liver injury: comparison with drug-induced liver injury. Journal of Clinical and Translational Hepatology, 6, 57–68 (2018).
- 13) Ruan LY, Li MH, Xing YX, Hong W, Chen C, Chen JF, Xu H, Zhao WL, Wang JS. Hepatotoxicity and hepatoprotection of Polygonum multiflorum Thunb. as two sides of the same biological coin. J. Ethnopharmacol., 230, 81–94 (2019).
- 14) Gong X, Liu M, Gong L, Li Y, Peng C. Study on hepatotoxicity of different dosages of Polygoni multiflori radix praeparata in rats by metabolomics based on UPLC-Q-TOF-MS. J. Pharm. Biomed. Anal., 175, 112760 (2019).
- 15) Yu J, Xie J, Mao XJ, Wang MJ, Li N, Wang J, Zhaori GT, Zhao RH. Hepatoxicity of major constituents and extractions of Radix Polygoni Multiflori and Radix Polygoni Multiflori Praeparata. J. Ethnopharmacol., 137, 1291–1299 (2011).
- 16) Xun-Cong LU. One case of drug fever caused by Heshouwu. Pharmacy & Clinics of Chinese Materia Medica, 4, 4–41 (2013).
- 17) Longfei L, Boran N, Hongmei L, Miao Z, Xuechun L, Xingbin Y, Changhai Q, Jian N. Traditional usages, botany, phytochemistry, pharmacology and toxicology of Polygonum multiflorum Thunb.: a review. J. Ethnopharmacol., 159, 158–183 (2015).
- 18) Ah JK, Min HJ, Suk YS, Jun KH, Nyoung CS, Yoon HC, Jin KH, Hyo KT, Tae JW, Jae LO. Drug-induced liver injury: twenty five cases of acute hepatitis following ingestion of Polygonum multiflorum Thunb. Gut & Liver, 5, 493–499 (2011).
- 19) Zhao DS, Jiang LL, Fan YX, Dong LC, Ma J, Dong X, Xu XJ, Li P, Li HJ. Identification of urine tauro-beta-muricholic acid as a promising biomarker in Polygoni Multiflori Radix-induced hepatotoxicity by targeted metabolomics of bile acids. Food Chem. Toxicol., 108 (Pt B), 532–542 (2017).
- 20) Jiang LL, Zhao DS, Fan YX, Yu Q, Lai YS, Li P, Li HJ. Transcriptome analysis to assess the cholestatic hepatotoxicity induced by Polygoni Multiflori Radix: Up-regulation of key enzymes of cholesterol and bile acid biosynthesis. J. Proteomics, 177, 40–47 (2018).
- 21) Gao X, Qin L, Zhang Z, Zhao H, Zhou W, Xie Z, Yu H, Huang Z. Deciphering biochemical basis of Qingkailing injection-induced anaphylaxis in a rat model by time-dependent metabolomic profiling based on metabolite polarity-oriented analysis. J. Ethnopharmacol., 225, 287–296 (2018).
- 22) Colaci CS, Mendizabal M, Bessone F. Idiosyncratic drug-induced acute liver failure: a challenging and distressing scenario. Curr. Drug Saf., 14, 94–101 (2019).
- 23) Bessone F, Robles-Diaz M, Hernandez N, Medina-Caliz I, Lucena MI, Andrade RJ. Assessment of serious acute and chronic idiosyncratic drug-induced liver injury in clinical practice. Semin. Liver Dis., 39, 381–394 (2019).
- 24) He L, Yin P, Meng Y, Tang J, He T, Niu M, Guo Y, Zhu Y, Jing J, Li C, Ma Z, Wang J, Bai Z, Xiao X. Immunological synergistic mechanisms of trans-/cis-stilbene glycosides in Heshouwu-related idiosyncratic liver injury. Science Bulletin, 62, 748–751 (2017).
- 25) Shimura H, Mitsui T, Kira S, Ihara T, Sawada N, Nakagomi H, Miyamoto T, Tsuchiya S, Kanda M, Takeda M. Metabolomic analysis of overactive bladder in male patients: identification of potential metabolite biomarkers. Urology, 118, 158–163 (2018).
- 26) Sun L, Jia H, Ma L, Yu M, Yang Y, Liu Y, Zhang H, Zou Z. Metabolic profiling of hypoxia/reoxygenation injury in H9c2 cells reveals the accumulation of phytosphingosine and the vital role of Dan-Shen in Xin-Ke-Shu. Phytomedicine, 49, 83–94 (2018).
- 27) Rocchetti G, Chiodelli G, Giuberti G, Ghisoni S, Baccolo G, Blasi F, Montesano D, Trevisan M, Lucini L. UHPLC-ESI-QTOF-MS profile of polyphenols in Goji berries (Lycium barbarum L.) and its dynamics during in vitro gastrointestinal digestion and fermentation. Journal of Functional Foods, 40, 564–572 (2018).
- 28) Xia XH, Yuan YY, Liu M. The assessment of the chronic hepatotoxicity induced by Polygoni Multiflori Radix in rats: a pilot study by using untargeted metabolomics method. J. Ethnopharmacol., 203, 182–190 (2017).
- 29) Zhang Z, Yang L, Huang X, Gao Y. Metabolomics profiling of Polygoni Multiflori Radix and Polygoni Multiflori Radix Preparata extracts using UPLC-Q/TOF-MS. Chin. Med., 14, 46 (2019).
- 30) Zhu R, Gires O, Zhu L, Liu J, Li J, Yang H, Ju G, Huang J, Ge W, Chen Y, Lu Z, Wang H. TSPAN8 promotes cancer cell stemness via activation of sonic Hedgehog signaling. Nat. Commun., 10, 2863 (2019).
- 31) Wang D, Li R, Wei S, Gao S, Xu Z, Liu H, Wang R, Li H, Cai H, Wang J, Zhao Y. Metabolomics combined with network pharmacology exploration reveals the modulatory properties of Astragali Radix extract in the treatment of liver fibrosis. Chin. Med., 14, 30 (2019).
- 32) Cambiaghi A, Ferrario M, Masseroli M. Analysis of metabolomic data: tools, current strategies and future challenges for omics data integration. Brief. Bioinform., 18, 498–510 (2017).
- 33) Xia J, Wishart DS. Using MetaboAnalyst 3.0 for Comprehensive Metabolomics Data Analysis. Curr. Protoc. Bioinformatics, 55, 14.10.1–14.10, 91 (2016).
- 34) Wang J, Ma Z, Niu M, et al. Evidence chain-based causality identification in herb-induced liver injury: exemplification of a well-known liver-restorative herb Polygonum multiflorum. Frontiers of Medicine, 9, 457–467 (2015).
- 35) Frenzel C, Teschke R. Herbal hepatotoxicity: clinical characteristics and listing compilation. Int. J. Mol. Sci., 17, 588 (2016).
- 36) Teschke R, Eickhoff A. Herbal hepatotoxicity in traditional and modern medicine: actual key issues and new encouraging steps. Frontiers in Pharmacology, 6, 72 (2015).
- 37) Teschke R, Larrey D, Melchart D, Danan G. Traditional Chinese medicine (TCM) and herbal hepatotoxicity: RUCAM and the role of novel diagnostic biomarkers such as MicroRNAs. Medicines, 3, E18 (2016).
- 38) Dong Q, Li N, Li Q, Zhang CE, Feng WW, Li GQ, Li RY, Tu C, Han X, Bai ZF, Zhang YM, Niu M, Ma ZJ, Xiao XH, Wang JB. Screening for biomarkers of liver injury induced by Polygonum multiflorum: a targeted metabolomic study. Frontiers in Pharmacology, 6, 217 (2015).
- 39) Bae SH, Kim DH, Bae YS, Lee KJ, Kim DW, Yoon JB, Hong JH, Kim SH. Toxic hepatitis associated with Polygoni multiflori. Korean J. Hepatol., 16, 182–186 (2010).
- 40) Liu Z, He X, Wang L, Zhang Y, Hai Y, Gao R. Chinese Herbal medicine hepatotoxicity: the evaluation and recognization based on large-scale evidence ddatabase. Curr. Drug Metab., 20, 138–146 (2019).
- 41) Li CY, Tu C, Gao D, Wang RL, Zhang HZ, Niu M, Li RY, Zhang CE, Li RS, Xiao XH, Yang MH, Wang JB. Metabolomic study on idiosyncratic liver injury induced by different extracts of Polygonum multiflorum in rats integrated with pattern recognition and enriched pathways analysis. Frontiers in Pharmacology, 7, 483 (2016).
- 42) Wu X, Chen X, Huang Q, Fang D, Li G, Zhang G. Toxicity of raw and processed roots of Polygonum multiflorum. Fitoterapia, 83, 469–475 (2012).
- 43) Huang J, Zhang JP, Bai JQ, Wei MJ, Zhang J, Huang ZH, Qu GH, Xu W, Qiu XH. Chemical profiles and metabolite study of raw and processed Polygoni Multiflori Radix in rats by UPLC-LTQ-Orbitrap MSn spectrometry. Chin. J. Nat. Med., 16, 375–400 (2018).
- 44) Liu Y, Wang Q, Yang J, Guo X, Liu W, Ma S, Li S. Polygonum multiflorum Thunb.: a review on chemical analysis, processing mechanism, quality evaluation, and hepatotoxicity. Frontiers in Pharmacology, 9, 364 (2018).
- 45) Li C, Niu M, Bai Z, Zhang C, Zhao Y, Li R, Tu C, Li H, Jing J, Meng Y, Ma Z, Feng W, Tang J, Zhu Y, Li J, Shang X, Zou Z, Xiao X, Wang J. Screening for main components associated with the idiosyncratic hepatotoxicity of a tonic herb, Polygonum multiflorum. Frontiers of Medicine, 11, 253–265 (2017).
- 46) Kang L, Si L, Rao J, Li D, Wu Y, Wu S, Wu M, He S, Zhu W, Wu Y, Xu J, Li G, Huang J. Polygoni Multiflori Radix derived anthraquinones alter bile acid disposition in sandwich-cultured rat hepatocytes. Toxicol. In Vitro, 40, 313–323 (2017).
- 47) Cao H, Zhang A, Zhang H, Sun H, Wang X. The application of metabolomics in traditional Chinese medicine opens up a dialogue between Chinese and Western medicine. Phytother. Res., 29, 159–166 (2015).
- 48) Wang M, Chen L, Liu D, Chen H, Tang DD, Zhao YY. Metabolomics highlights pharmacological bioactivity and biochemical mechanism of traditional Chinese medicine. Chem. Biol. Interact., 273, 133–141 (2017).
- 49) Zhou N, Yang Y, Li K, Ke Y, Zheng X, Feng W, Bai Z, Liu T, Wang Y, Liu Z, Li X. Integrating strategies of chemistry, biochemistry and metabolomics for characterization of the medication principle of “treating cold/heat syndrome with hot/cold herbs”. J. Ethnopharmacol., 239, 111899 (2019).
- 50) Huxtable RJ. Taurine in the central nervous system and the mammalian actions of taurine. Prog. Neurobiol., 32, 471–533 (1989).
- 51) Huxtable RJ. Physiological actions of taurine. Physiol. Rev., 72, 101–163 (1992).
- 52) Ito T, Schaffer SW, Azuma J. The potential usefulness of taurine on diabetes mellitus and its complications. Amino Acids, 42, 1529–1539 (2012).
- 53) Sirdah MM. Protective and therapeutic effectiveness of taurine in diabetes mellitus: a rationale for antioxidant supplementation. Diabetes Metab. Syndr., 9, 55–64 (2015).
- 54) Bartke N, Hannun YA. Bioactive sphingolipids: metabolism and function. J. Lipid Res., 50 (Suppl.), S91–S96 (2009).
- 55) Spiegel S, Merrill AH Jr. Sphingolipid metabolism and cell growth regulation. FASEB J., 10, 1388–1397 (1996).
- 56) Yang Y, Lee M, Fairn GD. Phospholipid subcellular localization and dynamics. J. Biol. Chem., 293, 6230–6240 (2018).
- 57) Penberthy WT. Nicotinamide adenine dinucleotide biology and disease. Curr. Pharm. Des., 15, 1–2 (2009).
- 58) Zhai RG, Rizzi M, Garavaglia S. Nicotinamide/nicotinic acid mononucleotide adenylyltransferase, new insights into an ancient enzyme. Cell. Mol. Life Sci., 66, 2805–2818 (2009).
- 59) Fichman Y, Gerdes SY, Kovács H, Szabados L, Zilberstein A, Csonka LN. Evolution of proline biosynthesis: enzymology, bioinformatics, genetics, and transcriptional regulation. Biol. Rev. Camb. Philos. Soc., 90, 1065–1099 (2015).
- 60) Schaap FG, Trauner M, Jansen PL. Bile acid receptors as targets for drug development. Nature Reviews Gastroenterology & Hepatology, 11, 55–67 (2014).
- 61) Duboc H, Rajca S, Rainteau D, et al. Connecting dysbiosis, bile-acid dysmetabolism and gut inflammation in inflammatory bowel diseases. Gut, 62, 531–539 (2013).
- 62) de Aguiar Vallim TQ, Tarling EJ, Edwards PA. Pleiotropic roles of bile acids in metabolism. Cell Metab., 17, 657–669 (2013).