Regular Articles
Effect of Chronic Kidney Disease on Hepatic Clearance of Drugs in Rats
2020 年 43 巻 9 号 p. 1324-1330
詳細
2020 年 43 巻 9 号 p. 1324-1330
The pharmacokinetics of some hepatically cleared drugs have been reported to fluctuate in patients with renal impairment, but the definitive factors have not been clarified. We compared the pharmacokinetics of some drugs with different hepatic elimination processes in a chronic kidney disease (CKD) rat model, to optimize their administration during kidney injury. We chose indocyanine green (ICG), midazolam (MDZ), and acetaminophen (APAP) as reference drugs to determine changes in hepatic clearance pathways in presence of CKD. Drugs were intravenously administered via the jugular vein to the CKD model rats, previously established by adenine administration, and then, blood, bile, and urine samples were collected. The plasma concentration of ICG, which is eliminated into the bile without biotransformation, increased; and its total body clearance (CLtot) significantly decreased in the CKD group compared to the control group. Moreover, the plasma concentrations of MDZ and APAP, metabolized in the liver by CYP3A and Ugt1a6 enzymes, respectively, were higher in the CKD group than in the control group. The biliary clearances of APAP and its derivative APAP-glucuronide increased in the CKD group, whereas their renal clearances were markedly decreased with respect to those in the control group. Altogether, plasma concentrations of some hepatically eliminated drugs increased in the CKD rat model, but depending on their pharmacokinetic characteristics. This study provides useful information for optimizing the administration of some hepatically cleared drugs in CKD patients.
Chronic kidney disease (CKD) is currently one of the most common diseases worldwide. Several studies have estimated that about 30% of people over the age of 65 have CKD.1,2) When CKD patients are treated with drugs mainly eliminated via kidney, their dosages or administration periods need to be optimized according to the renal function. However, we generally use hepatically cleared drugs without adjusting the dose, while several pharmacokinetics (PK) studies have reported that CKD altered their hepatic clearance.3)
The hepatic clearance relies on hepatic blood flow, protein binding, and hepatic intrinsic clearance. Nevertheless, many studies have evaluated the effects of CKD on the drug PK, focusing on hepatic metabolism, particularly expression and activity of metabolic enzymes.4,5)
In this study, we evaluated PK of various drugs eliminated by liver, such as indocyanine green (ICG), midazolam (MDZ), and acetaminophen (APAP), in the adenine-induced CKD rat model, focusing not only on drug metabolism but also on physiological changes associated with kidney injury.
QuantiChrom™ Urea Assay Kit II was purchased from BioAssay Systems, Hayward, CA, U.S.A.). ICG was provided by Daiichi Sankyo Pharmaceutical Co., Ltd. (Tokyo, Japan). MDZ (Dormicum®) was purchased from Astellas Pharma Inc. (Tokyo, Japan). APAP derived from Tokyo Chemical Industry (Tokyo, Japan). LabAssay™ supplied Creatinine, Transaminase CII-test Wako, and methyl cellulose 400 (MC); meanwhile, adenine, diazepam, and salicylamide were received from Wako Pure Chemical Industries, Ltd. (Osaka, Japan). Bromocresol green was obtained from Nacalai Tesque Inc. (Kyoto, Japan). Bovine serum albumin (BSA) was provided by Sigma-Aldrich (St. Louis, MO, U.S.A.). APAP-glucuronide was purchased from Toronto Research Chemicals Inc. (North York, ON, Canada). All other chemicals were of the highest available purity.
CKD Animal ModelMale 6-week-old Wistar rats were obtained from Japan SLC Inc (Shizuoka, Japan) and allowed free access to standard laboratory diet (MF, Oriental Yeast, Co., Ltd., Tokyo, Japan) and water. All animal experiments were performed according to the Guidelines for Animal Experimentation of Nagasaki University (Nagasaki, Japan) and approved by the Committee on Animal experimentation of Nagasaki University (approval number: 1607081322-3).
Adenine-induced CKD rat model (CKD group) was established following previous reports with minor modification.6,7) Adenine suspended in 0.5% MC solution (100 mg/mL) was orally given to each rat at a dose of 4 mL/kg daily for 2 weeks. Control rats (MC group) were orally treated with 0.5% MC solution alone for 2 weeks.
Serum concentrations of creatinine and urea nitrogen as well as alanine aminotransferase (ALT) activity were determined with LabAssay™ Creatinine, QuantiChrom™ Urea Assay Kit II, and Transaminase CII-test Wako tests, respectively. Serum albumin concentration was evaluated according to a previously described method.8) Briefly, 10 µL of serum were diluted with 1.0 mL bromocresol green (50 µM) in citrate buffer (pH 4.0) and incubated at room temperature for 10 min. The absorbance values of those solutions were determined using UV-1850 (Shimadzu, Kyoto, Japan) at 628 nm. The standard curve was prepared with standardized concentrations of BSA in saline solution.
Drug AdministrationRats were anesthetized by intraperitoneally (i.p.) injection of an anesthesia cocktail [midazolam (2 mg/kg)/medetomidine (0.375 mg/kg)/butorphanol (2.5 mg/kg)] for ICG and APAP PK analyses. For MDZ PK analysis, rats were anesthetized with sodium pentobarbital (50 mg/kg, i.p.). After the anesthetization, rats were placed under a heat lamp to maintain the body temperature at 37°C. The left femoral artery and common bile duct were cannulated using a polyethylene tube 1 (i.d. 0.5 mm, o.d. 0.8 mm, Natsume Seisakusho Co., Ltd., Tokyo, Japan) or tube 2 (i.d. 0.28 mm, o.d. 0.61 mm, Becton Dickinson & Co., Parsippany, NJ, U.S.A.), respectively. Later, a drug solution (ICG: 4 mg/kg, MDZ: 5 mg/kg, or APAP: 10 mg/kg) was intravenously (i.v.) administered to the rats via the jugular vein. The dosage of ICG, MDZ and APAP was determined based on our previous animal study9,10) and clinical dosage. To determine the drug plasma concentration, blood samples were collected at the selected times from the heparinized cannula inserted into the femoral artery over 60 min (ICG, MDZ) or 90 min (APAP). Blood was centrifuged at 17860 × g for 5 min at room temperature. Bile samples were collected into weighed test tubes at 10 min intervals for 60 min (ICG) or 90 min (APAP). At 90 min after administration of APAP, urine was collected directly from the bladder by a syringe.
Analytical MethodThe concentrations of drugs in the plasma, bile, and urine were determined as follows. The ICG concentrations were spectrophotometrically determined at 805 nm (UV-1850), after proper dilution with 0.1% BSA saline solution as a stabilizer.11) The concentrations of MDZ were determined by HPLC including an UV detector (SPD-20Av, Shimadzu) following an established method.12) The APAP, and APAP-glucuronide concentrations were determined by HPLC via an UV detector as previously reported13) with minor modifications. The sample was mixed with methanol and 1 mg/mL salicylamide (internal standard), and then centrifuged at 17860× g for 5 min. The supernatants were evaporated under nitrogen gas at 49°C, and dried samples were dissolved in 0.05 M formic acid–methanol solution (90 : 10; v/v). The HPLC conditions were follows: column, InertSustain® C18 (GL Sciences Inc., Tokyo, Japan); column temperature, 40°C; flow rate, 1.2 mL/min; and detector, SPD-20Av, 254 nm. Mobile phase consisted of gradient elution of 0.05 M formic acid and methanol as follows; started with 100% 0.05 M formic acid and slowly decreased to 70% in 7 min, maintained there for 4 min, and then back to the initial conditions (100% 0.05 M formic acid).
Calculation of Pharmacokinetic ParametersDrug concentrations were presented as dose percent; meanwhile, the area under the plasma concentration–time curve (AUCp, inf) and mean residence time (MRTp, inf) were calculated by the non-compartment model. This analysis was performed by numerical integration using a linear trapezoidal formula and extrapolating the data to infinity time based on a mono-exponential equation. The total body clearance (CLtot) and volume of distribution at steady state (Vss) were calculated by dose/AUCp, inf and CLtot × MRTp, inf, respectively. The cumulative amounts of ICG, APAP, or APAP-glucuronide excreted into the bile were calculated by multiplying each concentration by the sample volume. To evaluate the excretion and metabolism capabilities in the liver and kidney, the biliary excretion clearance (CLb), the renal clearance (CLr), and the metabolic clearance (CLm) were calculated as follows: CLb = Xb/AUCp, finite, CLr = Xu/AUCp,finite, and CLm = Xm/AUCp,finite. Xb represents the cumulative amount into the bile of ICG, APAP, or APAP-glucuronide. Xu represents total amount into the urine of APAP or APAP-glucuronide. Xm represents total amount of APAP-glucuronide excreted into the urine and bile.
RNA Preparation, Reverse Transcription, and Quantitative Real Time PCRThe liver samples were collected after PK analysis and stored at −80°C. The frozen samples were homogenized with BioMasher® II (Nippi Inc., Tokyo, Japan), and then, total RNA was isolated according to the manufacturer’s protocol (ReliaPrep™ RNA Tissue Miniprep System, Promega Corp., Madison, WI, U.S.A.). RNA concentration was spectrophotometrically determined using UV-1850 at 260 nm.
Total RNA was reverse transcribed into cDNA using the PrimeScript™ RT Master Mix (TaKaRa Bio Inc., Shiga, Japan) according to the manufacturer’s instructions. Quantitative real time PCR was performed in a final volume of 25 µL using TB Green Premix Ex Taq™ II (TaKaRa Bio Inc.) and Thermal Cycler Dice® Real Time System Lite (TaKaRa Bio Inc.). The reagent concentrations in the amplification mix and thermal cycling conditions were set according to the manufacturer’s instructions. The target transcript expression levels were calculated as the ratio of the control group normalized to the endogenous reference (Gapdh). The primer sequences used in this study are shown in Supplementary Table 1.14,15)
Statistical AnalysisStatistical comparisons were performed by Student’s t-test using JMP Pro 13 (SAS Institute Inc., Cary, NC, U.S.A.), and p < 0.05 was considered statistically significant. Results are expressed as the mean value ± standard error (S.E.).
Serum creatinine and urea nitrogen concentrations were measured as biomarkers of renal function. Serum creatinine concentration was significantly increased in the CKD group (3.08 mg/dL ±0.08) compared to the MC group (0.63 mg/dL ±0.03). A similar trend was observed in serum urea nitrogen concentration (MC group: 25.9 mg/dL ±2.3, CKD group: 307.1 mg/dL ±35.4), and thus we confirmed that kidney injury was induced by adenine. On the other hand, adenine treatment did not increase ALT activity (MC group: 9.1 IU/L ±0.4, CKD group: 12.3 IU/L ±1.2) or affect albumin concentration (MC group: 2.77 g/dL ±0.20, CKD group: 3.30 g/dL ±0.10) in serum.
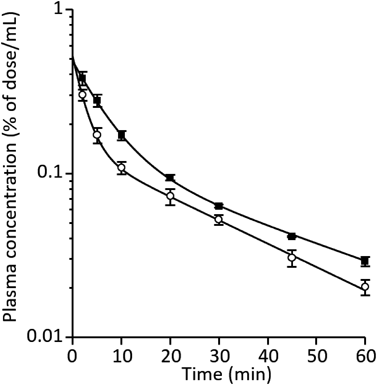
Effects of CKD on ICG PKFigures 1A and B show the plasma concentration and biliary excretion rate-time profiles after i.v. ICG administration of 4 mg/kg to the CKD and MC groups. The ICG plasma concentration was much higher in the CKD group than in the MC group (Fig. 1A). The ICG biliary excretion was slightly delayed in the CKD group compared to that of the MC group (Fig. 1B). Table 1 summarizes the pharmacokinetic parameters for the plasma concentration and biliary excretion rate profiles of ICG. Although AUCp and MRTp increased, ICG CLb did not significantly decrease in the CKD group compared to the MC group (Table 1).

Each symbol represents mean ± S.E. of three experiments.
| MC | CKD | |
|---|---|---|
| AUCp, inf (% of dose·min/mL) | 95.6 ± 5.1 | 166** ± 8.3 |
| MRTp, inf (min) | 39.0 ± 3.6 | 68.1** ± 3.2 |
| CLtot (mL/min) | 1.05 ± 0.06 | 0.61** ± 0.03 |
| Vss (mL) | 40.7 ± 2.6 | 41.1 ± 2.4 |
| Xb (% of dose) | 49.9 ± 3.7 | 52.8 ± 8.0 |
| CLb (mL/min) | 0.68 ± 0.05 | 0.54 ± 0.1 |
Each value represents mean ± S.E. of three experiments (** p < 0.01 vs. MC group).
The plasma concentrations of MDZ in the CKD and MC groups after i.v. administration to at a dose of 5 mg/kg are shown in Fig. 2. Plasma concentration was higher in the CKD group than the MC group. Table 2 lists the pharmacokinetic parameters of MDZ. The AUCp increased in the CKD group compared to the those in the MC group. On the other hand, CLtot and Vss are decreased about 30% in the CKD group compared to those in the MC group.
Each symbol represents mean ± S.E. of three experiments.
| MC | CKD | |
|---|---|---|
| AUCp, inf (% of dose·min/mL) | 4.85 ± 0.5 | 6.88** ± 0.2 |
| MRTp, inf (min) | 27.3 ± 0.5 | 28.7 ± 2.2 |
| CLtot (mL/min) | 21.0 ± 2.1 | 14.6* ± 0.5 |
| Vss (mL) | 573 ± 49 | 419 ± 42 |
Each value represents mean ± S.E. of three experiments (* p < 0.05 vs. MC group).
The plasma concentration and biliary excretion rate profiles of APAP and APAP-glucuronide after i.v. administration of 10 mg/kg APAP to the CKD and MC groups are shown in Fig. 3. Plasma concentrations (Figs. 3A, B) and biliary excretion rates (Figs. 3C, D) of APAP and APAP-glucuronide were increased in the CKD group compared to those in the MC group. Table 3 compares APAP pharmacokinetic parameters between CKD and MC groups. The AUCp and CLtot increased and decreased, respectively, in the CKD group compared to the those in the MC group. Figure 4 represents the biliary and renal clearance of APAP as well as the biliary, renal, and metabolic clearance of APAP-glucuronide, produced from APAP, after i.v. administration of 10 mg/kg APAP to rats. A marked increase of APAP CLb and reduction of APAP CLr were observed in the CKD group, compared to those of the MC group (Fig. 4A). A similar trend was observed for the APAP-glucuronide clearance (Fig. 4B). In addition, CLm, sum of CLb and CLr of APAP-glucuronide, did not change between CKD and MC groups (Fig. 4B).

Each symbol represents mean ± S.E. of three experiments. Plasma concentrations (A, B) and biliary excretion rates (C, D) of APAP and APAP-glucuronide were shown, respectively.
| MC | CKD | |
|---|---|---|
| AUCp, inf (% of dose·min/mL) | 16.6 ± 0.6 | 37.1* ± 4.8 |
| MRTp, inf (min) | 41.1 ± 3.6 | 81.0 ± 17 |
| CLtot (mL/min) | 6.04 ± 0.2 | 2.78** ± 0.3 |
| Vss (mL) | 248 ± 11 | 217 ± 30 |
Each value represents mean ± S.E. of three experiments (* p < 0.05, ** p < 0.01 vs. MC group).

Each bar represents mean + S.E. of three experiments (* p < 0.05 vs. MC group).
We evaluated the mRNA expression of drug-metabolizing enzymes in the CKD group (Supplementary Fig. 1). The Cyp3a2 and Ugt1a6 mRNA expression levels decreased in the CKD group compared to those in the MC group, but only the first reduction was statistically significant. On the other hand, Cyp2e1 mRNA expression was significantly higher in the CKD group compared to that in MC group.
It has been reported that kidney injury affects not only kidney but also various tissues, such as liver, heart, brain, and bone.16,17) Biochemical and physiological changes accompanied by the kidney injury can vary the drug PK, while several studies have evaluated the pharmacokinetics of CKD patients focusing on hepatic metabolic enzymes. Based on the well-stirred model, the removal of hepatically-cleared drugs from the systemic circulation involves hepatic blood flow, drug unbound fraction in the blood, and drug metabolizing enzyme activity. CKD may theoretically impact on each aspect of these factors, and thus classify hepatic blood-flow-limited drugs with high (> 0.7), low (< 0.3), and intermediate-extraction ratio.18) In this study, we administrated three drugs with different pharmacokinetic characteristics to CKD rat model and evaluated their disposition to analyze which factors are involved in pharmacokinetics during CKD.
It has been reported that the adenine induced nephropathy model in rats can regulate the degree of nephropathy by the does or duration of adenine.19) There are reports of CKD model with 10 d of administration of adenine at the shortest,20) those CKD models also cause complications such as hyperphosphatemia caused by human CKD pathology although the administration period is short. Therefore, we consider that it is suitable as a CKD model in that it is close to the pathology of human CKD. In addition, a simple correlation between glomerular filtration rate (GFR)/GFR0 (GFR of normal rats) and serum creatinine concentration was reported.21) According to this paper, it is considered that the GFR in this CKD model is reduced by about 80% and it corresponds to stage 4 (severe CKD) of clinical.
ICG has been commonly used for assessment of liver function, especially hepatic blood flow in clinical.22) ICG is transported by several transporters. It is reported that ICG enters through organic anion transporting polypeptides (OTAP1B1/3) and Na(+)/taurocholate cotransporter polypeptide (NTCP) expressed on the sinusoidal membrane of hepatocytes.23) Besides, it is also reported ICG elimination from hepatocytes is mainly due to efflux back to sinusoids, and biliary transport across the canalicular occurs across P-glycoprotein 2 (Mdr2).24) In this study, ICG clearance from the plasma was delayed in the CKD group (Fig. 1A) and then, ICG CLtot decreased to about 60% of MC group (Table 1). Thus, clearance of hepatic blood-flow-limited drug such as ICG, which has a high hepatic extraction ratio, was reduced during CKD due to the decrease in blood flow. It is reported that liver Oatp1 decreased in CKD rats25) although the expression or activity of Mdr2 in CKD rats has been unknown. Regarding whether CKD changes the CLb of ICG, further evaluation is needed focused on the expression or activity of these transporters during CKD. Recently, the concept of cardiorenal anemia syndrome has been proposed.26) In this concept, anemia in CKD patients is important factor involved in the deterioration of both heart disease and kidney disease. To develop the heart failure in CKD patients causes decrease of blood flow. It was reported that the plasma concentration of other hepatic blood-flow-limited drugs was also increased in CKD patients.27) Our results also suggested that the reduced hepatic blood flow may have also affected the elevation of their plasma concentrations.
MDZ is often used as a specific drug probe for CYP3A metabolism.28) Among the CYP3A subfamily, CYP3A4 is the most abundant metabolic enzyme in the liver and accounts for approximately 30% of the clinically used drugs.29) MDZ is an intermediate-extraction ratio drug30) and its unbound fraction is about 5%31); therefore, three determinants (hepatic blood flow, unbound fraction, and hepatic intrinsic clearance) are important factors for the MDZ PK. The MDZ plasma concentration was higher in the CKD group than the in the MC group (Fig. 2), and MDZ CLtot decreased to about two thirds compared to that of MC group (Table 2). Cyp3a2 sequence in rats is more than 90% identical and functionally equivalent to that of human CYP3A4.32) The Cyp3a2 mRNA expression in the liver was significantly decreased in the CKD group (Supplementary Fig. 1), and ICG clearance was delayed, indicating that hepatic blood flow was also decreased in CKD group. Therefore, the elevation of MDZ plasma concentration may have been caused by the alteration of these factors. In the previous study, we reported that the MDZ unbound fraction was approximately doubled in the presence of 500 µM indoxyl sulfate (IS), as the last one strongly binds to plasma protein especially albumin.10) In this study, IS plasma concentration in the CKD group was about 900 µM (data not shown), as a result, free fraction of MDZ may have increased. However, additional research is required to confirm which factor has the greatest impact on the MDZ PK. The mechanism of Cyp3a2 down regulation has been analyzed in CKD rats with hyperphosphatemia.33) According to this report, parathyroid hormone (PTH) concentration in plasma increases in CKD complication, and down regulation of Cyp3a2 occurs due to PTH mediated phosphatidylinositol 3-kinase (PI3K)/protein kinase C (PKC)/PKA/nuclear factor-kappaB (NF-κB) pathway. Moreover, such a phenomenon is considered to occur not only in CKD rats but in CKD patients, since down regulation of CYP3A has been reported in CKD patients.34)
In CKD patients with fever or pain, use of APAP is preferred instead of the nonsteroidal anti-inflammatory drugs to avoid the renal toxicity. APAP has been widely used as a safe antipyretic and analgesic drug within the range of clinically recommended dosage. APAP is mainly metabolized to APAP-glucuronide by UGT1A6.35) These metabolites are excreted into the bile and urine. At higher doses of APAP that the clinically recommended ones, these metabolic pathways become saturated and thus APAP is metabolized to N-acetyl-p-benzoquinone imine (NAPQI) by CYP2E1.36) NAPQI depletes glutathione and binds to cellular proteins, and then it causes hepatotoxicity.37) It has been reported that the expression levels of various metabolic enzymes or transporters changed in CKD, and urinary excretion of APAP metabolites was reduced.38) From this information, we hypothesized that PKs of APAP and its metabolites changed under the renal disease. However, there are few reports on the safety of APAP in CKD patients. APAP is an intermediate-extraction ratio drug,39) and its unbound fraction is about 80% within the clinical range40); therefore, it is conceivable that hepatic blood flow and hepatic intrinsic clearance are important factors for the APAP PK. APAP elimination from plasma was delayed in the CKD group (Fig. 3A) and APAP CLtot decreased to about half of the one observed in the MC group (Table 3). Urine excretion of APAP and APAP-glucuronide decreased in the CKD group (Fig. 4) because renal excretion of APAP correlates with GFR.41) Instead of reduced renal excretion, biliary excretion of APAP was increased. In this study, the mRNA expression of Ugt1a6 in CKD rats was hardly changed, therefore the capacity of APAP-glucuronide production in the liver might not change while the hepatic blood flow was decreased. In addition, the mRNA expression of Sult1a1 which is also responsible for APAP metabolism was not altered in CKD (data not shown). At the same time, biliary excretion of APAP-glucuronide is mediated by Mrp2, and there is also basolateral transport involving Mrp3.42) There are several reports that Mrp2 and Mrp3 expression increased in CKD rats.25,43) Therefore, excretion of APAP-glucuronide from the liver might increase in CKD rats. Further studies are needed on the activity of these transporters during CKD. Considering that APAP-glucuronide excreted into the bile undergoes enterohepatic circulation, it is probable that APAP exposure may increase in the CKD group and lead to APAP hepatotoxicity when Cyp2e1 expression is elevated. Further studies are needed to determine whether APAP hepatotoxicity is enhanced in CKD. The mechanism of Cyp2e1 up regulation has been discussed in acute renal failure rats induced by uranyl nitrate.44) According to this report, induction of Cyp2e1 in rats with renal failure might be accompanied by an increase in urea. In this study, urea nitrogen in plasma was significantly elevated in CKD rats, and it is suggested that up regulation of Cyp2e1 is caused by the same mechanism.
In conclusion, plasma concentrations of some hepatically eliminated drugs increased in the CKD rat model. This may be due to decreased of both hepatic blood flow and expression of drug metabolic enzymes, although it depended on the pharmacokinetic characteristics of the drug. This study revealed that not only activities of drug metabolizing enzymes, but also hepatic blood flow and drug unbound fraction could be changed during CKD. Further studies are needed to evaluate the influence of CKD on the PKs of the drugs actually used by these patients. In addition, pharmacodynamic properties of drugs under CKD should be evaluated for optimization of drug administration. These results might be useful for the development of drug therapies for CKD patients in the future.
We thank Yuri Arashi and Minami Nakahara for their skilled technical assistance. This work was supported by JSPS KAKENHI Grant Numbers JP16K18947 and JP19K07223.
The authors declare no conflict of interest.
The online version of this article contains supplementary materials.