Abstract
Dasatinib is a first-line pharmacotherapeutic treatment for chronic myeloid leukemia (CML). It is more effective than traditional treatments but causes adverse effects such as pleural effusion that limits its effective treatment cycle. Since pleural effusion is caused by vascular hyperpermeability and causes discontinuation of treatment with dasatinib, it is important to explore the mechanism of pleural effusion caused by dasatinib and how to prevent it. In this study, we investigated how dasatinib increase vascular permeability, and how it can be prevented. Cytotoxicity was observed in vascular endothelial cells or epithelial cells were exposed to high concentrations of dasatinib. Thus, it was observed in vascular endothelial cells such as human umbilical vascular endothelial cell (HUVEC). Vascular endothelial (VE)-cadherin is one of the important factors that control vascular permeability. When VE-cadherin expression decreases, vascular permeability increases, but it did not change with tyrosine kinase inhibitor exposure. Monolayer permeability significantly increased only with high concentration of dasatinib, but this increase was prevented by cAMP activation. Furthermore, dasatinib affects the cell morphology of HUVEC, with increased inter celluar space compared to control and bosutinib, which were also attenuated by cAMP activation. Dasatinib significantly affected permeability control of vascular endothelial cells compared to bosutinib and imatinib. These results indicated that the cAMP signaling pathway may be involved in the pleural effusion caused by dasatinib in CML patients.
INTRODUCTION
BCR-ABL targeted tyrosine kinase inhibitors (TKIs), such as imatinib, nilotinib and dasatinib, are used as first-line treatments for chronic myeloid leukemia (CML).1–3) Their therapeutic effects include the inhibition of its tyrosine kinase activity by binding for TKIs to the ATP binding site of BCR-ABL. However, TKIs also block kinases other than their therapeutic targets, which often results in associated adverse effects4–7) and TKI administration is interrupted or the dose is reduced due to these adverse events. Therefore, clarifying the mechanism of these adverse events is necessary in order to provide optimal treatment to patients. Recently, five TKIs including imatinib, nilotinib, dasatinib, bosutinib, and ponatinib have been approved for CML treatment in Japan. Treatment with nilotinib, dasatinib, and ponatinib is frequently accompanied by vascular adverse effects (VAE) that cause hypervascular permeability and abnormal angiogenesis. It has been reported that dasatinib has a high incidence of pleural effusion, while nilotinib and ponatinib have high incidences of peripheral arterial occlusion.8–10) Thus, the frequency of VAE onset differs among TKIs potentially due to the different inhibition profiles of kinases involved in vascular permeability and angiogenisis.11–14)
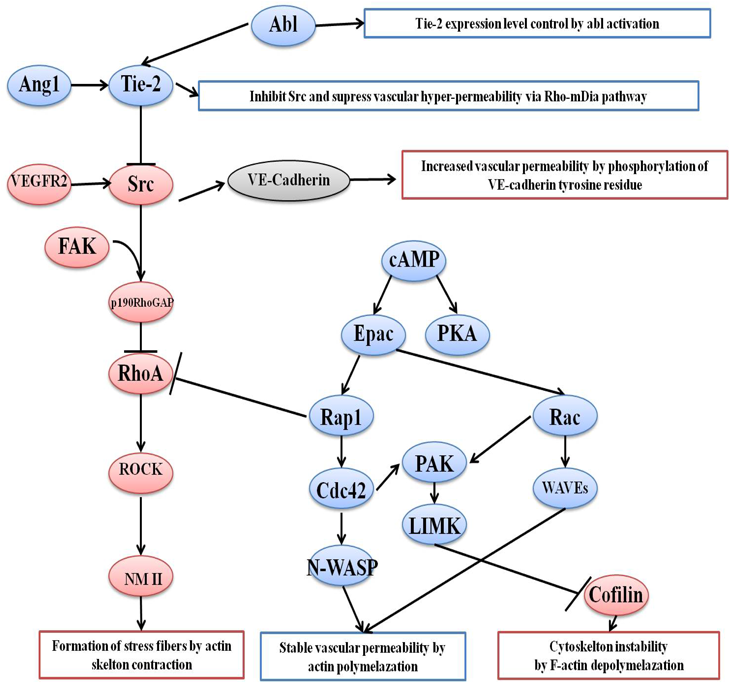
Vascular permeability is controlled by different kinases and Src is strongly inhibited by dasatinib, bosutinib, and ponatinib15–28) (Fig. 1). Additionally, vascular endothelial growth receptor 2 (VEGFR2) and Tie-2 are strongly inhibited by ponatinib; therefore, it is highly likely that VAE induced by ponatinib involves the inhibition of VEGFR2, Src, and Tie-2.14) Moreover, dasatinib is more likely to develop VAE by inhibiting Src than bosutinib, which has a similar kinase inhibition profile but does not develop the pleural effusion observed with dasatinib treatment. In previous study, dasatinib was reported to promote the activation of Rho-associated kinase (ROCK) by inhibiting Src, which resulted in the promotion of phosphorylation of non-muscle myosin 2 (NM2) and enhances vascular permeability.16) However, this study also reported that bosutinib did not affect vascular permeability and that the onset of pleural effusion was likely to involve kinases other than Src.16)
In addition to Src and Tie-2, various kinases are involved in the control of vascular permeability, including focal adhesion kinases (FAK). It has been reported that FAK forms a complex with Src to inactivate RhoA, resulting in inactivate downstream signaling of RhoA and prevent formation of stress fibers.27,28) Many factors are involved in controlling vascular permeability in addition to kinases. VE-cadherin is one such factor that has tyrosine residues that can be phosphorylated by Src, which results in the disruption of cell–cell adhesion and increased vascular permeability. However, since these factors or kinases involve Src, which is inhibited by dasatinib or bosutinib, the function of these pathways is unlikely to be the cause of the reported pleural effusion caused by dasatinib. In addition, the second messenger, cAMP synthesized from ATP by the action of adenylate cyclase, has been reported to be involved in vascular permeability control.22–24) cAMP functions to control vascular permeability by phosphorylating and activating downstream kinases, followed by the inactivation of RhoA and suppression of stress fiber formation. It is possible that dasatinib causes pleural effusion via this cAMP signaling pathway. Therefore, it is necessary to identify any kinases or factors that affect dasatinb-induced vascular hyperpermeability in order to clarify the causes of pleural effusion.
In this study, we investigated the effects of TKIs on blood vessels using human umbilical vascular endothelial cells (HUVECs), and to elucidate the mechanism of dasatinib-induced vascular hyperpermeability.
MATERIALS AND METHODS
MaterialsImatinib mesylate and dasatinib were purchased from Ark Pharm, Inc. (IL, U.S.A.). Bosutinib was purchased from Toronto Research Chemicals (Toronto, Canada). Imatinib was prepared as a 500 µg/mL stock solution in dimethyl sulfoxide (DMSO), and dasatinib and bosutinib were prepared as 50 µg/mL stock solutions in DMSO and stored at −20 °C. Dilution of the stock solution was diluted immediately before each experiment. All of the reagents were of the highest grade available and used without further purification.
Cell LinesHUVECs and human lung microvascular endothelial cells (HMVEC-Ls) were purchased from Lonza (Basel, Switzerland). Human retinal pigment epithelial cell-derived ARPE-19 cells were obtained from RIKEN (Ibaraki, Japan). HUVECs, HMVEC-Ls, and ARPE-19 cells were cultured using the endothelial cell growth medium kit 2 (TaKaRa Bio Inc., Shiga, Japan), the EGM2MV bullet kit (Lonza), and Dulbecco’s modified Eagle’s medium (DMEM)/Ham’s F-12 medium (FUJIFILM Wako Pure Chemical Corporation, Osaka, Japan) containing 100 IU/mL penicillin sodium and 100 µg/mL streptomycin, respectively. Cell cultures were maintained at 37 °C in a 5% CO2 atmosphere.
Cell Viability AssayCell viability was assessed using a Cell Counting Kit-8 (CCK-8) (Dojindo, Kumamoto, Japan). Briefly, cells were seeded at a 1.0 × 10⁴ density in the wells of a 96-well microplate and the drug solutions or a drug-free medium was added. After drug exposure for 24, 48, and 72 h, CCK-8 assay solution was added to each well and the plates were incubated at 37 °C for 2 h. The absorbance was measured with an Infinite M200 micro plate reader (Tecan, Männedorf, Switzerland) at 450 nm and the growth curve was plotted.
Western BlottingCell suspensions were prepared at 1.0 × 10⁵ cells/mL and seeded on a human fibronectin-coated (5.0 µg/cm2) 6-well microplate and cultured at 37 °C and 5% CO2 until 90% confluence. Twenty-four hours after exposure to TKIs, the media in the wells were aspirated and the cells in each well were thoroughly washed with ice-cold phosphate-buffered saline (PBS). Then, cells were lysed with radio immunoprecipitation assay (RIPA) buffer (50 mM Tris- pH 7.4, 150 mM NaCl, 1% Triton-X, 1% sodium deoxycholic acid, 0.5 mM ethylenediaminetetraacetic acid (EDTA), 0.1% sodium dodecyl sulfate (SDS), Complete Mini, EDTA-free Protease Inhibitor Cocktail). The dissolved samples were centrifuged to remove debris and the supernatants were collected as total protein samples. Then, samples were mixed with 5× sample buffer (0.146 M Tris-pH 6.8, 0.1% bromophenol, 5% SDS, 25% 2-mercaptoethanol, 62.5% glycerol) and heated at 95 °C for 5 min. Protein (10 µg) was applied to the polyacrylamide gel and electrophoresed. The gel was transferred to a polyvinylidene fluoride (PVDF) membrane and blocked with 5% skim milk. The PVDF membrane was placed in an antibody solution (mouse anti-VE-cadherin monoclonal antibody diluted at 1 : 1000 in Tris Buffered Saline with Tween 20 (T-TBS), horseradish peroxidase (HRP)-conjugated goat anti-mouse immunoglobulin G (IgG) diluted at 1 : 10000 in T-TBS), and VE-cadherin expression was detected by chemiluminescence. β-Actin was used as a loading control. Antibodies against VE-cadherin (sc-9989) and β-actin (sc-47778) were purchased from Santa Cruz Biotechnology (TX, U.S.A.).
Permeability AssayHuman fibronectin coated (5 µg/cm2) 12-well Transwell® (Corning, NY, U.S.A.) plates were seeded with cell suspensions prepared at 2.0–4.0 × 10⁵ cells/mL at 500 µL/well into apical unit. Fresh medium was added to the basal units. Trans-epithelial-electrical-resistance (TEER) was measured using a Millicell ERS2 (Millipore, Germany) to confirm that the cells seeded in the Transwell plates formed a monolayer. After serum starvation, the TKI solution was added to the apical unit and incubated for 1 h. The TKI solutions in the apical and basal units were thoroughly washed with fresh medium before 100 µM fluorescein isothiocyanate (FITC)-dextran (mean molecular weight 3000–5000 Da) solution was added to the apical unit and incubated for 1 h. The solution in the basal unit was collected and the fluorescence intensity (Ex: 485, Em: 535 nm) was measured using a microplate reader.
Cell MorphologyCell suspensions (1.0 × 10⁵ cells/mL) were seeded into a human fibronectin-coated (5 µg/cm2) 24-well microplate and cultured until confluent. After serum starvation, Cell Brite™ Orange Cytoplasmic Membrane Dyes (Biotium, CA, U.S.A.) and Hochest33342 solution were added to stain the membrane and nucleus, respectively. After removing the staining solution, the cells were thoroughly washed and used in the drug exposure experiment. TKIs, Epac inhibitor, FAK inhibitor, and Tie-2 inhibitor were used to treat the stained cells for a certain period of time, and the cell morphology was observed using a fluorescence microscope BZ-9000 (Keyence, Osaka, Japan). cAMP activation was performed with 3-isobutyl-1-methylxanthine (IBMX) and forskolin treatment for 20 min before TKI exposure.
ImmunofluorescenceHUVECs were seeded onto 18 mm slides coated with fibronectin and cultured until confluence. After serum starvation, a TKI solution was added to the coverslips and incubated for 1 h. To activate cAMP, 200 µM IBMX and 20 µM forskolin were added before TKI exposure and pre-incubated for 20 min. The coverslips were then thoroughly washed with PBS. HUVECs were fixed with 4% paraformaldehyde for 10 min, permeabilized with PBS containing 0.1% Triton-X for 5 min at room temperature, and blocked with PBS containing 1% bovine serum albumin (BSA) for 30 min. Cells were incubated with a mouse VE-cadherin antibody (1 : 200) overnight at 4 °C, followed by incubation with an anti-mouse Alexa Fluor 488 secondary antibody (A-11001, 1 : 500; Invitrogen, MA, U.S.A.) and Hochest33342 solution (1 : 200; Dojindo) for 1h at room temperature. Coverslips were mounted to the slides, and signals were visualized using fluorescence microscope. The captured image was a part of a randomly shot of at least two distinct areas in each slide.
Statistical AnalysisQuantitative data are presented as the mean ± standard deviation (S.D.). Welch’s t-test was used to compare the differences between the two groups. Differences among multiple groups were compared using one-way ANOVA with a Dunnett’s t-test. Statistical significance was set at p < 0.05.
RESULTS
Dasatinib Significantly Affects Vascular Endothelial Cell ViabilityTo confirm the effect of each TKI on the proliferation of vascular endothelial cells, the cell viability after TKI exposure was measured. Imatinib showed approximately 100% cell viability at all concentrations tested (0.01, 0.1, 1, 10, 100, 500, 1000, and 2500 ng/mL) in HUVECs (Fig. 2A, some date not shown). Even at the recommended treatment trough concentration of 1000 ng/mL, cell viability was as high as 110.3 ± 13.0% even after 72 h of exposure, suggesting that imatinib is not likely to affect survival of blood vessels. However, dasatinib treatment decreased cell viability at concentrations of 50 ng/mL or more when compared with low concentration exposure. Dasatinib showed a decrease of 65.3 ± 2.0% after 72 h of exposure at 100 ng/mL, which is the concentration equivalent to the Cmax observed clinically (Fig. 2B). Thus, dasatinib may have a significant effect on blood vessels. No changes in cell viability was observed at the other tested dasatinib concentrations (0.01, 0.1, 1, 2.5, 5, and 10 ng/mL) (Fig. 2B, some data not shown). In addition, bosutinib treated cells did not show changes in cell viability even after at 250 ng/mL exposure, which is equivalent to blood concentration at maximum (Cmax), when compared with low concentration exposure (Fig. 2C). No greater changes in cell viability was observed at the other tested bosutinib concentrations (0.01, 0.1, 1, 10, 25, 50, and 100 ng/mL) (Fig. 2C, some data not shown). Similar studies were performed with ARPE-19 cells to determine whether the effects of TKIs on HUVECs were vascular cell specific. Similar results were observed for imatinib and bosutinib in ARPE-19 cells (Figs. 2D, F), while dasatinib showed 100% cell viability after 72 h exposure to 100 ng/mL, indicating a difference in its effect on ARPE-19 cells when compared to HUVECs (Fig. 2E).
TKI Did Not Affect VE-Cadherin Expression in HUVECWhen the VE-cadherin expression decreased, vascular permeability increased. We investigated whether the change in the expression of VE-cadherin due to TKI treatment was observed by Western blotting. The results showed that none of the TKIs affected VE-cadherin levels compared to the control (Fig. 3).
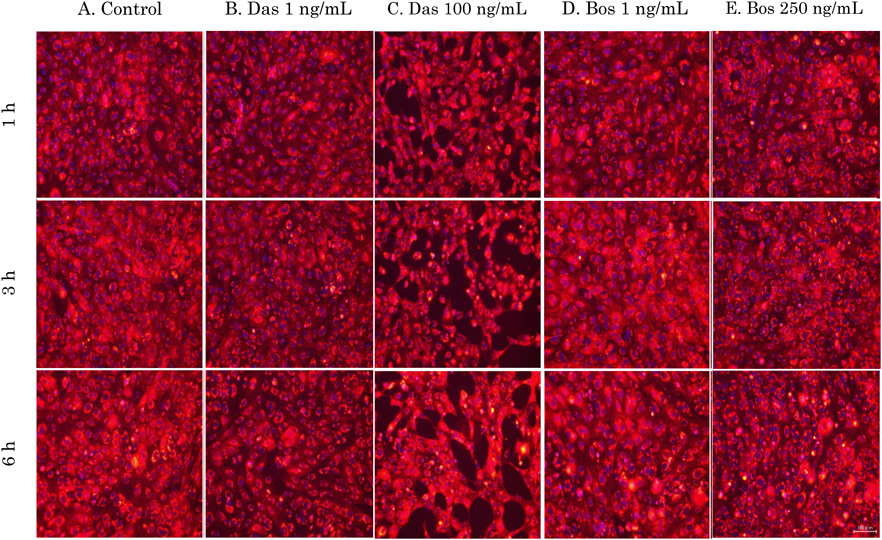
Signaling Pathways (FAK or Tie-2 or cAMP) That Affect Cell MorphologyMorphological changes in HUVECs after TKI exposure were observed using membrane staining. Dasatinib showed no change in cell morphology at low concentrations (1 ng/mL), but increased intercellular space was observed compared to the control when exposed to high concentrations (100 ng/mL) (Figs. 4A–C). In contrast, cells treated with bosutinib did not show any significant changes in morphology compared to the control (Figs. 4D, E). Increased intercellular space was observed only in dasatinib, but not in bosutinib despite treatment with Src inhibitors, suggesting other factors other than Src may be involved in this morphological change.
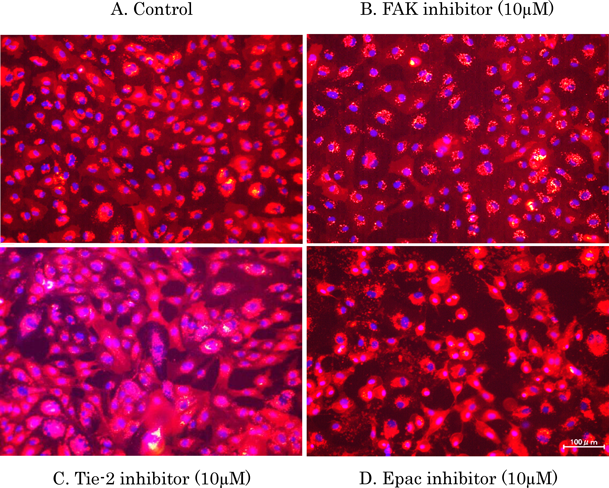
We next examined whether dasatinib could induce morphological changes when other vascular permeability regulators were inhibited. When FAK, which forms a complex with Src and inactivates RhoA, was inhibited, no change in cell morphology was observed as compared with the control (Figs. 5A, B). Conversely, when Tie-2 and Epac, which are downstream signals of cAMP, were inhibited, increased intercellular space was observed compared with the control (Figs. 5C, D). To confirm whether cAMP was directly or indirectly involved in the morphological changes caused by dasatinib, we examined whether these changes in HUVECs could be suppressed by activating cAMP using IBMX, which inhibits phosphodiestelase, and forskolin, which stimuluses adenylate cyclase. We found that the cell morphological change due to dasatinib treatment disappeared when cAMP was activated (Figs. 6A–D).
Dasatinib-Indued Hyperpermeability Was Suppressed by Activating cAMPWe investigated whether changes in cell morphology due to TKI exposure correlated with changes in cell permeability. Imatinib exposure did not increase cell permeability (Fig. 7A), while dasatinib significantly increased permeability at 100 ng/mL concentrations compared to that of the control (Fig. 7B). Although no increase in permeability was observed when cells were exposed to 1 and 10 ng/mL bosutinib, cell permeability significantly decreased when exposed to 250 ng/mL bosutinib (Fig. 7C). We also examined same study as HUVEC using HMVEC-L to investigate whether the effect of TKIs on HUVEC permeability was predominantly observed in HMVEC-Ls such as human lung microvascular endothelial cells. These results showed the same tendency as the result of HUVEC (Figs. 7D–F).
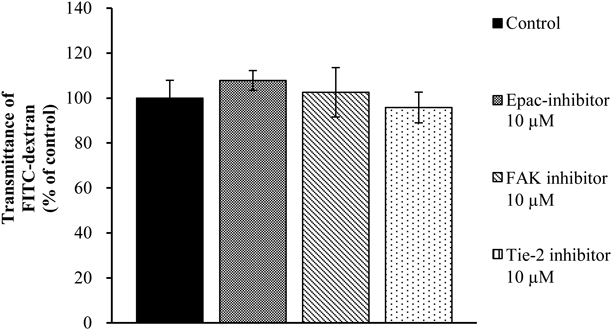
We further examined whether the increase in cell permeability observed with dasatinib treatment was also observed when vascular permeability factors were inhibited. We observed no significant differences in any of inhibitor-groups (Fig. 8). We also investigated whether dasatinib-induced permeability could be suppressed by activating the cAMP signaling pathway. We found that the increased vascular permeability induced by 100 ng/mL dasatinib was reduced when cAMP was activated (Fig. 9).
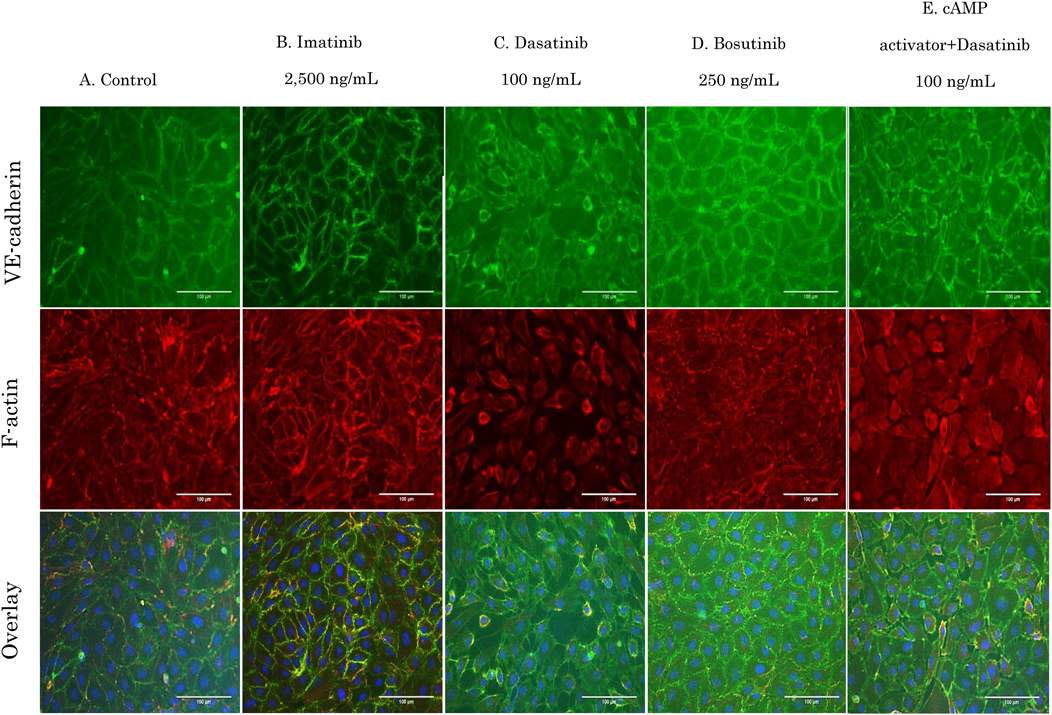
Changes in VE-Cadherin and F-Actin Expression Status by Dasatinib Were Retained by Activating cAMPImatinib had no effect on VE-cadherin and F-actin in HUVECs exposed to concentrations equivalent to Cmax (Figs. 10A, B). However, when cells were exposed to dasatinib, cell contraction and increased intercellular space were observed (Fig. 10C).
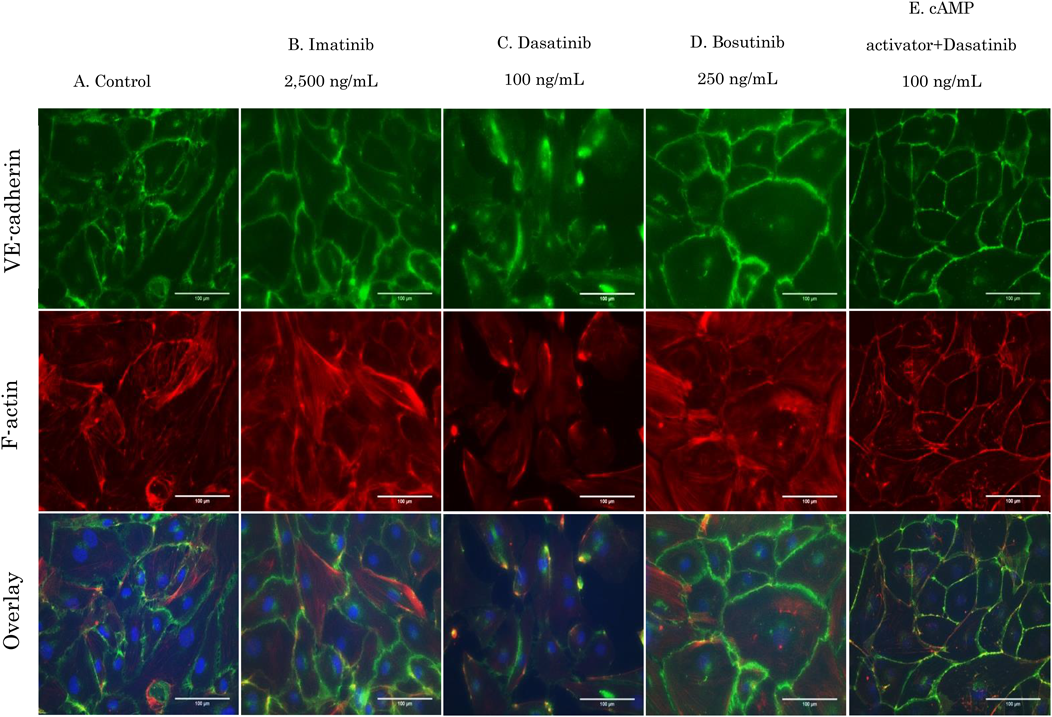
With a decrease in cell–cell adhesion, VE-cadherin became thinner and F-actin structures were thin, short, and irregular. Dasatinib therefore, may increase the intercellular space and induce vascular permeability by influencing the structure of F-actin. Bosutinib treatment did not affect cell morphology and retained cell–cell adhesion by VE-cadherin (Fig. 10D). When cAMP was activated, F-actin was formed along the cell–cell adhesion site, and strong VE-cadherin adhesion was confirmed (data not shown). In addition, dasatinib effects were suppressed when cAMP was activated (Fig. 10E). Similar experiments using HMVEC-Ls showed the same results as those observed with HUVECs (Figs. 11A–E).
DISCUSSION
Since TKIs used in CML pharmacotherapy have been reported to inhibit various kinases other than the target BCR-ABL molecule, various adverse events have been reported.13–17,29,30) In particular, VAE is a problematic adverse event in CML drug treatment, which includes pulmonary hypertension, pleural effusion, and peripheral arterial occlusion.7–10) If an adverse event such as VAE occurs, treatment is interrupted to prioritize the treatment of these side effects, which can influence the therapeutic effect on CML. Elucidation of the mechanism by which TKI causes VAE is important for reducing the risk of developing VAE and maximizing the therapeutic effect of TKI treatments. Therefore, we investigated the effects of TKIs on vascular endothelial cells using HUVECs, which are a type of human vascular endothelial cell, in this study. The results showed that high concentrations of dasatinib affected cell proliferation, but bosutinib and imatinib did not (Figs. 2A–C).
Dasatinib has a higher incidence of pleural effusion than other TKIs and a higher correlation between high trough blood concentration such as 1.5 ng/mL (about 3 nM) and pleural effusion have been reported.3) Additionally, when the trough blood concentration is high, the Cmax is often as high as 50–100 ng/mL (about 100–200 nM). The results of this study partially support that of previous findings. In addition, to confirm whether the effects of dasatinib on cells are vascular-specific, the effects of TKI exposure were examined using the ARPE-19 human retinal pigment epithelial cell line, which are derived from normal human epithelial cells. The results showed that none of the TKIs tested had a significant effect on cell proliferation (Figs. 2D–F). The effect of TKIs on blood vessels, which have a high risk of developing VAE, was consistent with this previous report,31) so we proceeded to elucidate a more detailed mechanism.
Pleural effusion, which is frequently observed with dasatinib treatment, is caused by increased vascular permeability. VE-cadherin is one of these regulation factors and a protein that binds to itself to form cell–cell adhesions.32) We did not observe a change in the expression of VE-cadherin in response to TKI treatment, suggesting that dasatinib may not directly affect cell–cell adhesion through VE-cadherin (Fig. 3). It has been reported that the tyrosine residue of VE-cadherin is phosphorylated by Src, which disrupts cell–cell adhesion and increases vascular permeability.17,18,33) Through this mechanism, dasatinib and bosutinib may inhibit Src and suppress vascular hyperpermeability, but dasatinib has been reported to induce pleural effusion.33) Furthermore, others studies reported that the inhibition of Src by dasatinib inhibits actin skeleton remodeling and enhances vascular permeability.16–18) This difference of the phenomenon could not be explained between dasatinib and other Src inhibitors such as bosutinib, if Src inhibition alone caused increased-vascular permeability. Therefore, it is possible that the onset of pleural effusion caused by dasatinib involves a mechanism other than Src.
In order to explore the mechanism of dasatinib-induced pleural effusion, we investigated the cell morphology of cells when factors other than Src that controls vascular permeability were inhibited. When Tie-2 and Epac were inhibited, cell morphological changes similar to those observed in cells treated with dasatinib were observed (Fig. 5). Furthermore, the changes in cell morphology and hyperpermeability due to dasatinib exposure were found to be correlated (Figs. 4, 7). These results suggested that Tie-2 and cAMP may be involved in the hyperpermeability caused by dasatinib treatment. Tie-2 is a receptor tyrosine kinase that has been reported as an agonist of Angiopoetin-1, which stabilizes vascular permeability.19,20) However, if the pleural effusion caused by dasatinib is mainly due to Tie-2 inhibition, then ponatinib, which strongly inhibits Tie-2, may have the same risk of developing pleural effusion as dasatinib. Then, the incidence of pleural effusion described in each package insert and the previous report is higher in dasatinib than ponatinib.34) Therefore, it is unlikely that dasatinib mainly inhibits Tie-2 and enhances vascular permeability.
The second messenger cAMP has been reported to suppress vascular permeability by stimulating downstream signals such as Rac1 and Rap, which control vascular permeability via a guanine nucleotide exchange factor called Epac.22–24) Epac has also been reported to suppress RhoA activation and inhibit vascular hyperpermeability.21,24,26) Therefore, we suspect that dasatinib can cause pleural effusion by reducing cAMP signaling, which increases vascular permeability. In order to clarify whether cAMP is involved in the dasatinib-induced hyperpermeability, we investigated whether the cell morphological changes and hyperpermeability observed in dasatinib-treated cells were suppressed by activating the cAMP signaling pathway. We found that cAMP treatment suppressed the cell morphological changes and hyperpermeability associated with dasatinib exposure (Figs. 6, 9). These results suggested that the increase in vascular permeability caused by dasatinib is directly or indirectly related to an inhibition of cAMP activity.
Previous study has reported that dasatinib hyperpermeability is caused by Src inhibition and the activation of the RhoA–ROCK pathway; however, an increase in RhoA levels was reported only in HUVECs treated with dasatinib and not bosutinib.16) In addition, there are some inconsistencies in the report, including that bosutinib had no reported change in permeability.16) However, our study suggests that the increase in RhoA may be due to a decrease in cAMP signaling. In fact, our results confirmed that blocking cAMP signaling affected cell morphology and further clarified that cAMP could suppress vascular hyperpermeability caused by dasatinib exposure (Figs. 6, 9). In addition, dasatinib treatment resulted in a sharp increase in stress fibers and cell morphological changes, while these effects were not observed after bosutinib treatment (Fig. 10). It has been reported that RhoA is inactivated not only by Src but also by Rap1 via cAMP.26) Bosutinib showed that cell morphology was maintained without increased stress fibers, suggesting that this signaling pathway is likely involved in dasatinib-induced pleural effusion (Fig. 10).
The results of experiments in HUVECs were almost consistent with those in HMVEC-Ls, which is a pulmonary microvascular endothelial cell line, indicating that the effect of dasatinib on blood vessels was not present in the lung (Fig. 11). Previous study reported that dasatinib developed pleural effusion in vivo and produced larger cell gaps in human lung epithelial cells than in HUVECs, which resulted in a lung-specific effect of dasatinib.35) However, this report did not explain why side effects other than pleural effusion that are caused by vascular permeability such as edema, are listed as low-risk. This may be because pleural effusion could be caused by differences in the accumulation of dasatinib in different organs. Consistent with this hypothesis, dasatinib showed high accumulation in the lung.36) Based on our study and these previous reports, we hypothesizes that the higher incidence of pleural effusion associated with dasatinib compared with other TKIs may be due to its accumulation in the lung and attenuation of the cAMP signaling pathway.
In conclusion, our results showed that dasatinib increased permeability and changes in cell morphology more than bosutinib and imatinib, and that these effects can be suppressed by the activation of cAMP. However, these results suggest that the pleural effusion caused by dasatinib might be prevented by activating cAMP, and may also affect the therapeutic effect of TKIs such as dasatinib. When cAMP is activated by drugs that inhibit phosphodiesterase (PDE), such as tadalafil, the adverse effects associated with PDE inhibition, such as myalgia, may also influence the therapeutic effects of dasatinib.37) It was further reported that when ponatinib, a type of BCR-ABL TKI, and forskolin, which activates adenylate cyclase, were used in combination, the therapeutic effect on imatinib-resistant CML cells was improved by cAMP activation in vitro.38) Although, the therapeutic application of activating cAMP to prevent VAE still needs to be examined, the current study may provide new insights that will help avoid the adverse effects caused by dasatinib.
Conflict of Interest
The authors declare no conflict of interest.
REFERENCES
- 1) Ohnishi K, Nakaseko C, Takeuchi J, Fujisawa S, Nagai T, Yamazaki H, Tauchi T, Imai K, Mori N, Yagasaki F, Maeda Y, Usui N, Miyazaki Y, Miyamura K, Kiyoi H, Ohtake S, Naoe T. Long-term outcome following imatinib therapy for chronic myelogenous leukemia, with assessment of dosage and blood levels: The JALSG CML202 study. Cancer Sci., 103, 1071–1078 (2012).
- 2) Nakamae H, Fukuda T, Nakaseko C, Kanda Y, Ohmine K, Ono T, Matsumura I, Matsuda A, Aoki M, Ito K, Shibayama H. Nilotinib vs. imatinib in Japanese patients with newly diagnosed chronic myeloid leukemia in chronic phase: long-term follow-up of the Japanese subgroup of the randomized ENESTnd trial. Int. J. Hematol., 107, 327–336 (2018).
- 3) Miura M. Therapeutic drug monitoring of imatinib, nilotinib, and dasatinib for patients with chronic myeloid leukemia. Biol. Pharm. Bull., 38, 645–654 (2015).
- 4) Riou M, Seferian A, Savale L, Chaumais MC, Guignabert C, Canuet M, Magro P, Rea D, Sitbon O, Jaïs X, Humbert M, Montani D. Deterioration of pulmonary hypertension and pleural effusion with bosutinib following dasatinib lung toxicity. Eur. Respir. J., 48, 1517–1519 (2016).
- 5) Kantarjian H, Shah NP, Hochhaus A, Cortes J, Shah S, Ayala M, Moiraghi B, Shen Z, Mayer J, Pasquini R, Nakamae H, Huguet F, Boqué C, Chuah C, Bleickardt E, Bradley-Garelik MB, Zhu C, Szatrowski T, Shapiro D, Baccarani M. Dasatinib versus imatinib in newly diagnosed chronic-phase chronic myeloid leukemia. N. Engl. J. Med., 362, 2260–2270 (2010).
- 6) Kantarjian HM, Cortes JE, Kim DW, Khoury HJ, Brümmendorf TH, Porkka K, Martinelli G, Durrant S, Leip E, Kelly V, Turnbull K, Besson N, Gambacorti-Passerini C. Bosutinib safety and management of toxicity in leukemia patients with resistance or intolerance to imatinib and other tyrosine kinase inhibitors. Blood, 123, 1309–1318 (2014).
- 7) Guignabert C, Phan C, Seferian A, Huertas A, Tu L, Thuillet R, Sattler C, Le Hiress M, Tamura Y, Jutant EM, Chaumais MC, Bouchet S, Manéglier B, Molimard M, Rousselot P, Sitbon O, Simonneau G, Montani D, Humbert M. Dasatinib induces lung vascular toxicity and predisposes to pulmonary hypertension. J. Clin. Invest., 126, 3207–3218 (2016).
- 8) Cortes JE, Jimenez CA, Mauro MJ, Geyer A, Pinilla-Ibarz J, Smith BD. Pleural effusion in dasatinib-treated patients with chronic myeloid leukemia in chronic phase: identification and management. Clin. Lymphoma. Myeloma Leuk, 17, 78–82 (2017).
- 9) Bondon-Guitton E, Combret S, Pérault-Pochat MC, Stève-Dumont M, Bagheri H, Huguet F, Despas F, Pathak A, Montastruc JL. Cardiovascular risk profile of patients with peripheral arterial occlusive disease during nilotinib therapy. Target. Oncol., 11, 549–552 (2016).
- 10) Tournaire G, Despas F, Huguet F, Montastruc JL, Bondon-Guitton E. Peripheral arterial occlusive disease during ponatinib therapy after failure of imatinib: a case report. J. Clin. Pharm. Ther., 41, 360–361 (2016).
- 11) Kitagawa D, Yokota K, Gouda M, Narumi Y, Ohmoto H, Nishiwaki E, Akita K, Kirii Y. Activity-based kinase profiling of approved tyrosine kinase inhibitors. Genes Cells, 18, 110–122 (2013).
- 12) Chuah C, Melo JV. Targeted treatment of imatinib-resistant chronic myeloid leukemia: focus on dasatinib. Onco. Targets. Ther, 2, 83–94 (2009).
- 13) von Amsberg GK, Koschmieder S. Profile of bosutinib and its clinical potential in the treatment of chronic myeloid leukemia. Onco. Targets. Ther., 6, 99–106 (2013).
- 14) Hamadi A, Grigg AP, Dobie G, Burbury KL, Schwarer AP, Kwa FA, Jackson DE. Ponatinib tyrosine kinase inhibitor induces a thromboinflammatory response. Thromb. Haemost., 119, 1112–1123 (2019).
- 15) Dasgupta SK, Le A, Vijayan KV, Thiagarajan P. Dasatinib inhibits actin fiber reorganization and promotes endothelial cell permeability through RhoA–ROCK pathway. Cancer Med., 6, 809–818 (2017).
- 16) Kreutzman A, Colom-Fernández B, Jiménez AM, Ilander M, Cuesta-Mateos C, Pérez-García Y, Arévalo CD, Brück O, Hakanen H, Saarela J, Ortega-Carrión A, de Rosendo A, Juanes-García A, Steegmann JL, Mustjoki S, Vicente-Manzanares M, Muñoz-Calleja C. Dasatinib reversibly disrupts endothelial vascular integrity by increasing non-muscle myosin II contractility in a ROCK-dependent manner. Clin. Cancer Res., 23, 6697–6707 (2017).
- 17) Gorbunova EE, Gavrilovskaya IN, Pepini T, Mackow ER. VEGFR2 and Src kinase inhibitors suppress andes virus-induced endothelial cell permeability. J. Virol., 85, 2296–2303 (2011).
- 18) Sun Z, Li X, Massena S, Kutschera S, Padhan N, Gualandi L, Sundvold-Gjerstad V, Gustafsson K, Choy WW, Zang G, Quach M, Jansson L, Phillipson M, Abid MR, Spurkland A, Claesson-Welsh L. VEGFR2 induces c-Src signaling and vascular permeability in vivo via the adaptor protein TSAd. J. Exp. Med., 209, 1363–1377 (2012).
- 19) Gavard J, Patel V, Gutkind JS. Angiopoietin-1 prevents VEGF-induced endothelial permeability by sequestering Src through mDia. Dev. Cell, 14, 25–36 (2008).
- 20) Chislock EM, Ring C, Pendergast AM. Abl kinases are required for vascular function, Tie2 expression, and angiopoietin-1-mediated survival. Proc. Natl. Acad. Sci. U.S.A., 110, 12432–12437 (2013).
- 21) Zhang XE, Adderley SP, Breslin JW. Activation of RhoA, but not Rac1, mediates early stages of S1P-induced endothelial barrier enhancement. PLOS ONE, 11, e0155490 (2016).
- 22) Kooistra MR, Corada M, Dejana E, Bos JL. Epac1 regulates integrity of endothelial cell junctions through VE-cadherin. FEBS Lett., 579, 4966–4972 (2005).
- 23) Cheng X, Ji Z, Tsalkova T, Mei F. Epac and PKA: A tale of two intracellular cAMP receptors. Acta Biochim. Biophys. Sin. (Shanghai), 40, 651–662 (2008).
- 24) Birukova AA, Zagranichnaya T, Alekseeva E, Bokoch GM, Birukov KG. Epac/Rap and PKA are novel mechanisms of ANP-induced Rac-mediated pulmonary endothelial barrier protection. J. Cell. Physiol., 215, 715–724 (2008).
- 25) Chernoff J. Close encounters of the LIM-kinase. Nat. Cell Biol., 1, E115–E117 (1999).
- 26) Ando K, Fukuhara S, Moriya T, Obara Y, Nakahata N, Mochizuki N. Rap1 potentiates endothelial cell junctions by spatially controlling myosin I activity and actin organization. J. Cell Biol., 202, 901–916 (2013).
- 27) Holinstat M, Knezevic N, Broman M, Samarel AM, Malik AB, Mehta D. Suppression of RhoA activity by focal adhesion kinase-induced activation of p190RhoGAP. J. Biol. Chem., 281, 2296–2305 (2006).
- 28) Tomar A, Lim ST, Lim Y, Schlaepfer DDA. FAK-p120RasGAP-p190RhoGAP complex regulates polarity in migrating cells. J. Cell Sci., 122, 1852–1862 (2009).
- 29) Remsing Rix LL, Rix U, Colinge J, Hantschel O, Bennett KL, Stranzl T, Müller A, Baumgartner C, Valent P, Augustin M, Till JH, Superti-Furga G. Global target profile of the kinase inhibitor bosutinib in primary chronic myeloid leukemia cells. Leukemia, 23, 477–485 (2009).
- 30) Vultur A, Buettner R, Kowolik C, Liang W, Smith D, Boschelli F, Jove R. SKI-606 (bosutinib), a novel Src kinase inhibitor, suppresses migration and invasion of human breast cancer cells. Mol. Cancer Ther., 7, 1185–1194 (2008).
- 31) Gover-Proaktor A, Granot G, Pasmanik-Chor M, Pasvolsky O, Shapira S, Raz O, Raanani P, Leader A. Bosutinib, dasatinib, imatinib, nilotinib, and ponatinib differentially affect the vascular molecular pathways and functionality of human endothelial cells. Leuk. Lymphoma, 60, 189–199 (2019).
- 32) Corada M, Mariotti M, Thurston G, Smith K, Kunkel R, Brockhaus M, Lampugnani MG, Martin-Padura I, Stoppacciaro A, Ruco L, McDonald DM, Ward PA, Dejana E. Vascular endothelial–cadherin is an important determinant of microvascular integrity in vivo. Proc. Natl. Acad. Sci. U.S.A., 96, 9815–9820 (1999).
- 33) Giannotta M, Trani M, Dejana E. VE-cadherin and endothelial adherens junctions: active guardians of vascular integrity. Dev. Cell, 26, 441–454 (2013).
- 34) García-Gutiérrez V, Hernández-Boluda JC. Tyrosine kinase inhibitors available for chronic myeloid leukemia: efficacy and safety. Front. Oncol., 9, 603 (2019).
- 35) Phan C, Jutant EM, Tu L, Thuillet R, Seferian A, Montani D, Huertas A, Bezu JV, Breijer F, Vonk Noordegraaf A, Humbert M, Aman J, Guignabert C. Dasatinib increases endothelial permeability leading to pleural effusion. Eur. Respir. J., 51, 1701096 (2018).
- 36) He K, Lago MW, Iyer RA, Shyu WC, Humphreys WG, Christopher LJ. Lacteal secretion, fetal and maternal tissue distribution of dasatinib in rats. Drug Metab. Dispos., 36, 2564–2570 (2008).
- 37) Gong B, Ma M, Xie W, Yang X, Huang Y, Sun T, Luo Y, Huang J. Direct comparison of tadalafil with sildenafil for the treatment of erectile dysfunction: a systematic review and meta-analysis. Int. Urol. Nephrol., 49, 1731–1740 (2017).
- 38) Oaxaca DM, Yang-Reid SA, Ross JA, Rodriguez G, Staniswalis JG, Kirken RA. Sensitivity of imatinib-resistant T315I BCR-ABL CML to a synergistic combination of ponatinib and forskolin treatment. Tumour Biol., 37, 12643–12654 (2016).