Regular Articles
Comparison of New Drug Indications Approved in the United States, Europe, and Japan from 2001 to 2020
2022 Volume 45 Issue 10 Pages 1495-1502
Details
2022 Volume 45 Issue 10 Pages 1495-1502
In Japan, there have been many requests for off-label drugs from academic societies or patient groups to the “Evaluation Committee on Unapproved or Off-labeled Drugs with High Medical Needs.” Thus, drug indications in Japan may be limited compared to those in other countries. To clarify whether drug indications in Japan are limited, the drugs containing new active ingredients approved in Japan, the United States, and Europe from 2001 to 2020 and sold in these three regions as of the end of 2020 were identified and their indications were compared. The indications of antineoplastic agents, psycholeptics, drugs from non-Japanese companies, and drugs approved in Japan from 2011 to 2020 were limited in Japan and Europe compared to the United States. These trends were more notable among antineoplastic agents. Thirty-seven indications for 19 antineoplastic agents were approved in the United States but not in Japan, and the most common indications were urothelial carcinoma (4), hepatocellular carcinoma (3), and thyroid cancer (3). The numbers of indications and drugs with different indications in Japan and Europe were generally comparable, and no specific imbalance was observed. The same indications of antineoplastic agents should be made promptly available in Japan and Europe as in the United States, as malignancy is one of the leading causes of death.
In recent years, attention has been focused on drug lags, in which drugs that can be used in the United States and Europe cannot be used in Japan, or drugs require a longer time to be approved in Japan.1,2) Drug approval time is evaluated as a contributing factor of drug lags because this time tended to be longer in Japan than the United States and Europe. Therefore, to shorten the approval time in Japan, the number of reviewers was increased and other efforts were made as part of the “Five-year strategy for creating innovative medicines and medical devices.”3) As a result, the approval time in Japan after 2011 has a median of <12 months, making it one of the fastest countries in the world, along with the United States.4) However, most drug lag studies focus only on the approval status and approval time in each country and do not consider the approved contents of the drugs. The indication, dosage, and other conditions must be determined, and when drugs are used accordingly, the expected efficacy is exhibited and the side effects are minimized. If the approved indications for the same drug are limited in a country compared to others, patients in that country miss out on the treatment opportunities available in other regions. In addition, drug use for unapproved indications is considered off-label use, which could put the patient’s safety at risk or increase the financial burden of the patient (by taking medication not covered by insurance). Therefore, the approved indications for drugs should be the same in Japan and overseas.
The approved indications of drugs may be limited in Japan compared to countries overseas. The Ministry of Health, Labor and Welfare’s “Evaluation Committee on Unapproved or Off-labeled Drugs with High Medical Needs” evaluates requests for drugs from academic societies or patient groups and requests that companies develop drugs with high medical needs. In the first to third rounds of the requests, there were 832 requests from academic societies or patient groups, of which 21% (172/832) were unapproved drugs and 79% (660/832) were off-label drugs.5) Of these, most drugs judged to have high medical needs were developed or submitted as public knowledge-based application to add new or pediatric indications or new dosage and administration.5) Thus, the indications of approved drugs in Japan and the expectations for new drugs face many challenges from the standpoint of medical professionals and patients.
Studies have compared drug indications between specific regions overseas. Most of these studies compared the United States and Europe and were limited to those comparing the drug indications in specific disease areas,6–8) the differences in indications,9,10) or whether the indications have changed during the approval review process.11) Some studies have included Japan, but they have only investigated the relationship between clinical trial design and indication in 38 anticancer drugs,12) or the number of indications in Japan, the United States, the United Kingdom, and Korea with a limited survey period (nine years) and number of drugs (81).13) No previous study has compared the indications over a long period without limiting the disease area and assessed whether specific regions have limited indications in the major pharmaceutical markets in the world: Japan, the United States, and Europe.14) Therefore, whether the approved drug indications in Japan are the same or limited compared to the United States and Europe is not fully understood.
The purpose of this study was to clarify whether drug indications in Japan are limited compared to those of the United States and Europe. Therefore, we compared the indications of new drugs approved in Japan, the United States, and Europe in the past 20 years without limiting the disease area.
The drugs containing new active ingredients approved in Japan, the United States, and Europe from 2001 to 2020 and sold in these three regions as of the end of 2020 were included for analysis. Only original prescription drugs (with the same/similar product name, developed/sold by the same company, or licensed products in Japan, the United States, and Europe) were included. Generics, biosimilars, over-the-counter drugs, nutritional supplements, medical devices, drugs containing the same active ingredient from different companies, or drugs approved by a procedure other than the centralized procedure in Europe were excluded from the study (Fig. 1).

a) Identified from the approved item database published by the Japan Pharmaceutical Manufacturers Association. US: United States, EU: Europe, JP: Japan.
Drugs containing new active ingredients approved in Japan from 2001 to 2020 were identified from the approved item database published by the Japan Pharmaceutical Manufacturers Association.15) For these drugs, the approval and marketing status in each region as of the end of 2020 was identified from the websites of the Pharmaceuticals and Medical Devices Agency (PMDA)16) in Japan, Drugs@FDA17) and DAILYMED18) in the Unites States, and the European Medicines Agency (EMA)19) in Europe, and the drugs were identified. Information regarding the generic name, initial approval year, and indications in each region from the websites and drug package inserts as of the end of 2020, Anatomical Therapeutic Chemical (ATC) classification,20) and corporate attributes (Japanese/non-Japanese)15) were entered into the database (depending on the drug, the indications upon initial approval and those added later were included).
Assessment of IndicationsWe compared the number of indications and drugs in each region. ATC classification, corporate attributes (Japanese/non-Japanese), and initial approval year in Japan were used for subgroup comparison. In this study, the definition of indication is the indicated disease. The other differences, such as prevention/treatment/(neo)adjuvant treatment, monotherapy/combination therapy, first line/other lines, severity, or condition of gene mutation were not considered if the indicated disease was the same. The number of indications in each drug was counted and compared among the regions. In addition, the relationship of indications between two regions by each drug was classified into four categories (same, more, less, or different), and those numbers of drugs were also presented. For example, if a drug in the United States (US) has indications A, B, and C but the drug in Europe (EU) and Japan (JP) has indications A and B, the numbers of indications were US: 3, EU: 2, and JP: 2, and it was classified as US > JP, EU = JP and US > EU. If the drug in Europe had indications A and C, it was classified as US > JP, EU ≠ JP and US > EU.
Quality ControlT.S. identified the drugs for the analysis, obtained the drug package inserts, assessed the indications, and entered the information into the database. Three independent researchers checked whether the assessment of indications and data entry were performed properly based on the drug package inserts. T.S. and S.M. reviewed the discrepancies identified in the check process and finalized the data based on the consensus.
Statistical AnalysisDescriptive statistics analyses were performed for the number of indications and drugs in each region using Microsoft Excel 2019. Fisher’s exact test was used to assess differences in proportions using EZR (Saitama Medical Center, Jichi Medical University, Saitama, Japan), a graphical user interface for R (The R Foundation for Statistical Computing, Vienna, Austria). More precisely, EZR is a modified version of R commander designed to add statistical functions frequently used in biostatistics.21) p-Values <0.05 were considered statistically significant.
The number of the drugs containing new active ingredients approved in Japan, the United States, and Europe from 2001 to 2020 and sold in these three regions as of the end of 2020 was 298 (Fig. 1). The most common ATC classification was L (antineoplastic and immunomodulating agents), which accounted for 37.9% of the drugs (Table 1a). Approximately 74.2% of the drugs came from non-Japanese companies (Table 1b). The distribution of initial approval years (median) in each region was similar; however, drugs in Japan tended to be approved more recently (2014) than in the United States (2012) and Europe (2012) (Table 1c).
 |
1a: The 298 drugs approved in the United States, Europe, and Japan classified by ATC classification. 1b: The 298 drugs classified by corporate attributes (Japanese/non-Japanese) based on the approved item database published by the Japan Pharmaceutical Manufacturers Association. 1c: The distribution of first approval year in each region for the 298 drugs. US: United States, EU: Europe, JP: Japan.
The total number of indications tended to be smaller in Japan (564) and Europe (545) than in the United States (583) (Table 2a). In addition, approximately 70% of the drugs had the same indications among the regions. The number of drugs with different indications based on the relationships of indications between two regions were US > JP: 50 (16.8%), US < JP: 32 (10.7%), US > EU: 45 (15.1%), US < EU: 22 (7.4%), and the drugs tended to have more indications in the United States than in Japan or Europe (Table 2b).
 |
2a: The number of indications for the 298 drugs approved in the United States, Europe, and Japan. 2b: The number of drugs based on the relationship of indications between two regions by each drug (same, more, less, or different) (e.g., US > JP: Drugs with more indications in the U.S. than Japan. US = JP: Drugs with same indication in the U.S. and Japan. US < JP: Drugs with more indications in Japan than the U.S. US ≠ JP: Drugs with different indications in the U.S. and Japan). US: United States, EU: Europe, JP: Japan.
Regarding ATC classification first level, the indication of L (antineoplastic and immunomodulating agents) and N (nervous system) drugs was limited in Japan and Europe compared to the United States based on the number of indications and drugs. The respective number of indications per drug (median/average) for L and N drugs was (2/2.31) and (1/1.75) in Japan, (1/2.18) and (1/1.60) in Europe, and (2/2.47) and (1.5/2.00) in the United States (Table 3a). In addition, the number of drugs with different indications based on the relationships of indications between two regions were L: US > JP: 24 (21.2%), US < JP: 14 (12.4%), US > EU: 24 (21.2%), and US < EU: 8 (7.1%), and N: US > JP: 6 (30.0%), US < JP: 1 (5.0%), US > EU: 5 (25.0%), and US < EU: 1 (5.0%) (Table 3b).
 |
3a: The number of indications per drug (median/average) for the 298 drugs approved in the United States, Europe, and Japan classified by ATC classification 1st level. 3b: The number of drugs based on the relationship of indications between two regions by each drug (same, more, less, or different) summarized by ATC classification 1st level. US: United States, EU: Europe, JP: Japan.
In comparison by ATC classification second level for L and N drugs, the indication of L01 (antineoplastic agents) and N05 (psycholeptics) drugs was limited in Japan and Europe compared to the United States. The respective number of indications per drug (median/average) for L01 and N05 drugs was (1/1.96) and (1/1.80) in Japan, (2/1.97) and (1/1.40) in Europe, and (2/2.37) and (2/2.60) in the United States (Table 4a). Particularly, the total number of indications for 73 L01 drugs were 143 in Japan, 144 in Europe, and 173 in the United States (Supplementary Table 2). In addition, the number of drugs with different indications based on the relationships of indications between two regions were L01: US > JP: 17 (23.3%), US < JP: 4 (5.5%), US > EU: 14 (19.2%), and US < EU: 3 (4.1%), and N05: US > JP: 4 (80.0%), US < JP: 0 (0%), US > EU: 4 (80.0%), and US < EU: 0 (0%). Thus, the drugs tended to have more indications in the United States than in Japan or Europe (Table 4b). The numbers of indications and drugs with different indications in Japan and Europe were generally comparable, and no specific imbalance between these two regions was observed (Tables 2–4).
 |
4a: The number of indications per drug (median/average) for L (113) and N (20) drugs classified by ATC classification 2nd level. 4b: The number of L (113) and N (20) drugs based on the relationship of indications between two regions by each drug (same, more, less, or different) summarized by ATC classification 2nd level. US: United States, EU: Europe, JP: Japan, L01: ANTINEOPLASTIC AGENTS, L02: ENDOCRINE THERAPY, L03: IMMUNOSTIMULANTS, L04: IMMUNOSUPPRESSANTS, N03: ANTIEPILEPTICS, N04: ANTI-PARKINSON DRUGS, N05: PSYCHOLEPTICS, N06: PSYCHOANALEPTICS, N07: OTHER NERVOUS SYSTEM DRUGS. * Everolimus is classified into both L01 and L04.
Regarding corporate attributes, the indication of drugs of non-Japanese companies was limited in Japan and Europe compared to the United States. Specifically, the number of indications per drug (median/average) for the drugs from non-Japanese companies tended to be smaller in Japan (1/1.93) and Europe (1/1.93) than in the United States (1/2.03) (Table 5a). In addition, the number of drugs with different indications based on the relationships of indications between two regions for the drugs of non-Japanese companies were US > JP: 38 (17.2%), US < JP: 22 (10.0%), US > EU: 30 (13.6%), and US < EU: 17 (7.7%) (Table 5b).
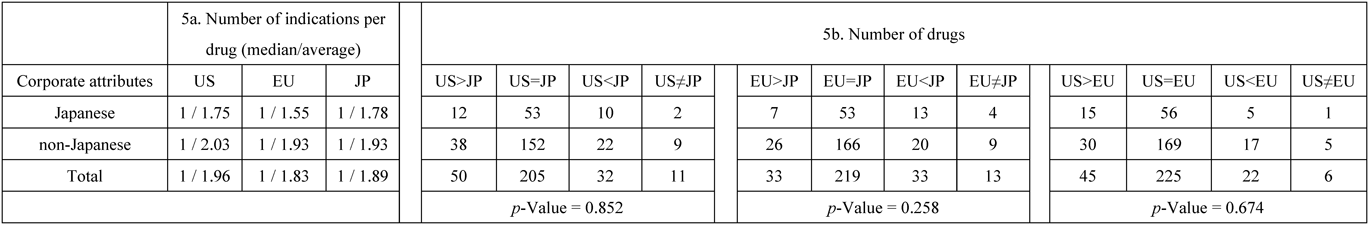 |
5a: The number of indications per drug (median/average) for the 298 drugs classified by corporate attributes (Japanese/non-Japanese) based on the approved item database published by the Japan Pharmaceutical Manufacturers Association. 5b: The number of drugs based on the relationship of indications between two regions by each drug (same, more, less, or different) summarized by corporate attributes. p-Values: Fisher’s exact test (e.g., number of drugs for US > JP, US = JP, US < JP, and US ≠ JP by Japanese or non-Japanese companies). US: United States, EU: Europe, JP: Japan.
In comparison by first approval year in Japan, the indication of drugs approved in Japan from 2011 to 2020 was limited in Japan and Europe compared to the United States. The number of indications per drug (median/average) for drugs approved in Japan from 2011 to 2020 was (1/1.74) in Japan, (1/1.69) in Europe, and (1/1.84) in the United States (Table 6a). Furthermore, the number of drugs with different indications based on the relationships of indications between two regions for the drugs approved in Japan from 2011 to 2020 were US > JP: 39 (17.6%), US < JP: 22 (10.0%), US > EU: 37 (16.7%), and US < EU: 16 (7.2%). Thus, the drugs tended to have more indications in the United States than in Japan and Europe (Table 6b).
 |
6a: The number of indications per drug (median/average) for the 298 drugs classified by first approval year in Japan. 6b: The number of drugs based on the relationship of indications between two regions by each drug (same, more, less, or different) summarized by first approval year in Japan. p-Values: Fisher’s exact test (e.g., number of drugs for US > JP, US = JP, US < JP, and US ≠ JP by first approval in 2001–2010 or 2011–2020). US: United States, EU: Europe, JP: Japan.
The limited indications in Japan and Europe compared to the United States in the comparison by corporate attributes and first approval year in Japan was more characteristic in L01 drugs. The number of indications per drug (median/average) for the L01 drugs of non-Japanese companies tended to be smaller in Japan (1/1.93) and Europe (1/1.95) than in the United States (1.5/2.41) (Table 7a). In addition, the number of drugs with different indications based on the relationships of indications between two regions for the L01 drugs of non-Japanese companies were US > JP: 13 (23.2%), US < JP: 2 (3.6%), US > EU: 12 (21.4%), and US < EU: 2 (3.6%). Therefore, these drugs tended to have more indications in the United States than in Japan and Europe (Table 7b).
 |
7a: The number of indications per drug (median/average) for L01 (73) drugs classified by corporate attributes (Japanese/non-Japanese) based on the approved item database published by the Japan Pharmaceutical Manufacturers Association and first approval year in Japan. 7b: The number of L01 (73) drugs based on the relationship of indications between two regions by each drug (same, more, less, or different) summarized by corporate attributes and first approval year in Japan. p-Values: Fisher’s exact test (e.g., number of drugs for US > JP, US = JP, US < JP, and US ≠ JP by Japanese or non-Japanese companies). US: United States, EU: Europe, JP: Japan.
The number of indications per drug (median/average) for L01 drugs approved in Japan from 2011 to 2020 tended to be smaller in Japan (1/1.86) and Europe (1/1.86) than in the United States (1/2.34) (Table 7a). Moreover, the number of drugs with different indications based on the relationships of indications between two regions for the drugs approved in Japan from 2011 to 2020 were US > JP: 16 (27.6%), US < JP: 3 (5.2%), US > EU: 13 (22.4%), and US < EU: 2 (3.4%). Thus, this classification of drugs also tended to have more indications in the United States than in Japan and Europe (Table 7b).
Indications Approved in the United States but Not in Japan for L01 Drugs and Their CharacteristicsThirty-seven indications were approved in the United States but not in Japan for 19 L01 drugs (US > JP: 17 and US ≠ JP: 2) and the characteristics were diverse (Table 8). The most common indications were urothelial carcinoma (4), hepatocellular carcinoma (3), and thyroid cancer (3), and the others were only 1 or 2 indications (Supplementary Table 6). Regarding the agent types (ATC classification third level for L drugs), the most common classifications were L01F (monoclonal antibodies and antibody drug conjugates) (22), and L01E (protein kinase inhibitors) (13). The prevalence and mortality of the common indicated diseases were generally comparable in the three regions, but those for hepatocellular carcinoma were higher in Japan than those in the United States and Europe.22–24)
 |
The characteristics of the 37 indications which were approved in the United States but not in Japan (L01, 19 drugs) are summarized. The indications with those number of 2 to 4 are presented in Table 8, and the other single indications are summarized in Supplementary Table 6. US: United States, EU: Europe, JP: Japan, L01B: ANTIMETABOLITES, L01E: PROTEIN KINASE INHIBITORS, L01F: MONOCLONAL ANTIBODIES AND ANTIBODY DRUG CONJUGATES, L01X: OTHER ANTINEOPLASTIC AGENTS. a) New cases/100000 people and deaths/100000 people in 2019 as urinary bladder cancer, liver and intrahepatic bile duct cancer, thyroid cancer, leukemia, uterine cancer (corpus and uterus, NOS), and kidney and renal pelvis cancer from U.S. Cancer Statistics Data Visualizations Tool (U.S. Cancer Statistics Working Group). b) New cases/100000 people and deaths/100000 people in 2020 as bladder cancer, liver cancer, thyroid cancer, leukemia, corpus uteri cancer, and kidney cancer from ECIS—European Cancer Information System (European Union). c) New cases/100000 people in 2018 and deaths/100000 people in 2020 as bladder cancer, liver cancer, thyroid cancer, leukemia, corpus uteri cancer, and kidney and urinary tract cancer excluding bladder cancer from Cancer Statistics (Cancer Information Service, National Cancer Center, Japan).
This study showed that the indications of antineoplastic agents and psycholeptics were limited in Japan and Europe compared to in the United States, especially among antineoplastic agents from non-Japanese companies or those approved in Japan from 2011 to 2020. In contrast, the numbers of indications and drugs with different indications in Japan and Europe were generally comparable, and no specific imbalance was observed. In Japan, malignancy is the leading cause of death (27.6%), and more than one in four people die of malignant tumors in Japan.25) In the United States and Europe, malignant tumors are the second leading cause of death after cardiovascular disease.26,27) Therefore, patients in Japan and Europe should have the same options (indications) for antineoplastic agents as in the United States.
The larger number of indications per drug among L01 drugs than the other drugs and the large number of L01 drugs included in the anaysis may have contributed to the divergence of L01 drug indications. In this study, the number of indications per drug (median/average) was (1/1.83–1.96) for all drugs, (1–2/1.96–2.37) for L01 drugs, and (1/1.78–1.87) for drugs other than L01. This could be because new indications are likely to be added to L01 drugs after their initial approval. Therefore, some indications may have been approved in the United States but not in Japan or Europe in a drug that could obtain multiple indications. However, there should be no difference in the number of indications according to the region for drugs in which one indication is obtained at initial approval and no indication is added thereafter. Thus, a difference in the number of indications was unlikely to occur in drugs targeting a single disease or those for which new indications were unlikely to be added. Moreover, this study included 73 L01 drugs. This is a larger number of drugs or L01 drugs analyzed than in previous studies6–13) that compared drug indications across specific regions. Thus, differences in drug indications were easily identified in Europe and Japan compared to the United States.
The number of indications of the drugs from non-Japanese companies tended to be smaller in Japan than in the United States, and even though this tendency was not statistically significant, it was more notable among L01 drugs. In this study, 77% (56/73) of L01 drugs were from non-Japanese companies, and 23% (17/73) were from Japanese companies. The number of indications per drug (median/average) for L01 drugs in the United States and Japan was (1.5/2.41) and (1/1.93) for drugs from non-Japanese companies and (2/2.24) and (2/2.06), respectively for drugs from Japanese companies. Therefore, further indications should be added to the drugs from non-Japanese companies to deliver more L01 options (indications) to Japanese patients. Thus, the system that promotes non-Japanese companies to add indications in Japan should be improved.
The number of indications in the drugs approved in Japan from 2011 to 2020 tended to be smaller in Japan than in the United States, and this tendency was greater in L01 drugs although these were not statistically significant. In this study, 21% (15/73) of L01 drugs were approved in Japan from 2001 to 2010, and 79% (58/73) were approved in Japan from 2011 to 2020. The number of indications per drug (median/average) for L01 drugs in the United States and Japan was (2/2.47) and (2/2.33) for those approved in Japan from 2001 to 2010, and (1/2.34) and (1/1.86) for those approved in Japan from 2011 to 2020, respectively. No major differences in the number of indications of the drugs approved in Japan from 2001 to 2010 was observed between Japan and the United States. The number of L01 indications may have differed depending on the approval period because it may take longer to add a new indication in Japan than in the United States. It is possible that the process of adding new indications is in progress for relatively new drugs, while this process is completed in all regions for old drugs. Therefore, if adding new indications requires more time in Japan than in the United States, it is possible that the indications for relatively new L01 drugs were less in Japan than in the United States at the time of this study. Further investigation of the time required for new indications is required.
There were 37 indications which were approved in the United States but not in Japan in 19 L01 drugs (US > JP: 17 and US ≠ JP: 2). They were relatively minor cancers compared to major cancers, such as colorectal cancer, gastric cancer, lung cancer, prostate cancer, and breast cancer in Japan.22) However, the prevalence and mortality of these cancers were generally comparable in the three regions, and therefore, the indications for these cancers should also be available in Japan. In addition, liver cancer ranks fifth in deaths in Japan and higher mortality rate of liver cancer compared to other cancers was seen in the United States and Europe.22–24) Thus, the indication for hepatocellular carcinoma should be important and many efforts have been made to develop various treatment options around the world.28) The indications for hepatocellular carcinoma should be made available expeditiously in Japan.
Of the 37 L01 indications which were approved in the United States but not in Japan, clinical studies in Japanese patients were ongoing or completed for 27 indications in 15 L01 drugs (including the indications for 3 drugs to treat hepatocellular carcinoma), and 5 indications in 5 L01 drugs were also under the approval review as of the end of 2020 based on the public information in Japic Clinical Trials Information,29) Japan Registry of Clinical Trials,30) ClinicalTrials.gov,31) and PMDA’s website.16) The development of many unapproved L01 indications were conducted but still awaiting submission or approval in Japan.
The development requests were submitted from Japanese academic societies to the Evaluation Committee on Unapproved or Off-labeled Drugs with High Medical Needs for 3 of 37 unapproved L01 indications in Japan.32) The number of requests from academic societies for these unapproved indications seems small considering the burden of malignant tumors, but this might have reflected the development statuses of these indications in Japan. Twenty-seven of the 37 unapproved L01 indications were under development or approval review in Japan as of the end of 2020 and this might have resulted in the small number of requests for those unapproved indications. Based on the known development statuses and requests, the unapproved L01 indications are considered important in Japan. As such these indications should be made available in Japan.
It was anticipated that the numbers of indications would be generally comparable between the United States and Europe, because most new drugs or additional indications were supposed to be approved in both regions based on common clinical trial data. However, in this study, it was found that the indications of antineoplastic agents and psycholeptics were limited in Europe compared to in the United States, especially among antineoplastic agents from non-Japanese companies or those approved in Japan from 2011 to 2020. This finding seems to be consistent with the previous study.33) The study reported that there were high concordances of marketing approval decisions between the Food and Drug Administration in the United States and the EMA in Europe; indeed there were also divergences in the area of oncology and hematology.33) It was noted that the submissions to Europe were generally later than those to the Unites States in these drugs, and usually includes additional clinical studies or more substantial data compared to those submitted to the United States. Based on the findings from this previous report33) and our study, it seems that Europe and Japan are in the similar situation, where the development of the same new drugs or the addition of indications are conducted as in the United States, but it takes more time for submissions or approvals to occur.
Only five N05 drugs were included in this study, of which four had fewer indications in Japan than in the United States: aripiprazole (Tourette’s disorder), paliperidone (schizoaffective disorder), asenapine (bipolar I disorder), and brexpiprazole (major depressive disorder). Only lurasidone for schizophrenia and bipolar depression was approved in the United States and Japan with the same indications. Regarding psychiatric drugs, it has been reported that there were more unapproved drugs and the approval timing was late in Japan compared to the United States and the United Kingdom, resulting in a drug-lag for psychiatric drugs in Japan.34) In our study, we observed a gap in indications between the United States and Japan for psychiatric drugs even after their initial approval.
This study has two limitations. First, we did not include all drugs sold in Japan, the Unites States, and Europe. If drugs approved before 2001 had been included in the analysis, different result might have been obtained. However, this study provides a detailed description of drug indications among Japan, the Unites States, and Europe, as we analyzed 298 drugs approved in these regions from 2001 to 2020 across all ATC classifications. Second, in the assessment of indications, we focused on the indicated disease and did not distinguish other differences, such as prevention/treatment/(neo)adjuvant treatment, monotherapy/combination therapy, first line/other lines, severity, or conditions of gene mutation. In the real world, clinical trials or applications for approval may be conducted as a separate indication if intended uses or conditions are different. If these differences are considered, different result might be shown. However, many drugs have different conditions among each region, and if these differences are considered, counting the number of indications or classifying which regions have broader indications becomes difficult. Therefore, we focused on the diseases targeted by each drug and compared those indications based on the quantity. We observed that the number of indications (target diseases) for L01 and N05 drugs was limited in Japan and Europe compared to the United States. Thus, we provided a baseline for considering measures to increase the L01 and N05 options for patients in Japan and Europe.
In conclusion, the indications of antineoplastic agents and psycholeptics were limited in Japan and Europe compared to the United States. Moreover, this trend was more notable among antineoplastic agents from non-Japanese companies or those approved in Japan from 2011 to 2020. The same indications of antineoplastic agents should be available as in the United States because malignant tumors are one of the leading causes of death in Japan and Europe. Thus, measures to promote additional indications in the drugs of non-Japanese companies or drugs approved in Japan from 2011 to 2020 should be considered.
The authors express sincere gratitude to Nanae Uno, Yuki Kobayashi, and Eri Hasegawa for their evaluation of the appropriateness of the assessment of indications and data entry based on the information of drug package inserts.
Toshiyuki Shizuya is an employee of MSD K.K., but the views expressed in this manuscript are those of the authors and do not necessarily reflect the views of MSD K.K. Seiko Miyazaki has no conflict of interest.
This article contains supplementary materials.