Abstract
Pentazocine (PTZ) is a widely used drug for postoperative pain. It should be administered at appropriate dosing intervals not only because of its morphine-like side effects but also because frequent inappropriate dosing can lead to dependence. Although perioperative patients reportedly have nonnegligible effects on placebo drugs and postoperative wound healing, no pharmacokinetic (PK)/pharmacodynamic (PD) model has been established and simulated using real-world data for the perioperative period. This study aimed to perform PTZ modeling and simulation and to establish an indicator of the timing of drug efficacy evaluation in clinical practice. Participants were in-hospital orthopedic surgery patients who received 15 mg of PTZ within 48 h postoperatively. Pain severity was assessed using the numerical rating scale (NRS). A two-compartment model was selected for the population PK model and an indirect response model for the PK/PD model. Using these models, a virtual population of 1000 patients with Painbase NRS of 5 and 6 and body weights of 40, 80, and 120 kg were treated with single and multiple PTZ administrations (4, 8, and 24 h apart) of 15 mg. Simulation results indicate that its analgesic efficacy should be evaluated within 1 h after administration of 15 mg of PTZ. Additional doses should be considered every 8–12 h in postoperative patients with Painbase NRS of 5 weighing 40–80 kg. Simulation using the PK/PD model developed in this study may provide useful information for determining the analgesic effects and timing of the dosing interval after PTZ administration in perioperative patients.
INTRODUCTION
Since pain has an impact on the patient’s QOL, it should be properly assessed and managed by medical professionals to eliminate its adverse physical and psychological effects. Inadequate control of acute postoperative pain not only leads to the transition to chronic pain but also to prolonged hospitalization.1–3) Furthermore, immobility due to fear of pain affects rehabilitation and can cause deep vein thrombosis4) and bedsores5); therefore, postoperative pain control is extremely important.
Pentazocine (PTZ) is widely used for pain control in Japan, acts on central μ- and κ-opioid receptors,6,7) and produces analgesic effects by inhibiting the stimulus conduction system.8,9) As a result, morphine-like side effects, such as nausea, dizziness, headache, insomnia, increased blood pressure, and decreased respiratory rate,10–12) are observed. Moreover, fatal PTZ overdose and abuse have been reported, and some studies revealed that the entry point for people who fall into inappropriate self-injection is medical in origin.13,14) In this background, the analgesic effects of PTZ should still be predicted to minimize patient pain and to administer it at appropriate dosing intervals with minimal side effects.
Pharmacokinetic (PK)/pharmacodynamic (PD) modeling and simulation can be used to provide personalized medicine based on the characteristics and specific needs (disease, age, body size, and organ function) of individual patients.15) In recent years, various PK/PD models of analgesics have been reported16–19); however, most evidence has been obtained from the clinical trial results. In addition to the fact that patients treated in real-world settings are more heterogeneous and diverse than participants in clinical trials who meet the strict inclusion criteria, the invasiveness factor for the patients and the workload of medical staff should be considered due to the availability of plasma concentration measurement facilities and frequent blood sampling. However, drugs administered in a real-world setting may capture characteristics that affect PK or PD in patients, and there is an abundance of real-world data based on medical information databases, such as the numerical rating scale (NRS).
As a background to the difficulty in predicting pain control during the perioperative period, the influence of postoperative wound healing and the placebo effects of drugs cannot be ignored. To properly manage pain in perioperative patients, a PK/PD model should be developed that represents temporal drug efficacy changes in perioperative patients. To the best of our knowledge, no PK/PD model has been established and simulated using real-world data after PTZ administration in perioperative patients. This study aimed to provide useful information for determining the analgesic effect and timing of dosing intervals after PTZ administration in perioperative patients by simulation using the developed PK/PD model.
MATERIALS AND METHODS
Data SourcesPopulation Pharmacokinetic ModelingPlasma concentrations in the population pharmacokinetic (PPK) model analysis of PTZ were retrieved from the data of Takahashi et al.20) and Arakawa et al.21) Takahashi et al. reported data from 12 adult patients (age: 43.8 ± 12.5 years, weight: 58.7 ± 9.7 kg) treated with a single intravenous and intraoperative PTZ dose of 1 mg/kg and 11 adult patients (age: 40.8 ± 16.9 years, weight: 52.4 ± 7.3 kg) treated with a single intraoperative PTZ dose of 1 mg/kg and famotidine. Plasma samples were collected at 5, 30, 90, 150, and 210 min following PTZ administration and analyzed using gas chromatography. Arakawa et al. reported data from 10 adult patients (age: 38.8 ± 14.5 years) who received a single dose of PTZ of 0.5 mg/kg intravenously postoperatively. A total of 10 patients were administered 0.5 mg/kg intravenously, and plasma samples were collected at 1, 2, 3, 5, 10, 15, 20, 30, 45, and 60 min.
Pharmacokinetic/Pharmacodynamic ModelingThis study has been approved by the clinical ethical review board of St. Luke’s International Hospital (Research No. 14-R143) and Nihon University (19-005-1). The study design was a retrospective cohort, and patients with previous disagreement were excluded. Hospitalized patients who underwent orthopedic surgery between January 1, 2015, and March 31, 2018, were recruited and administered with PTZ within 48 h postoperatively. PTZ 15 mg was administered intravenously over 15 min and evaluated via NRS as a biomarker for analgesic efficacy. Biochemical and hematological data, such as liver function, renal function, and blood count, were measured preoperatively. Exclusion criteria are patients (1) with PTZ hypersensitivity and a history of side effects; (2) with known severe hepatic/renal dysfunction and consciousness disorder; (3) who concomitantly used other analgesics; (4) whose NRS was evaluated within a shorter time (within a few minutes) than at the end time of PTZ administration; (5) with unknown surgical procedure; and (6) who reported no effects after PTZ administration and switched to other drugs.
The degree of postoperative pain was assessed using a general unidimensional questionnaire, the NRS (0–10), in which the patient rates pain using a single 11-point scale (0: no pain, 10: worst pain ever felt). The NRS score was obtained by the ward nursing staff through interviews.
Population Pharmacokinetic ModelingPopulation analysis was performed using NONMEM version 7.4.3, PsN, Wings for NONMEM (http://wfn.sourceofrge.net/), and R 4.1.2. The two- and three-compartment models were tested as PTZ PK models describing the plasma PTZ concentration profile. In these analyses, interindividual variability of PK parameters were modeled using an exponential error model, and intra-individual variability was modeled using a proportional error model. A first-order conditional estimation method with interactions was used for all estimates. We assumed no difference between the intraoperative and postoperative PTZ PKs.
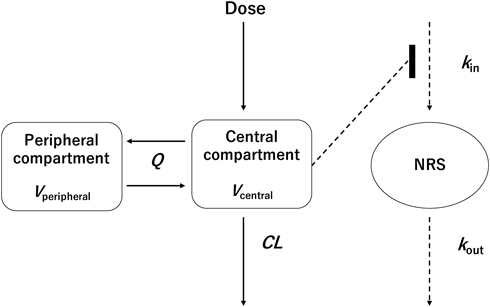
Pharmacokinetic/Pharmacodynamic ModelingThe population PD model was established using a sequential approach, whereas the population PK model was the two-compartment model selected for population PK modeling. Population PD parameters were estimated using observed NRS, in which population PK parameters were fixed at the estimated value in population PK modeling. In all patient data in this study, PTZ was administered at a dose of 15 mg for single or multiple administrations. NRS was considered continuous data for modeling purposes. To explain the NRS-time course of the patients, an indirect response model, including the time-dependent effect and PTZ effect, was selected based on Fossler et al.’s report.22) Pain score changes with time in the indirect response model were defined as follows:
 | (1) |
 | (2) |
where kin and kout are rate constants describing the increase and decrease in pain scores, respectively, without modulatory effects of either time (t) or Cp; PTmax is the maximum effect of time; PT50 is the time until the time effect is halved; γtime is the shape parameter of the time effect; Emax is the maximum PTZ effect; EC50 is the PTZ plasma concentration at which the PTZ effect on pain scores is halved; Emax is the maximum PTZ effect; and EC50 is the plasma PTZ concentration at which the PTZ effect on pain score is halved. Baseline pain (Painbase) was fixed for each surgical procedure based on Gerbershagen’s report (260 patients with Painbase NRS5, 158 patients with Painbase NRS6, and 20 patients with Painbase NRS7), and was estimated for surgical procedures without applying Gerbershagen’s report (82 patients).23) Interindividual variability of Painbase was modeled by (3), (4):
 | (3) |
 | (4) |
Painbase is represented by kin/kout. Since only two of these parameters can be independently estimated, the model is parameterized with Painbase and kout, and kin is assigned the value Painbase × kout. The interindividual variability of EC50 was modeled using an exponential error model.
The PD model was fitted using the $PRIOR NWPRI subroutine in NONMEM to stabilize estimation and help converge the model. The prior values were selected from the PK/PD model that reported time-dependent pain relief effects on postoperative pain and were tested both on structural parameters (θ) for time-dependent pain relief effect parameters (PTmax, PT50, and γtime), and on intrapatient variability parameters (σ). Incorporating a prior value on a θ required the variance of that prior parameter estimate to reflect uncertainty about the prior. For priors on σ’s, the degree of freedom for σ is calculated using the following formula: df = 2 × [σ2/(standard error (S.E.) of σ2)]2 + 1.24)
Covariate ModelingIn the population PD modeling, age, albumin (ALB), aspartate aminotransferase (AST), alanine aminotransferase (ALT), total bilirubin (T-Bil), serum creatinine (Scr), and creatine clearance (CLcr) were considered as continuous covariates in the model. C-reactive protein (CRP) level is reported to be positively correlated with total knee arthroplasty25); therefore, it was also evaluated.
Continuous covariates were centered on the median of the population, and the power model was used to determine whether they should be included. Missing data of continuous covariates were compensated using the median value:
 | (5) |
where θ is the scale factor of the covariate and represents the magnitude of the relationship between the covariate and parameter. Sex and age, with a cutoff value of 65 years, were used as categorical data. Categorical covariates were modeled as follows:
 | (6) |
where n is the indicator variable (0/1). Covariates were selected using the forward- and backward-step methods. After adding covariates at 1% significance level, those that were nonsignificant at 1% significance level were removed from the full model to form the final model.
Model EvaluationThe final population PK and PK/PD models were selected using goodness-of-fit plot, parameter estimates, S.E. of parameter estimates, and objective function value (OFV). Uncertainty in parameter estimates was assessed using bootstrap method, and resampling was performed 500 times. The population PK model was evaluated using the prediction-corrected visual predictive check (pc-VPC), and the PK/PD model was evaluated using the VPC, which was generated by simulating 1000 study replicates from the final models. The pc-VPC and VPC were performed in NONMEM via Wings for NONMEM and the tidyvpc package in R.26) The VPC was assessed at 48 h because < 1% of the NRS obtained for analysis was available after 48 h of treatment.
SimulationUsing the population PK/PD parameter estimates of the obtained model, the analgesic effects were simulated in 1000 virtual patients with postoperative values: Painbase, NRS5 and NRS6; body weight, 40, 80, and 120 kg; and PTZ 15 mg as a single dose and multiple administrations (4-, 8-, and 24-h intervals). Since most of the patients were classified as NRS 5 (260/520 patients) and 6 (158/520 patients) based on Gerbershagen’s report, we simulated the analgesic effect at Painbase NRS 5 and 6. Since Kapstad et al. reported a cut point of 4 for mild-to-moderate pain in patients with hip or knee osteoarthritis,27) we set the summary parameter for good pain control as NRS of < 3.5. For the single dose, the percentage of virtual postoperative patients who achieved NRS of < 3.5 out of 1000 was calculated. For multiple administrations, the number of virtual postoperative patients who were controlled to NRS of < 3.5 for at least 38.4 h, 80% of the 48 h postoperatively was calculated. The R version 4.1.2 (the R foundation for statistical Computing) was used to create graphs.
RESULTS
Target DataA total of 520 patients received postorthopedic PTZ, and a total of 997 data points were collected as NRS for analysis. Figure 1 shows plasma PTZ concentration- and NRS-time profiles, and Table 1 shows the demographic data of the patients. CLcr was calculated using the cockcroft formula by rounding up Scr of < 0.6.
Table 1. Patient Characteristics
| Characteristic | No. | Median | IQR | Range |
|---|
| 25% | 75% | Minimum | Maximum |
|---|
| No. of patients (male/female) | 279/241 | | | | | |
| NRS | 997 | | | | | |
| Age (years) | | 54 | 35 | 71 | 8 | 98 |
| Height (cm) | | 164 | 157 | 170 | 97.4 | 194 |
| Body weight (kg) | | 64.2 | 54.5 | 74.8 | 14 | 132 |
| ALB (g/dL) | | 4.2 | 4.2 | 4.3 | 2 | 5.2 |
| AST (IU/L) | | 22 | 19 | 26 | 9 | 148 |
| ALT (IU/L) | | 19 | 15 | 27 | 5 | 256 |
| T-Bil (mg/dL) | | 0.6 | 0.5 | 0.7 | 0.2 | 2 |
| Scr (mg/dL) | | 0.72 | 0.6 | 0.84 | 0.11 | 13.8 |
| CLcr (mL/min) | | 97.5 | 68.4 | 129.0 | 5.5 | 271.2 |
| Hb (g/dL) | | 13.6 | 12.5 | 14.8 | 6.6 | 18.6 |
| PLT(×1000/µL) | | 237 | 203.3 | 276.8 | 107 | 842 |
| APTT (seconds) | | 28 | 26.3 | 30.1 | 21.4 | 72.9 |
| WBC (×1000/µL) | | 6.6 | 5.6 | 7.8 | 2.9 | 18.8 |
| CRP (mg/dL) | | 0.1 | 0.04 | 0.42 | 0 | 15.2 |
Abbreviations: ALB, albumin; AST, aspartate aminotransferase, ALT, alanine aminotransferase; T-Bil, total bilirubin; Scr, serum creatinine; CLcr, creatine clearance; Hb, hemoglobin; PLT, platelet count; APTT, activated partial thromboplastin time; WBC, white blood cell count; CRP, C-reactive protein.
The two- and three-compartment models were tested as PTZ PK models describing the systemic circulation. Three-compartment models were used with reduced interindividual variability parameters and models that considered all interindividual variability. However, the lower limit of confidence interval (CI) in the interindividual variability parameter of the peripheral compartment was nearly 0 (data not shown). The two-compartment model, which considered all interindividual variability parameters and correlations between all parameters, had the same OFV as the three-compartment model; thus, the two-compartment model was selected as the PPK model.
The final PPK parameter estimates and bootstrap results are shown in Table 2, indicating an acceptable parameter uncertainty. The pc-VPC is shown in Fig. 2, indicating that percentile intervals describing the prediction-corrected observations were mostly within the 95% CI of the percentile intervals of simulated concentrations. No significant covariates were also found.
Table 2. Parameter Estimates of the PK Model
| Parameter | Original dataset | Range | Bootstrap result (n = 500) |
|---|
| Estimates | S.E. | Lower | Upper | Median | Lower 2.5% | Upper 97.5% |
|---|
| (Estimate −1.96× S.E.) | (Estimate +1.96× S.E.) |
|---|
| Vc (L/kg) | 1.04 | 0.237 | 0.58 | 1.5 | 1.03 | 0.639 | 1.56 |
| CL (L/h/kg) | 1.19 | 0.171 | 0.85 | 1.53 | 1.23 | 0.854 | 1.68 |
| Q(L/h/kg) | 3.44 | 0.332 | 2.79 | 4.09 | 3.48 | 2.79 | 4.29 |
| Vp (L/kg) | 3.02 | 0.524 | 1.99 | 4.05 | 2.90 | 1.89 | 4.15 |
| ω2Vc | 1.76 | 0.430 | 0.92 | 2.6 | 1.72 | 0.93 | 2.49 |
| ω2CL | 0.339 | 0.125 | 0.09 | 0.58 | 0.33 | 0.08 | 0.65 |
| ω2Q | 0.220 | 0.0618 | 0.1 | 0.34 | 0.20 | 0.07 | 0.40 |
| ω2Vp | 0.789 | 0.215 | 0.37 | 1.21 | 0.79 | 0.32 | 1.24 |
| ωVc-CL | −0.478 | 0.119 | −0.71 | −0.24 | −0.60 | −0.833 | −0.11 |
| ωCL-Q | 0.0374 | 0.0664 | −0.09 | 0.17 | 0.15 | −0.784 | 0.71 |
| ωQ-Vc | 0.271 | 0.133 | 0.01 | 0.53 | 0.42 | 0.006 | 0.96 |
| ωQ-Vp | 0.164 | 0.104 | 0.19 | 0.6 | 0.39 | −0.21 | 0.89 |
| ωCL-Vp | −0.295 | 0.102 | −0.49 | −0.10 | −0.59 | −0.807 | −0.25 |
| ωVc-Vp | 1.15 | 0.301 | 0.56 | 1.74 | 0.96 | 0.236 | 1.00 |
| σ | 0.158 | 0.0162 | 0.13 | 0.19 | 0.16 | 0.129 | 0.19 |
Abbreviations: S.E., standard error, Vc, volume of central compartment; CL, clearance; Q, intercompartmental clearance between central compartment and peripheral compartment; Vp, volumes of distributional peripheral compartments; ω2Vc, interindividual variability of Vc; ω2CL, interindividual variability of CL; ω2Q, interindividual variability of Q; ω2Vp, interindividual variability of Vp; ωVc-CL, covariance between interindividual variability of Vc and CL; ωCL-Q, covariance between interindividual variability of CL and Q; ωQ-Vc, covariance between interindividual variability of Q and Vc; ωQ-Vp, covariance between interindividual variability of Q and Vp; ωCL-Vp, covariance between interindividual variability of CL and Vp; ωVc-Vp, covariance between interindividual variability of Vc and Vp; σ, intra-individual variability.
The final PK/PD model is shown in Fig. 3. The PK/PD parameter estimates, S.E., bootstrap results are shown in Table 3. Bootstrapping CIs were confirmed based on the range close to the observed values. The VPC is shown in Fig. 4. In the VPC, each percentile describing the observations was mostly within the 95% CI of each percentile in simulated concentrations. The goodness-of-fit plots for PPK and PK/PD models are presented in Supplementary Figs. S1 and S2. Reasonable agreement was shown between the observed and predicted values for the PTZ effects. The VPC of the final model showed good simulation properties.
Table 3. Parameter Estimates of the PK/PD Model
| Parameter | Original dataset | Bootstrap result (n = 500) |
|---|
| Estimates | S.E. | Lower | Upper | Median | Lower 2.5% | Upper 97.5% |
|---|
| (Estimate −1.96 × S.E.) | (Estimate +1.96 × S.E.) |
|---|
| Painbase (× 10 Pain scale) | 0.397 | 0.0485 | 0.30 | 0.49 | 0.390 | 0.319 | 0.461 |
| PT50 (h) | 17.1 | 0.204 | 16.7 | 17.5 | 17.1 | 17.0 | 17.9 |
| PTmax | 0.567 | 0.00266 | 0.56 | 0.57 | 0.55 | 0.396 | 0.70 |
| γtime | 0.373 | 0.129 | 0.12 | 0.63 | 0.38 | 0.0044 | 1.84 |
| EC50 (ng/mL) | 144 | 16.5 | 111.7 | 176.3 | 143 | 48.4 | 1747 |
| Emax | 1 fixed | — | — | — | — | — | — |
| kout (/h) | 2.82 | 0.268 | 2.29 | 3.35 | 2.75 | 0.961 | 10.70 |
| ω2 Painbase | 1.32 | 0.0089 | 1.30 | 1.34 | 1.3 | 1.02 | 1.69 |
| ω2EC50 | 4.03 | 0.0816 | 3.87 | 4.19 | 4.23 | 2.12 | 10.5 |
| σ | 1.78 | 0.0404 | 1.70 | 1.86 | 1.78 | 1.67 | 1.89 |
Abbreviations: Painbase, baseline pain score; PT50, time to half-maximal effect; PTmax, maximum effect of time; γtime, shape parameter for time effect; EC50, PTZ concentration associated with the half-maximal effect, Emax, maximum effect of PTZ; kout, first-order rate constant for decrease in pain; ω2 Painbase, interindividual variability of Painbase; ω2EC50, interindividual variability of EC50; σ, intra-individual variability.
Results of a single-dose 15-mg PTZ administered to 1000 virtual postoperative patients with Painbase NRS of 5 and 6 and body weight of 40, 80, and 120 kg are shown in Figs. 5 and 6. As a result, administration of Painbase NRS 5 and 6 to virtual patients weighing 80 kg at an 8-h interval showed that the proportions controlled by NRS of < 3.5 for ≥38.4 h were 55.1% and 40.0%, respectively. The number of patients with NRS of < 3.5 for > 38.4 h of the 48-h postoperative period after the multiple administrations at 4-, 8-, and 24-h intervals is shown in Table 4.
Table 4. Number of Patients with NRS of < 3.5 for > 38.4 h of the 48-h Postoperative Period in 1000 Virtual Postoperative Patients
| Body weight (kg) | Dosing interval |
|---|
| 4 h | 8 h | 12 h |
|---|
| Painbase: NRS 5 | Painbase: NRS 6 | Painbase: NRS 5 | Painbase: NRS 6 | Painbase: NRS 5 | Painbase: NRS 6 |
|---|
| 40 | 655 | 536 | 574 | 435 | 538 | 395 |
| 80 | 618 | 485 | 551 | 400 | 514 | 374 |
| 120 | 584 | 459 | 532 | 388 | 500 | 364 |
PTZ dose: 15 mg. Abbreviations: NRS, numerical rating scale; Painbase, baseline pain score.
DISCUSSION
Pain affects the patient’s QOL, and since uncontrolled acute postoperative pain has been reported to result in prolonged hospitalization and chronic pain, healthcare providers should evaluate the effects of analgesics at appropriate times and consider dosing intervals. Immediately following surgery, intravenous administration is often the preferred route for analgesics due to the risk of aspiration. First, acetaminophen or flurbiprofen is administered intravenously, followed by PTZ or tramadol if the effect is inadequate. Opioids are administered in cased where even PTZ and tramadol do not work. On April 20, 2017, the U.S. Food and Drug Administration (FDA) recommended that tramadol should not be used for children under the age of 12 years or breastfeeding women due to the risk of severe respiratory compromise from the metabolites of the CYP ultra-rapid metabolizer.28) However, PTZ metabolites reportedly contribute little to analgesia,29) and hence, can be used for children. Therefore, it is important to choose PTZ after taking precautions caution for psychological and physical dependence.
Clinical trials evaluate the drug efficacy in a patient population by comparing the disease status at the start of treatment and at one or more time points during or after treatment. In traditional PK/PD analysis of clinical trials, the model parameter values in the absence of drug are invariant over time, and physiology is considered constant at baseline. Conversely, in perioperative patients, this is not a realistic explanation because the pathology changes over time postoperatively. Si et al. reported that pain at rest and walking pain from postoperative days 1 to 5 in the total knee arthroplasty improved over time.25)
Therefore, a model that considers the improvement of pathophysiology should be created to depict drug effect transition. In this study, plasma concentration data for perioperative patients20,21) were used to construct a PTZ PK model, real-world data after orthopedic surgery at our hospital were used to construct a PD model, and an indirect response model, including placebo effects, was selected to explain the NRS-time course based on Fossler et al.’s report to represent the drug effect transition in PTZ,22) including over time changes in pain improvement postoperatively. The data sources for the PPK model were references wherein blood samples were collected intraoperatively and postoperatively. These references have different time of sampling and produce confounding effects on the PK parameter estimations. Therefore, we assumed no difference in the PTZ PKs between the intraoperative and postoperative periods and developed a PPK model. The obtained PPK parameters were within the range of the previously reported values,12,30,31) which we considered valid for the simulations of 40–80 kg body weight. In addition, Ritschel et al. calculated the distribution and clearance volume for a patient weighing 95.5 kg,30) which was the same as the previously reported PK data and our PPK data. Since the PPD data source in our study incorporated and analyzed up to 132 kg, we performed the simulation up to 120 kg as extrapolation was deemed possible. However, since the number of people who were over 100 kg was approximately 2.5% of the total population, which represented a small amount of data, estimation for obese patients needs to be considered in future studies.
We externally evaluated our model by comparing the simulation results with those of previous studies.32–35) Farrar et al. reported that a two-point or a 30% reduction in NRS represented a clinically important difference.36) Furthermore, the drug effect in humans begins to occur within 30 min after PTZ administration and lasts for 2–6 h.32–35) The drug effect was observed immediately after administering PTZ alone, with a maximum effect at approximately 1 h, followed by a loss of drug effects at 4–6 h (Figs. 5, 6), which was similar to the previously reported results. This study included 144 analgesic data obtained within 1 h after administration. The analgesic effect at 1 h postdose is considered to include the analgesic PTZ effect, analgesic effect of healing, and analgesic effect of the placebo effect. We estimated the analgesic effect of healing and the placebo effect using the previously reported PK/PD model information that included the time-dependent effect.22) The VPC at 1 h postdose is considered acceptable for Painbase = 5 and 6 cases. These results suggest the timing of drug efficacy assessment after a single dose of PTZ in clinical practice.
In postoperative Painbase NRS of 5, approximately 50% of patients weighing 40–80 kg were generally controlled to NRS of < 3.5 when PTZ 15 mg was administered every 8–12 h. The postoperative Painbase NRS of 6, frequent dosing at 4-h intervals may control NRS at < 3.5 in patients weighing 40 kg, but dosing intervals longer than 4 h and patients weighing 80–120 kg suggest that NRS control with PTZ alone may be difficult. Simulation results using this model indicate that analgesic efficacy should be evaluated within 1 h after administering 15 mg of PTZ. Additional doses should be considered every 8–12 h for 40–80 kg body weight for postoperative Painbase NRS of 5, and multimodal analgesia should be considered for any body weight for postoperative Painbase NRS of > 6.
In studies of perioperative patients, age, sex and creatinine clearance37,38) are known to affect PK parameters. PTZ is excreted in the urine partly in its unchanged form, but mostly it is metabolized in the liver by CYP metabolism and glucuronide conjugation reactions. Furthermore, PTZ clearance reportedly decreases in patients with cirrhosis.39–41) The glucuronide conjugates of morphine and the metabolites of buprenorphine are known to exhibit analgesic effects, although the PTZ metabolites contribute little to analgesia. Following the PK model building, we performed sequential analysis wherein PD model building was performed on patients other than those involved in PK model building. Since we detected PK covariates as PD parameter covariates,42) ALB, AST, ALT, T-Bil, and CLcr were considered as covariates of PD parameters. However, none of the covariates significantly improved the model. Pisanu et al. found no sex differences in the response to opioids 30 min after administration for acute pain.43) Fillingim et al. also reported no sex difference in the analgesic effects of PTZ.44) Abou et al. considered age, sex, and body weight in creating a morphine K-PD model, but did not find any covariates that significantly improved the model.45) The range of laboratory values in patients analyzed in the PK/PD model was too narrow to have any effects as covariates. Individual differences have been observed in opioid receptor sensitivity46) and genetic polymorphisms have been associated with opioid use.47) Therefore, this information should be incorporated to validate our model.
Respiratory depression is a reported PTZ side effect, and a transient increase in carbon dioxide concentration was reported in children receiving a dose of 0.5 mg/kg.12) Sadove et al. observed reduced respiratory rate and increased tidal volume in adults treated with 30 mg PTZ.30) The lower respiratory rate limit in this report was within the clinically normal range, which might be because the shallow tachypnea of the patient before PTZ administration was due to pain, and after the pain was relieved, the breathing of the patient returned to normal. This was the result of a single dose and that for multiple administration remains to be elucidated. Hence, it is necessary to consider a model that incorporates respiratory rate, oxygen saturation, and carbon dioxide concentration to account for adverse effects, such as respiratory depression. Pain is also known to display circadian rhythms and the physiological functions of the endogenous opioid system have been reported to be regulated by circadian rhythms.48,49) Therefore, it is necessary to incorporate circadian rhythms in the simulation. By incorporating the postoperative time, this model was able to represent the postoperative pain transition in patients who underwent orthopedic operation in the absence of PTZ. This placebo effect might be applied to other analgesics to accurately evaluate their efficacy. However, since PTZ analgesic effects are known to have a ceiling effect, caution should be taken when applying this model to other opioids.
This study has some potential limitations. As the model’s effect estimates were based on a single-center, retrospective study, bias and unknown confounding factors could not be avoided. First, the PTZ analgesic effect included a placebo effect; the NRS has a subjective and emotional pain component, and the possibility of overestimating the PTZ effect cannot be ruled out. A study comparing the placebo effect was not conducted due to ethical reasons. The visual analog scale (VAS) has been widely reported as a pain assessment scale; however, as it is more complicated with a higher error rate in the elderly and cognitively impaired patients,50) we used the NRS for pain assessment in this study. Although NRS positively correlated with VAS,51) the placebo effect was difficult to distinguish. Second, there was the possibility of bias at the medical staff’s end. In this hospital, patient satisfaction surveys are periodically conducted to evaluate over time changes, including in-hospital education, to improve awareness of postoperative acute pain and in-hospital analgesia guidelines to improve quality. Therefore, changes in awareness may be included in the results of the measured data as bias. Third is the predictive accuracy of the EC50. The adult dosage of PTZ for postoperative analgesia in Japan is 15 mg. Since this is a single dose regardless of body weight, the EC50 may contain errors. Furthermore, since most of the NRSs obtained were within 48 h postoperatively, the prediction accuracy decreases after 48 h. Moreover, patients who did not respond at all after several hours of PTZ administration were excluded from data analysis during the data cleaning process because of ethical considerations regarding the concomitant use of other drugs or switching. This may have been a factor in the small number of postoperative NRS ≥7 patients, and may have affected the prediction accuracy.
In conclusion, the simulation using the PK/PD model developed in this study may provide useful information for determining the analgesic effects and timing of the dosing interval after PTZ administration in perioperative patients.
Conflict of Interest
The authors declare no conflict of interest.
Supplementary Materials
This article contains supplementary materials.
REFERENCES
- 1) Kehlet H, Jensen TS, Woolf CJ. Persistent postsurgical pain: risk factors and prevention. Lancet, 367, 1618–1625 (2006).
- 2) Hansen RN, Pham A, Strassels SA, Balaban S, Wan GJ. Comparative analysis of length of stay and inpatient costs for orthopedic surgery patients treated with iv acetaminophen and opioids vs. iv opioids alone for post-operative pain. Adv. Ther., 33, 1635–1645 (2016).
- 3) Wu CL, Raja SN. Treatment of acute postoperative pain. Lancet, 377, 2215–2225 (2011).
- 4) Rodgers A, Walker N, Schug S, McKee A, Kehlet H, van Zundert A, Sage D, Futter M, Saville G, Clark T, MacMahon S. Reduction of postoperative mortality and morbidity with epidural or spinal anaesthesia: results from overview of randomised trials. BMJ, 321, 1493 (2000).
- 5) Ballantyne JC, Carr DB, deFerranti S, Suarez T, Lau J, Chalmers TC, Angelillo IF, Mosteller F. The comparative effects of postoperative analgesic therapies on pulmonary outcome: cumulative meta-analyses of randomized, controlled trials. Anesth. Analg., 86, 598–612 (1998).
- 6) Tyers MB. A classification of opiate receptors that mediate antinociception in animals. Br. J. Pharmacol., 69, 503–512 (1980).
- 7) Shu H, Hayashida M, Arita H, Huang W, Zhang H, An K, Wu G, Hanaoka K. Pentazocine-induced antinociception is mediated mainly by μ-opioid receptors and compromised by κ-opioid receptors in mice. J. Pharmacol. Exp. Ther., 338, 579–587 (2011).
- 8) Hoskin PJ, Hanks GW. Opioid agonist-antagonist drugs in acute and chronic pain states. Drugs, 41, 326–344 (1991).
- 9) Gilbert PE, Martin WR. The effects of morphine and nalorphine-like drugs in the nondependent, morphine-dependent and cyclazocine-dependent chronic spinal dog. J. Pharmacol. Exp. Ther., 198, 66–82 (1976).
- 10) Goldstein G. Pentazocine. Drug Alcohol Depend., 14, 313–323 (1985).
- 11) Pandèle G, Nivoche Y, Marty J, Desmonts JM. Comparison of nalbuphine and pentazocine in the treatment of postoperative pain by self-administration. Ann. Fr. Anesth. Reanim., 8, 85–89 (1989).
- 12) Hamunen K, Olkkola KT, Seppäiä T, Maunuksela EL. Pharmacokinetics and pharmacodynamics of pentazocine in children. Pharmacol. Toxicol., 73, 120–123 (1993).
- 13) Challoner KR, McCarron MM, Newton EJ. Pentazocine (Talwin) intoxication: report of 57 cases. J. Emerg. Med., 8, 67–74 (1990).
- 14) Ambekar A, Rao R, Mishra AK, Agrawal A. Type of opioids injected: does it matter? A multicentric cross-sectional study of people who inject drugs. Drug Alcohol Rev., 34, 97–104 (2015).
- 15) Darwich AS, Ogungbenro K, Vinks AA, et al. Why has model-informed precision dosing not yet become common clinical reality? lessons from the past and a roadmap for the future. Clin. Pharmacol. Ther., 101, 646–656 (2017).
- 16) Shinoda S, Aoyama T, Aoyama Y, Tomioka S, Matsumoto Y, Ohe Y. Pharmacokinetics/pharmacodynamics of acetaminophen analgesia in Japanese patients with chronic pain. Biol. Pharm. Bull., 30, 157–161 (2007).
- 17) Anderson BJ, Holford NH, Woollard GA, Kanagasundaram S, Mahadevan M. Perioperative pharmacodynamics of acetaminophen analgesia in children. Anesthesiology, 90, 411–421 (1999).
- 18) Imaizumi T, Obara S, Mogami M, Iseki Y, Hasegawa M, Murakawa M. Population pharmacokinetics of intravenous acetaminophen in Japanese patients undergoing elective surgery. J. Anesth., 31, 380–388 (2017).
- 19) Yassen A, Olofsen E, Dahan A, Danhof M. Pharmacokinetic-pharmacodynamic modeling of the antinociceptive effect of buprenorphine and fentanyl in rats: role of receptor equilibration kinetics. J. Pharmacol. Exp. Ther., 313, 1136–1149 (2005).
- 20) Takahashi S, Kudo T, Kudo M, Matsuki A, Oyama T, Lee JH. Effects of famotidine on plasma pentazocine concentration in surgical patients. Masui, 37, 701–706 (1988).
- 21) Arakawa Y, Tanaka H, Otani S, Gotoh Y. The pharmacokinetics of pentazocine in postoperative patients. Masui, 30, 356–361 (1981).
- 22) Fossler MJ, Sadler BM, Farrell C, Burt DA, Pitsiu M, Skobieranda F, Soergel DG. Oliceridine (TRV130), a novel G protein-biased ligand at the μ-opioid receptor, demonstrates a predictable relationship between plasma concentrations and pain relief. I: Development of a pharmacokinetic/pharmacodynamic model. J. Clin. Pharmacol., 58, 750–761 (2018).
- 23) Gerbershagen HJ, Aduckathil S, van Wijck AJ, Peelen LM, Kalkman CJ, Meissner W. Pain intensity on the first day after surgery: a prospective cohort study comparing 179 surgical procedures. Anesthesiology, 118, 934–944 (2013).
- 24) Chan Kwong AHP, Calvier EAM, Fabre D, Gattacceca F, Khier S. Prior information for population pharmacokinetic and pharmacokinetic/pharmacodynamic analysis: overview and guidance with a focus on the NONMEM PRIOR subroutine. J. Pharmacokinet. Pharmacodyn., 47, 431–446 (2020).
- 25) Si HB, Yang TM, Zeng Y, Zhou ZK, Pei FX, Lu YR, Cheng JQ, Shen B. Correlations between inflammatory cytokines, muscle damage markers and acute postoperative pain following primary total knee arthroplasty. BMC Musculoskelet. Disord., 18, 265 (2017).
- 26) Aoyama T, Hirai T, Tsuji Y, Miyamoto A, Itoh T, Iwamoto T, Matsumoto Y. External evaluation of a bayesian warfarin dose optimization based on a kinetic-pharmacodynamic model. Biol. Pharm. Bull., 45, 136–142 (2022).
- 27) Kapstad H, Hanestad BR, Langeland N, Rustøen T, Stavem K. Cutpoints for mild, moderate and severe pain in patients with osteoarthritis of the hip or knee ready for joint replacement surgery. BMC Musculoskelet. Disord., 9, 55 (2008).
- 28) FDA Drug Safety Communication. “FDA restricts use of prescription codeine pain and cough medicines and tramadol pain medicines in children; recommends against use in breastfeeding women”: ‹https://www.fda.gov/drugs/drug-safety-and-availability/fda-drug-safety-communication-fda-restricts-use-prescription-codeine-pain-and-cough-medicines-and›, accessed 7 July, 2022.
- 29) Berkowitz B. Influence of plasma levels and metabolism on pharmacological activity: pentazocine. Ann. N. Y. Acad. Sci., 179 (1 Drug Metaboli), 269–281 (1971).
- 30) Ritschel WA, Hoffmann KA, Willig JL, Frederick KA, Wetzelsberger N. The effect of age on the pharmacokinetics of pentazocine. Methods Find. Exp. Clin. Pharmacol., 8, 497–503 (1986).
- 31) Agurell S, Boréus LO, Gordon E, Lindgren JE, Ehrnebo M, Lönroth U. Plasma and cerebrospinal fluid concentrations of pentazocine in patients: assay by mass fragmentography. J. Pharm. Pharmacol., 26, 1–8 (1974).
- 32) Sadove M, Balagot RC, Pecora FN. Pentazocine—a new nonaddicting analgesic. Preliminary single-blind study. JAMA, 189, 199–202 (1964).
- 33) Piepenbrock S, Zenz M, Gorus R, Link J, Reinhart K. Buprenorphine and pentazocine for postoperative analgesia. A double blind study following abdominal surgery. Anaesthesist, 32, 601–609 (1983).
- 34) Momose T, Ito K, Enomoto N, Yogozawa T, Yamada M, Kuge T, Tachibana N, Yamamura H. Double-blind comparison of butorphanol and pentazocine in the treatment of post-surgical pain. Masui, 31, 736–747 (1982).
- 35) Neeraj YS, Gupta A. Efficiency of pentazocine for post-operative analgesia: a comparative prospective study. Int. J. Sci., 4, 20–26 (2016).
- 36) Farrar JT, Young JP Jr, LaMoreaux L, Werth JL, Poole MR. Clinical importance of changes in chronic pain intensity measured on an 11-point numerical pain rating scale. Pain, 94, 149–158 (2001).
- 37) Liukas A, Kuusniemi K, Aantaa R, Virolainen P, Niemi M, Neuvonen PJ, Olkkola KT. Pharmacokinetics of intravenous paracetamol in elderly patients. Clin. Pharmacokinet., 50, 121–129 (2011).
- 38) Owens KH, Murphy PG, Medlicott NJ, Kennedy J, Zacharias M, Curran N, Sreebhavan S, Thompson-Fawcett M, Reith DM. Population pharmacokinetics of intravenous acetaminophen and its metabolites in major surgical patients. J. Pharmacokinet. Pharmacodyn., 41, 211–221 (2014).
- 39) Pittman KA. Pentazocine in rhesus monkey plasma and brain after parenteral and oral administration. Life Sci. I., 12, 131–143 (1973).
- 40) Lötsch J, Skarke C, Liefhold J, Geisslinger G. Genetic predictors of the clinical response to opioid analgesics: clinical utility and future perspectives. Clin. Pharmacokinet., 43, 983–1013 (2004).
- 41) Neal EA, Meffin PJ, Gregory PB, Blaschke TF. Enhanced bioavailability and decreased clearance of analgesics in patients with cirrhosis. Gastroenterology, 77, 96–102 (1979).
- 42) Lacroix BD, Friberg LE, Karlsson MO. Evaluation of IPPSE, an alternative method for sequential population PKPD analysis. J. Pharmacokinet. Pharmacodyn., 39, 177–193 (2012).
- 43) Pisanu C, Franconi F, Gessa GL, Mameli S, Pisanu GM, Campesi I, Leggio L, Agabio R. Sex differences in the response to opioids for pain relief: A systematic review and meta-analysis. Pharmacol. Res., 148, 104447 (2019).
- 44) Fillingim RB, Ness TJ, Glover TL, Campbell CM, Price DD, Staud R. Experimental pain models reveal no sex differences in pentazocine analgesia in humans. Anesthesiology, 100, 1263–1270 (2004).
- 45) Abou Hammoud H, Simon N, Urien S, Riou B, Lechat P, Aubrun F. Intravenous morphine titration in immediate postoperative pain management: population kinetic-pharmacodynamic and logistic regression analysis. Pain, 144, 139–146 (2009).
- 46) Packiasabapathy S, Horn N, Sadhasivam S. Genetics of perioperative pain management. Curr. Opin. Anaesthesiol., 31, 749–755 (2018).
- 47) Henker RA, Lewis A, Dai F, Lariviere WR, Meng L, Gruen GS, Sereika SM, Pape H, Tarkin IS, Gowda I, Conley YP. The associations between OPRM 1 and COMT genotypes and postoperative pain, opioid use, and opioid-induced sedation. Biol. Res. Nurs., 15, 309–317 (2013).
- 48) Miguel Asai MA, Lilian Mayagoitia LM, David García DG, Gilberto Matamoros-Trejo GM, Marcela Valdés-Tovar MV, Phillipe Leff PL. Rat brain opioid peptides-circadian rhythm is under control of melatonin. Neuropeptides, 41, 389–397 (2007).
- 49) Koyanagi S. Chrono-pharmaceutical approaches to optimize dosing regimens based on the circadian clock machinery. Biol. Pharm. Bull., 44, 1577–1584 (2021).
- 50) Paice JA, Cohen FL. Validity of a verbally administered numeric rating scale to measure cancer pain intensity. Cancer Nurs., 20, 88–93 (1997).
- 51) Kremer E, Atkinson HJ, Ignelzi RJ. Measurement of pain: patient preference does not confound pain measurement. Pain, 10, 241–248 (1981).