Regular Articles
SLC25A40 Facilitates Anticancer Drug Resistance in Human Leukemia K562 Cells
2023 Volume 46 Issue 9 Pages 1304-1309

Details
2023 Volume 46 Issue 9 Pages 1304-1309
The chronic myelogenous leukemia cell line, K562/ADM is derived from the K562 cell line, which is resistant to doxorubicin (alias, adriamycin: ADM). P-glycoprotein levels are significantly higher in K562/ADM cells than in K562 cells. The overexpression of p-glycoprotein has been shown to cause drug resistance. Therefore, the present study investigated a novel mechanism underlying the drug resistance of K562/ADM cells. A gene ontology analysis demonstrated that the expression of solute carrier (SLC)-mediated transmembrane transport genes was significantly higher in K562/ADM cells than in K562 cells. The expression level of a member of the SLC family, SLC25A40 was higher in K562/ADM cells than in K562 cells. SLC25A40 is located near the ABCB1 gene. A real-time PCR analysis showed that the expression of SLC25A40, ABCB4, and ADAM22 was up-regulated. These genes are located close to SLC25A40. The down-regulation of SLC25A40 significantly decreased the mitochondrial concentration of glutathione and cell proliferation. Collectively, the present results demonstrated that the expression of SLC25A40 was up-regulated in K562/ADM cells, which enhanced to cell proliferation, and that the expression of SLC25A40 affected drug resistance to ADM.
Multidrug resistance to anticancer drugs is a major cause of cancer chemotherapy failure. Molecular biology studies revealed a number of multidrug resistance mechanisms, such as the overexpression of P-glycoprotein (P-gp). P-gp is an ATP-binding cassette (ABC) transporter that excretes anticancer drugs out of cells, resulting in drug resistance.1) P-gp 1 is encoded by the ABCB1 gene and P-gp 3 by the ABCB4 gene. The present study investigated a novel drug resistance mechanism in K562/ADM cells.2) Multidrug resistance was induced in this cell line by exposing the human leukemia cell line K562 to adriamycin (ADM).3) Whole transcriptome analyses were performed to elucidate the mechanisms underlying this resistance. The results obtained showed that the expression of the glutathione (GSH) transporter, SLC25A40 was higher in K562/ADM cells than in K562 cells. The mitochondrial carrier system (MCS) transports small molecules between mitochondria and the cytoplasm. It is integral to the core mitochondrial function regulating cellular chemistry by metabolism.4)
SLC25A40 is one of the solute carrier (SLC) transporters that comprise a family of MCS transporters and uptakes GSH into mitochondria.5) SLC transporters facilitate the transport of a wide array of substrates across biological membranes, and play important roles in physiological processes ranging from the cellular uptake of nutrients to the absorption of xenobiotics.6) The MCS transports small molecules between mitochondria and the cytoplasm. We herein showed that SLC25A40 increased the sensitivity of K562 and K562/ADM cells to ADM.
The human chronic myelogenous leukemia cell lines, K562 (JCRB0019) and K562/ADM (JCRB1002) were purchased from the Japanese Collection of Research Bioresources Cell Bank (Osaka, Japan). These cell lines were tested and authenticated by the JCRB Cell Bank. The real-time PCR master mix, THUNDERBIRD Next SYBR qPCR Mix, and reverse transcriptase, ReverTra Ace were purchased from TOYOBO Co., Ltd. (Osaka, Japan). The synthetic SLC25A40 small interfering RNA (siRNA), MISSION predesign siRNA was purchased from Merck KGaA. (EHU005041, Darmstadt, Germany). PCR primers were obtained from Fasmac Co., Ltd. (Atsugi, Japan). Primer sequences are shown in Table 1. Rabbit polyclonal antibodies (HPA055197) specific for SLC25A40 were purchased from Atlas Antibodies (Bromma, Sweden). Mouse monoclonal antibodies specific for Glyceraldehyde-3-phosphate dehydrogenase (GAPDH, clone No. 5A12), an anti-mouse immunoglobulin G (IgG), peroxidase-conjugated rabbit polyclonal antibody, the ScreenFect siRNA Transfection Reagent, ImmunoStar LD, radio immunoprecipitation assay (RIPA) buffer, Protease Inhibitor Cocktail Set III, and all other reagents were purchased from FUJIFILM Wako Pure Chemical Corporation (Osaka, Japan). An inhibitor of GSH synthesis, D,L-Buthionine-(S,R)-Sulfoximine (BSO) was purchased from Cayman Chemical Company (Ann Arbor, MI, U.S.A.). The oxidized glutathione (GSSG)/GSH quantification kit was purchased from DOJINDO Laboratories (Kumamoto, Japan).
| Forward primer (5′–3′) | Reverse primer (5′–3′) | |
|---|---|---|
| GAPDH | AACAGCCTCAAGATCATCAGC | GGATGATGTTCTGGAGAGCC |
| SLC25A40 | AACAACCCACTCCCCAAAGG | GCCTCCCTCTTCACAGACAC |
| ABCB1 | CCCATCATTGCAATAGCAGG | GTTCAAACTTCTGCTCCTGA |
| ABCC2 | ACAGAGGCTGGTGGCAACC | ACCATTACCTTGTCACTGTCCATGA |
| ABCB4 | GCTACAGTGAAGAGGGGCTG | ACCATCGAGAAGCACTGTCC |
| ADAM22 | AGAACAGAGGTCAAATGGGCT | TCCCATAGCCTGGCACTTTG |
| SLC25A39 | TGCCCTTCTCAGCCCTGTA | GGTTCACTCTCACAGCCTCC |
The names of the gene symbols are as follows: GAPDH: Glyceraldehyde-3-Phosphate Dehydrogenase, SLC25A40: Solute Carrier Family 25 Member 40. ABCB1: ATP Binding Cassette Subfamily B Member 1, ABCC2: ATP Binding Cassette Subfamily C Member 2 ABCB4: ATP Binding Cassette Subfamily B Member 4, ADAM22: ADAM Metallopeptidase Domain 22, SLC25A39: Solute Carrier Family 25 Member 39.
K562 and K562/ADM cells were grown in RPMI-1640 supplemented with 10% fetal bovine serum, 2 mM glutamine, and 100 units/mL of penicillin at 37 °C in a 5% CO2 humidified atmosphere. Synthetic SLC25A40 siRNA was transfected with the ScreenFect siRNA Transfection Reagent according to the manufacturer’s protocol. Cell proliferation levels were evaluated after a 48-h incubation using the 3-(4,5-dimethylthiazol-2-yl)-2,5-diphenyl tetrazolium bromide (MTT) assay.
Real-Time Quantitative RT-PCR (qRT-PCR) AnalysisSingle-stranded cDNA was synthesized by reverse transcriptase using ReverTra Ace according to the manufacturer’s instructions. Real-time quantitative PCR methods were described in a previous study.7) GAPDH was used as a reference gene for mRNA. Comparisons between 2 groups of expression levels were performed with the Student’s t-test, and between 3 groups with the Tukey–Kramer test or Dunnett’s test.
Electrophoresis and Western BlottingWhole cells were lysed in RIPA buffer with a protease inhibitor cocktail. Protein concentrations were measured using the Protein Assay Kit (Nacalai Tesque, Kyoto, Japan). Whole cell homogenates (GAPDH: 5 µg; SLC25A40: 20 µg) were separated using 12% sodium dodecyl sulfate (SDS) polyacrylamide gels, and proteins were then transferred onto nitrocellulose membranes. These membranes were then incubated with Blocking One (Nacalai Tesque, Inc.) at room temperature for 1 h for blocking, followed by an incubation with the primary antibody at dilution ratios of 1000-fold SLC25A40 and 10000-fold GAPDH. After washing three times with Tris-buffered saline with Tween®20 (TBS-T), the membranes were further incubated with a 20000-fold diluted secondary antibody conjugated with peroxidase. The membranes were then rinsed once for 15 min and four more times for 5 min with TBS-T. The ImmunoStar LD Western blotting detection system was used for detection. Optical densities were measured using the public domain program ImageJ (https://imagej.nih.gov/ij/download.html).
Mitochondrial Isolation and GSSG/GSH Concentration MeasurementThe collected cells were homogenized with a homogenization buffer (250 mM Sucrose, 5 mM Tris–HCl, 1 mM Ethylenediaminetetraacetate pH 7.4, 1 mM Dithiothreitol) with a protease inhibitor cocktail, and mitochondria fraction were centrifuged at 800 × g for 10 min. The supernatant was collected and centrifuged at 12000 × g for 15 min. The sediment was homogenized with a RIPA buffer containing protease inhibitor cocktail to adjust the protein concentration to 100 µg/mL. The concentration of oxidized glutathione (glutathione disulfide: GSSG) and GSH in the separated mitochondrial sample was measured according to the instruction manual of the GSSG/GSH measurement kit.
A transcriptome analysis to estimate the expression levels of RNAs in K562 and K562/ADM cells was outsourced to a contract service (Filgen Inc., Nagoya, Japan). A scatterplot is shown in Fig. 1. The gene ontology analysis showed that the expression of genes involved in the SLC-mediated transmembrane transport pathway was significantly higher in K562/ADM cells than in K562 cells (Supplementary Table 1). The expression level of a member of the SLC family, SLC25A40 was higher in K562/ADM cells than in K562 cells (Table 2). The real-time PCR analysis also showed higher expression levels of SLC25A40, ABCB1, ADAM22, and ABCB4, but not ABCC2 (Table 3). ABCB1, ADAM22, DBF4, RUNDC3B and ABCB4 are located on chromosome 7 and are close to the SLC25A40 gene (Fig. 2). The expression of SLC25A39, a paralog of SLC25A40, was significantly higher in K562/ADM cells (Table 3).
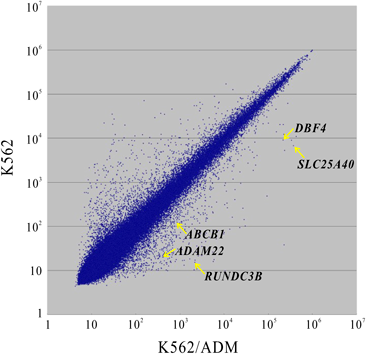
The point of the genes expression is noted by an arrow. Gene symbols are shown in the figure. ABCB1: ATP Binding Cassette Subfamily B Member 1, ADAM22: ADAM Metallopeptidase Domain 22, DBF4: DBF4 Zinc Finger, RUNDC3B: RUN Domain Containing 3B, SLC25A40: Solute Carrier Family 25 Member 40. Expression ratios are shown in Table 2.
| Gene symbol | Expression value {K562} | Expression value {K562/ADM} | Ratio |
|---|---|---|---|
| SLC25A40 | 6790 | 369945 | 54.5 |
| ABCB1 | 144 | 958 | 6.7 |
| ABCB4 | 38.6 | 54.8 | 1.4 |
| ADAM22 | 24.3 | 715.4 | 29.4 |
| ABCC2 | 8.7 | 9.0 | 1.1 |
| SLC25A39 | 597 | 513 | 0.86 |
| DBF4 | 9155 | 216368 | 23.6 |
| RUNDC3B | 15.3 | 2,183 | 142.9 |
| GAPDH | 369384 | 309771 | 0.8 |
Values are actual values measured once.
| Gene symbol | K562 | K562/ADM |
|---|---|---|
| SLC25A40 | 1.00 ± 0.08 | 41.08 ± 6.57*** |
| ABCB1 | 1.00 ± 0.06 | 292.50 ± 32.38*** |
| ABCB4 | 1.00 ± 0.12 | 1.48 ± 0.26** |
| ADAM22 | 1.00 ± 0.21 | 53.88 ± 8.89** |
| ABCC2 | 1.00 ± 0.08 | 0.90 ± 0.10 |
| SLC25A39 | 1.00 ± 0.03 | 1.56 ± 0.16** |
Values represent the relative ratio (mean ± standard error (S.E.)) of expression levels in K562 cells. Statistical analyses were performed using the Student’s t-test; *** p < 0.001, ** p < 0.01, significantly different from expression levels in K562 cells.

The SLC25A40 and ABCB1 genes are located in adjacent regions on chromosome 7, 7q21.12. The ADAM22, DBF4 and RUNDC3B and ABCB4 genes are also located in adjacent regions.
K562 and K562/ADM cells were treated with ADM or 7-ethyl-10-hydroxycamptothecin (SN-38), which are P-gp substrates. The ADM treatment at the IC50 of cell proliferation (K562: 0.4 µM, K562/ADM: 120 µM) significantly decreased SLC25A40 mRNA expression levels, while the SN-38 treatment (K562: 0.3 µM, K562/ADM: 3 µM) also down-regulated the expression of SLC25A40 (Table 4). The values of IC50 were assessed by the MTT assay.
| Vehicle | ADM | SN-38 | |
|---|---|---|---|
| K562 | 1.00 ± 0.05 | 0.61 ± 0.08** | 0.37 ± 0.08*** |
| K562/ADM | 1.00 ± 0.06 | 0.54 ± 0.03*** | 0.67 ± 0.09* |
Values represent the relative ratio (mean ± S.E.) of expression levels in K562 or K562/ADM cells. Significantly different from the vehicle group, *: p < 0.05, **: p < 0.01, ***: p < 0.001. The Student’s t-test.
SLC25A40 siRNA was transfected into K562 and K562/ADM cells. SLC25A40 siRNA transfection significantly decreased SLC25A40 mRNA expression levels in K562 cells (NC, 1.00 ± 0.06; siRNA, 0.33 ± 0.05, n = 9, Fig. 3A) and K562/ADM cells (NC, 1.00 ± 0.05; siRNA, 0.50 ± 0.06, n = 9, Fig. 3A). SLC25A40 siRNA transfection also significantly decreased the expression of SLC25A40 (relative expression of SLC25A40/GAPDH in K562/ADM cells, NC, 1.00 ± 0.06; siRNA, 0.48 ± 0.06, n = 4), but did not significantly affect that of GAPDH (Fig. 3B).

(A) siRNA inhibited SLC25A40 mRNA expression in K562 and K562/ADM cells. Values represent the relative ratio of the target gene per GAPDH, mean ± standard error of the mean (S.E.M.), to the control from independent experiments, n = 9. The negative control group (NC) was transfected with negative control RNA. Statistical analyses were performed using the Student’s t-test; *** p < 0.001, ** p < 0.01, * p < 0.05. (B) Typical Western blot images of SLC25A40 and GAPDH. Whole-cell homogenates of K562/ADM cells (GAPDH: 5 µg; SLC25A40: 20 µg) were separated using SDS polyacrylamide gels. SLC25A40 and GAPDH proteins were detected as 38- and 36-kDa bands, respectively. The vehicle group was treated with the transfection reagent, the NC group with the transfection reagent with negative control RNA, the siRNA group was treated the transfection reagent with siRNA. Optical densities were measured using the public domain program ImageJ. Statistical analyses were performed using the Student’s t-test; *** p < 0.001. (C) siRNA transfection significantly enhanced the cytostatic effects of the ADM treatment in K562 and K562/ADM cells. K562 cells were treated with ADM at a concentration of 0.5 µM and K562/ADM cells at a concentration of 120 µM. (n = 6, ** p < 0.01, the Student’s t-test). (D) The 50% IC of ADM with BSO at a dose of 1 mM. The ADM treatment with BSO significantly inhibited the proliferation of K562 cells (n = 6, * p < 0.05, the Student’s t-test). The same treatment did not show the enhancing effects of the combined administration with BSO in K562/ADM cells. (E) BSO exhibited cytotoxicity. The BSO treatment significantly inhibited the proliferation of K562 at a dose of 0.2 mM (n = 6, *** p < 0.001, Dunnett’s test). The same treatment significantly inhibited the proliferation of K562/ADM cells at a dose of 5 mM (n = 6, *** p < 0.001, Dunnett’s test).
The effects of GSH uptake inhibition by SLC25A40 knockdown and GSH synthesis inhibition by BSO treatment on ADM sensitivity were evaluated. The siRNA treatment significantly increased sensitivity to ADM. K562 cells were treated with ADM at a concentration of 0.5 µM and K562/ADM cells at a concentration of 120 µM. Relative cell proliferation with the ADM treatment with siRNA was significantly decreased in SLC25A40 siRNA-treated cells (K562: NC, 1.00 ± 0.06, siRNA, 0.70 ± 0.04; K562/ADM: NC, 1.00 ± 0.04, siRNA, 0.74 ± 0.04, n = 6, Fig. 3C). The effects of the GSH synthesis inhibitor, BSO on the proliferation of K562 and K562/ADM cells were examined. BSO was added to the culture medium at a concentration of 1 mM. The ADM treatment with BSO at a dose of 1 mM significantly decreased cell proliferation (K562: vehicle, 0.43 ± 0.10, with BSO, 0.30 ± 0.08; K562/ADM: vehicle, 119.1 ± 12.6, with BSO, 129.9 ± 22.6 µM, n = 6, Fig. 3D). The BSO treatment inhibited the proliferation of K562 cells, whereas higher doses were needed to suppress that of K562/ADM cells (Fig. 3E).
Effects of the BSO or siRNA Treatment on GSSG/GSH ConcentrationsThe effects of the down-regulated expression of SLC25A40 on GSSG and GSH concentrations in mitochondria were investigated. The knockdown of SLC25A40 significantly decreased mitochondrial GSH and GSSG concentrations. The GSH synthesis inhibitor, BSO significantly reduced the concentration of GSH, but not GSSG in mitochondria (Table 5). The BSO treatment also decreased the GSH/GSSG ratio (K562: NC 2.31, siRNA 2.55, BSO: 1.98; K562/ADM: NC 2.34, siRNA 3.19, BSO: 1.87).
| Mitochondrial GSSG (µmol/L) | |||||
|---|---|---|---|---|---|
| K562 | K562/ADM | ||||
| NC | siRNA | BSO | NC | siRNA | BSO |
| 3.01 ± 0.07 | 2.55 ± 0.12** | 2.95 ± 0.03 | 2.98 ± 0.05 | 2.75 ± 0.05* | 2.87 ± 0.01 |
| Mitochondrial GSH (µmol/L) | |||||
| K562 | K562/ADM | ||||
| NC | siRNA | BSO | NC | siRNA | BSO |
| 6.95 ± 0.07 | 6.51 ± 0.01*** | 5.83 ± 0.06*** | 6.98 ± 0.07 | 6.42 ± 0.05*** | 5.36 ± 0.06*** |
The siRNA group (siRNA) was transfected with the siRNA of SLC25A40. The negative control group (NC) was transfected with negative control RNA. The BSO group, a positive control treatment that depletes GSH, was applied at a dose of 1 mM. Mitochondrial fraction of protein concentrations were standardized to 100 µg/mL. Significantly different from the NC group, *: p < 0.05, **: p < 0.01, ***: p < 0.001. The Tukey–Kramer test.
We herein demonstrated the contribution of SLC25A40 to the resistance of K562/ADM cells to anti-cancer drugs. We examined the effects of the overexpression of SLC25A40 on anticancer drug resistance. A whole transcriptome analysis was performed to search for the changes in gene expression in K562/ADM cells that generated drug resistance due to the ADM treatment. The ontological analysis showed that molecular functions, such as SLC-mediated transmembrane transport, the metabolism of lipids and lipoproteins, and axon guidance, were enhanced in K562/ADM cells (Supplementary Table 1), and also that the expression of SLC25A40 and ADAM22 was up-regulated. (Tables 2, 3). Genes DBF4 and RUNDC3B, which are adjacent to SLC25A40, were also upregulated in K562/ADM cells (Fig. 2). RT-PCR showed that SL25A40 expression was significantly up-regulated in K562/ADM cells (Table 3). ABCC2 overexpression has been reported to result in ADM resistance.8) The present study showed that ABCC2 expression levels were unchanged in K562/ADM cells, suggesting that ABCC2 did not contribute to drug resistance in ADM cells. A disintegrin and metalloprotease (ADAM) is a family of membrane-spanning multi-domain proteins containing a metalloproteinase-like domain. ADAM22 has been implicated in a number of biological processes involving cell-cell and cell-matrix interactions. The up-regulation of ADAM22 was previously shown to induce tamoxifen resistance in breast cancer cells. Protein–protein interaction analyses have suggested that ADAM22 regulates tamoxifen resistance through PPARG, LGI1, KRAS, and LYN.9) The overexpression of ADAM22 may also contribute to drug resistance in K562/ADM cells. The expression of ADAM22 and ABCB4, which exist near the SLC25A40 gene, was also significantly higher in K562/ADM cells than in K562 cells. These results indicate that epigenetic changes in gene expression near the ABCB1 and SLC25A40 genes in K562/ADM cells affect drug resistance. Patch et al. reported that the formation of an aberrant fusion gene deleted parts of the SLC25A40 and ABCB1 genes, resulting in high drug resistance in ovarian cancer.10) K562/ADM cells exhibited significantly higher drug resistance to ADM and SN38 than K562 cells. The present results suggest that the treatment with ADM or SN-38 reduced the expression of SLC25A40 (Table 4). Hui et al. reported that the exposure of K562 cells to ADM induced ABCB1 mRNA expression.11) Saxena et al. demonstrated that TWIST, SNAI1, and FOXC2 were capable of increasing the promoter activity of ABC transporters.12) However, transcription factors that act on the promoter of the SLC25A40 gene remain unclear. No experimental reports of transcription factors acting on the expression of SLC25A40 could be confirmed. A bioinformatics analysis predicts the presence of CpG islands upstream of the SLC25A40 gene and the presence of a consensus region in the sequence where Sp1 acts.13,14) ADM treatment has been reported to decrease Sp1.15) Based on these reports and predictions from bioinformatics analyses, it was suggested that ADM treatment may reduce Sp1 expression, resulting in decreased SLC25A40 expression (Supplementary Fig. 1). SLC25A40 siRNA significantly decreased the expression levels of SLC25A40 (Figs. 3A, B). The down-regulation of SLC25A40 significantly increased sensitivity to ADM in K562 cells (Fig. 3C). A previous study showed that the suppression of SLC25A40 expression in SLC25A39-knockout cells markedly inhibited cell proliferation by lowering the mitochondrial concentration of GSH.5) Slabbaert et al. reported that SLC25A39/40 play crucial roles in neuronal survival.16) These findings suggest that SLC25A40 is involved in cell proliferation and survival. In contrast to K562 cells, the rate of the increase in SLC25A39 expression was not as high as that in SLC25A40 expression in K562/ADM cells (Tables 2, 3), suggesting that changes in SLC25A39 expression do not affect the uptake of GSH. Collectively, these results indicate that K562/ADM cells highly expressing SLC25A40 exhibit resistance to the depletion of GSH induced by BSO (Supplementary Table 2).
The GSH synthesis inhibitor,17) BSO significantly decreased the proliferation of K562 cells. Combined treatment with BSO significantly decreased the 50% IC of ADM in K562 cells, but no change was observed in K562/ADM cells (Fig. 3D). Combined treatment ADM with BSO showed significantly intensified ADM toxicity in K562 cells. On the other hand, it was not observed intensified ADM toxicity in K562/ADM cells (Fig. 3D). The BSO treatment inhibited the proliferation of K562 cells, whereas higher doses were needed to suppress that of K562/ADM cells (Fig. 3E). It was estimated that the overexpressed P-gp suppressed the intracellular accumulation of ADM, and thus the cytotoxicity-enhancing effect of BSO addition was not observed in K562/ADM cells, however, the underlying mechanisms remain unclear. The down-regulation of SLC25A40 significantly decreased mitochondrial GSH and GSSG concentrations (Table 5). BSO also significantly reduced mitochondrial GSH concentrations. The same treatment decreased the GSH/GSSG ratio in K562 and K562/ADM cells (Table 5). The knockdown treatment of SLC25A40 lowered GSH levels by reducing GSH uptake, but did not affect the GSH/GSSG ratio. On the other hand, BSO decreased the GSH/GSSG ratio. Guo et al. reported that BSO reduced GSH concentrations and the GSH/GSSG ratio and increased the production of reactive oxygen species (ROS) in mice.18) Therefore, ROS may be involved in the decrease observed in the GSH/GSSG ratio after the BSO treatment. One of the SLC transporters, SLC25A10 (alias, Mitochondrial Dicarboxylate Carrier), SLC25A11 (alias, Mitochondrial 2-Oxoglutarate/Malate Carrier Protein), has also been reported to play an important role in GSH uptake into mitochondria.19) As a result of transcriptome analysis, a large difference in the expression level of SLC25A40 was observed, but no large difference in the expression of SLC25A10, 11, GSH synthetase, and others (Supplementary Table 2). was observed. The GSH hydrolysate cysteine (Cys)-glycine (Gly) has been reported to promote free radical generation and exhibit cytotoxicity.20) It has been reported that GSH suppress cell proliferation in a concentration-dependent manner.21) In other words, excessive elevation of GSH may cause damage to cells. Despite the overexpression of SLC25A40 in K562/ADM cells, significant difference in GSH concentrations was not observed between K562 cells. It was estimated that the concentrations of GSH in K562/ADM cells were adjusted to an appropriate level. It has been reported that ADM-induced ROS generation in the mitochondrial respiratory chain is thought to be one of the major contributors to cell death.22) ADM treatment significantly increased ROS and oxidative stress levels, and induced apoptosis.23) It is well known that ROS in mitochondria play a crucial role in cell death, and GSH has been reported to scavenge ROS.24) It was estimated that the decline of GSH concentration in mitochondria due to the reduction of SLC25A40, which can affect the sensitivity to anticancer drugs. We herein demonstrated that the expression of SLC25A40 was up-regulated in K562/ADM cells, which promoted cell proliferation. The present results indicate that the expression level of SLC25A40 affects resistance to ADM.
This work was supported by a budget for graduate study from the Health Sciences University of Hokkaido.
The authors declare no conflict of interest.
This article contains supplementary materials.