Abstract
It was recently reported that the dexmedetomidine concentration within the extracorporeal circuit decreases with co-administration of midazolam. In this study, we investigated whether displacement of dexmedetomidine by midazolam from the binding site of major plasma proteins, human serum albumin (HSA) and α1-acid glycoprotein (AAG), would increase levels of free dexmedetomidine that could be adsorbed to the circuit. Equilibrium dialysis experiments indicated that dexmedetomidine binds to a single site on both HSA and AAG with four times greater affinity than midazolam. Midazolam-mediated inhibition of the binding of dexmedetomidine to HSA and AAG was also examined. The binding of dexmedetomidine to these proteins decreased in the presence of midazolam. Competitive binding experiments suggested that the inhibition of binding by midazolam was due to competitive displacement at site II of HSA and due to non-competitive displacement at the site of AAG. Thus, our present data indicate that free dexmedetomidine displaced by midazolam from site II of HSA or from AAG is adsorbed onto extracorporeal circuits, resulting in a change in the dexmedetomidine concentration within the circuit.
INTRODUCTION
Extracorporeal membrane oxygenation (ECMO) is a treatment used to replace the function of the respiratory and circulatory systems in critically ill patients until they recover. When using ECMO, patients are often sedated with agents such as dexmedetomidine and midazolam to ensure patient comfort and safety and reduce oxygen consumption and basal metabolic rate.
Ex vivo and in vitro studies by Shekar et al. and Dallefeld et al., respectively, suggested that dexmedetomidine and midazolam are adsorbed by the ECMO circuit,1,2) which may result in decreased drug exposure in vivo. Michihara et al. recently reported that the adsorption of dexmedetomidine and midazolam onto the extracorporeal circuit is caused by the combined use of both drugs as compared with single-infusion of either drug using an in vitro extracorporeal circuit system in which the polymer-coated polyvinyl chloride tube is incorporated but not a membrane oxygenerator.3) They suggested that the increased free drugs generated by mutual displacement between dexmedetomidine and midazolam on albumin in an extracorporeal circuit could be adsorbed onto the tube of the circuit system.
Human serum albumin (HSA) and human α1-acid glycoprotein (AAG) are the principal plasma proteins involved in drug-binding in plasma.4) HSA has three α-helical domains that are structurally similar, designated as domains I, II, and III. Each domain is divided into subdomains A and B.5) Sudlow’s sites I and II, the well-known drug binding sites, are hydrophobic pockets in subdomains IIA and IIIA of HSA.6,7) AAG also contains a drug-binding pocket with three distinct “lobes,” I-III, located in the center of an eight-stranded β-barrel structure.8,9) It is widely accepted that AAG has a broad binding site composed of three distinct subsites.10) Midazolam is thought to bind to site II of HSA.11–13) However, no systematic studies have examined the protein binding of dexmedetomidine and midazolam with regard to the main plasma proteins to which they bind, the binding site on the proteins, or the possibility of mutual displacement of the drugs on the proteins.
In this study, we investigated whether displacement of dexmedetomidine from the binding site of HSA and AAG by midazolam leads to an increase in free dexmedetomidine that can be adsorbed onto the extracorporeal circuit.
MATERIALS AND METHODS
MaterialsHSA (fraction V, fatty acid-free), AAG, and warfarin (CAS No. 951658-59-6) were purchased from Sigma Chemical Co. (St. Louis, MO, U.S.A.). Dexmedetomidine (CAS No. 113775-47-6) was obtained from Tokyo Chemical Industry Co., Ltd. (Tokyo, Japan). Diazepam (CAS No. 439-14-5) and midazolam (CAS No. 59467-70-8) were purchased from FUJIFILM Wako Pure Chemical Corporation (Osaka, Japan). All other chemicals were commercially available and of high grade. Sodium phosphate buffer (67 mM; pH 7.4) was used for protein binding experiments.
Analysis of Dexmedetomidine and Midazolam Binding to HSA or AAGEquilibrium dialysis was used to determine dexmedetomidine and midazolam binding parameters to HSA or AAG. The equilibrium dialysis experiments were conducted using 2-mL plastic dialysis cells (Sanplatec Corp., Osaka, Japan). The drug sample and buffer (1.0 mL in each case) were added to cell compartments separated by Visking cellulose membranes, followed by gentle shaking for 18 h. After equilibrium, drug concentrations in the buffer compartment (Cf; free drug concentration) and the protein compartment (Cb + Cf; sum of bound and free drug concentrations) were measured by HPLC. The concentration of bound drug (Cb) was calculated by subtracting Cf from Cb + Cf. Considering the plasma drug and protein concentrations, the dexmedetomidine-midazolam interaction is assumed to occur at a high-affinity binding site on plasma protein. Therefore, the binding experiments were conducted under conditions showing only high-affinity binding (protein, 40 µM; drug, 10–50 µM), and the data were fitted to Eq. 1 using GraphPad PRISM®, version 7 (GraphPad Software, Inc., San Diego, CA, U.S.A.):
 | (1) |
where r is the moles of drug bound per mole of protein, and Pt is the protein concentration. The binding parameters n and K represent the number of binding sites and the association constant for the high-affinity binding site, respectively.
Additionally, the free fractions for the drug-protein interactions were calculated according to Eq. 2 below.
 | (2) |
Analysis of the Interaction between the Two Ligands at the High-Affinity Binding Site of the ProteinThe Kragh–Hansen method is used to elucidate the mode of interaction between two ligands, A and B, each of which binds to the high-affinity binding site of protein.14,15) In this method, if ligand A is competitively displaced by ligand B at the same binding site, the moles of ligand A bound per mole of protein, rA, can be described as follows:
 | (3) |
where Ab represents the concentration of bound ligand A, KA and KB represent the association constants of ligands A and B, respectively, while Af and Bf represent the free concentrations of ligands A and B, respectively.
HPLC ConditionsThe HPLC system used in this study was a Hitachi model D-2000 Elite HPLC (Hitachi, Ltd., Tokyo, Japan). A YMC-Triart C18 column (5 µm particle size, 250 × 4.6 mm ID, YMC Co., Ltd., Kyoto, Japan) was used as the stationary phase and was kept at 40 °C. For gradient analysis, the mobile phase consisted of solvent A (50 mM sodium dihydrogen phosphate) and solvent B (50 mM sodium dihydrogen phosphate and acetonitrile [30 : 70, v/v]). Dexmedetomidine, midazolam, warfarin, and diazepam were separated using the following linear gradient elution program: 0–7 min (70–0% A), 7–10 min (0% A), 10–15 min (0–70% A), and 15–20 min (70% A), at a constant flow rate of 1.0 mL/min, and injection volume of 50 µL. The eluate was monitored at a detection wavelength of 210 nm for 20 min. The retention times of dexmedetomidine, midazolam, warfarin, and diazepam were 7.8, 10.7, 11.3, and 12.3 min, respectively.
Contribution of HSA to the Binding of Drug to Plasma ProteinsThe concentrations of drug bound to HSA and AAG (CbHSA and CbAAG) were calculated using Eqs. 4 and 5 below:
 | (4) |
 | (5) |
where [HSA] and [AAG] represent the total concentration of HSA and AAG, respectively. NHSA and nAAG represent the number of high-affinity binding sites on HSA and AAG, respectively. KHSA and KAAG represent the association constants for the high-affinity binding sites of HSA and AAG, respectively.
The contribution ratio of HSA to the binding of drug to plasma proteins was calculated using Eq. 6 below.
 | (6) |
The statistical significance of differences was determined by the Student’s t-test or Dunnett’s test for the single or multiple comparisons of groups, respectively. All statistical analyses used GraphPad PRISM®, version 7. A probability value (p) less than 0.05 was considered significant.
RESULTS AND DISCUSSION
Binding Parameters of Dexmedetomidine and Midazolam for HSA and AAGThe binding parameters of dexmedetomidine and midazolam for the high-affinity binding sites of HSA and AAG were determined using an equilibrium dialysis technique. Values for the binding parameters n and K obtained by fitting the data to the binding equation (Figs. 1, 2) are summarized in Table 1. Given that the number of binding sites (n) was nearly one, we concluded that dexmedetomidine and midazolam bind to a single site on HSA and AAG. The affinity of dexmedetomidine for HSA (K = 0.38 × 10⁵ M−1) was weaker than that for AAG (K = 1.94 × 10⁵ M−1). Using high-performance affinity chromatography, Woolfork et al. also reported that the K value for the binding of dexmedetomidine to HSA (3.66 × 10² M−1) is lower than that for binding to AAG (1.31 × 10⁴ M−1).16) The lower K values compared with our data could be due to the different methods used in the analyses. The affinity of midazolam for HSA (K = 1.77 × 10⁵ M−1) and AAG (K = 8.07 × 10⁵ M−1) was much higher than the affinity of dexmedetomidine. Moreover, the therapeutic concentration of midazolam (460 nM) is much higher than that of dexmedetomidine (4.99 nM).3,17) Thus, it was suggested that the affinity and plasma concentration of midazolam are sufficient to displace dexmedetomidine from the binding sites of both HSA and AAG. This implies that dexmedetomidine displaced by midazolam may have a higher chance of being adsorbed to the extracorporeal circuit compared to midazolam displaced by dexmedetomidine, as previously reported by Michihara et al.3)
Table 1. Binding Parameters (
n, K) of Dexmedetomidine and Midazolam for Binding to HSA and AAG at pH 7.4 and 25 °C, as Determined Using Equilibrium Dialysis
| Serum proteins | Dexmedetomidine | Midazolam |
|---|
| n | K (×105 M−1) | n | K (×105 M−1)## |
|---|
| HSA | 0.96 ± 0.07 | 0.38 ± 0.05 | 1.15 ± 0.09 | 1.77 ± 0.18 |
| AAG | 1.06 ± 0.06 | 1.94 ± 0.27** | 0.99 ± 0.10 | 8.07 ± 0.89**## |
Data are presented as the mean ± standard deviation (N = 5), ** p < 0.01 vs. HSA, ##p < 0.01 vs. dexmedetomidine.
Inhibition experiments were conducted to investigate if midazolam displaces dexmedetomidine bound to HSA and AAG. The addition of midazolam significantly increased the free fraction of dexmedetomidine in the HSA and AAG binding analyses (Fig. 3). A theoretical analysis was conducted to elucidate the inhibition mechanism, assuming competitive and independent binding between dexmedetomidine and midazolam. Typical site marker ligands (warfarin for site I of HSA and diazepam for site II of HSA) were used as displacers for the HSA binding (Fig. 4A). The experimental values for the binding of dexmedetomidine to HSA in the presence of midazolam and diazepam fit a curve assuming competitive binding. In contrast, for the binding of dexmedetomidine in the presence of warfarin, the experimental values approximated a curve assuming independent binding, which means that warfarin does not displace dexmedetomidine from HSA. These data suggest that midazolam competitively displaces dexmedetomidine bound to site II, which is the common primary binding site on HSA. These findings were consistent with those reported by Khan et al., Bhattacharya et al., and Ohmori et al., which suggested that midazolam binds to site II.11–13) The experimental values for dexmedetomidine binding to AAG in the presence of midazolam were close to but did not fit a curve assuming competitive binding (Fig. 4B). Thus, non-competitive displacement of dexmedetomidine by midazolam is proposed for the binding to AAG. AAG is thought to have a wide binding site consisting of three different subsites.10) Therefore, dexmedetomidine and midazolam may bind to different subsites that are close enough to cause indirect (i.e., non-competitive) displacement, as reported for the interactions between some phenothiazine derivatives and dicumarol18) or between some dicumarol derivatives and protriptyline.19)
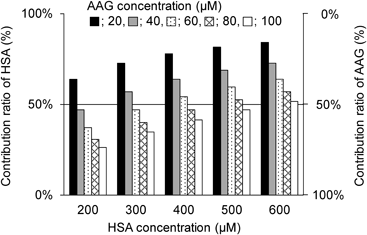
Contributions of HSA and AAG to the Binding of Dexmedetomidine to Plasma ProteinsThe binding of dexmedetomidine to plasma proteins could be altered by changing the concentration of HSA or AAG. Therefore, the contribution ratio of HSA to the binding of dexmedetomidine to plasma proteins was simulated, assuming the therapeutic concentration of dexmedetomidine (4.99 nM) (Fig. 5). At all HSA concentrations examined (200–600 µM), the contribution ratio of HSA was >50% when the AAG concentration was 20 µM. Especially at the highest concentration of HSA (600 µM), the contribution of HSA was always greater than that of AAG (i.e., contribution ratio of HSA >50%). When the AAG concentration was increased, the contribution of HSA decreased. At the lowest HSA concentration (200 µM), the contribution of HSA was lower than that of AAG when the AAG concentration ranged from 40 to 100 µM. The results indicate that midazolam and dexmedetomidine bind more strongly to AAG than to HSA. This implies that dexmedetomidine will be displaced more at AAG than at HSA since AAG contributes more (i.e., HSA contributes less) to its protein binding. Additionally, when AAG contributes more, the increase in free concentration of dexmedetomidine and subsequent adsorption to the circuit, due to displacement from AAG, may be more pronounced compared to when the contribution of AAG is lower. However, further studies using a circuit are required to confirm this. Thus, understanding the extent of the increase in free dexmedetomidine when midazolam is co-administered in patients on ECMO will require data regarding how changes in the contributions of HSA and AAG affect the binding of dexmedetomidine to plasma proteins at different concentrations of these proteins.
The plasma concentration of HSA (600 µM) can decline markedly to 50% of the concentration in healthy subjects, especially in patients with severe illnesses,20–22) whereas the plasma concentration of AAG can increase 3- to 4-fold compared to the normal level (11–23 µM) in patients with inflammation, infection, or renal impairment.22,23) As patients on ECMO typically have severe illness with inflammation and infection, the contribution of AAG to the binding of dexmedetomidine to plasma proteins may be greater than that of HSA. Therefore, in patients on ECMO, the free dexmedetomidine generated by displacement from AAG rather than HSA could be primarily adsorbed to the extracorporeal circuit. Hence, adsorption to the extracorporeal circuit of free midazolam generated by dexmedetomidine-mediated displacement from HSA and AAG should also be considered, as suggested by Michihara et al.3)
CONCLUSION
Our present data indicate that free dexmedetomidine generated by midazolam-mediated displacement from site II of HSA and from AAG could adsorb to the extracorporeal circuit, resulting in a change in the plasma concentration of dexmedetomidine in cases involving co-administration of midazolam.
Acknowledgments
We thank Sayaka Nishiyama for technical assistance with the experiments.
Conflict of Interest
The authors declare no conflict of interest.
REFERENCES
- 1) Dallefeld SH, Sherwin J, Zimmerman KO, Watt KM. Dexmedetomidine extraction by the extracorporeal membrane oxygenation circuit: results from an in vitro study. Perfusion, 35, 209–216 (2020).
- 2) Shekar K, Roberts JA, Mcdonald CI, Ghassabian S, Anstey C, Wallis SC, Mullany DV, Fung YL, Fraser JF. Protein-bound drugs are prone to sequestration in the extracorporeal membrane oxygenation circuit: results from an ex vivo study. Crit. Care, 19, 164 (2015).
- 3) Michihara A, Hanada M, Nagatsuka (Handa) Y, Mizoguchi T, Ohchi Y, Sato Y. Change of dexmedetomidine and midazolam concentrations by simultaneous injection in an in vitro extracorporeal circuit. Perfusion, 02676591231184715 (2023).
- 4) Otagiri M. A molecular functional study on the interactions of drugs with plasma proteins. Drug Metab. Pharmacokinet., 20, 309–323 (2005).
- 5) He XM, Carter DC. Atomic structure and chemistry of human serum albumin. Nature, 358, 209–215 (1992).
- 6) Yamasaki K, Chuang VT, Maruyama T, Otagiri M. Albumin-drug interaction and its clinical implication. Biochim. Biophys. Acta, 1830, 5435–5443 (2013).
- 7) Fanali G, di Masi A, Trezza V, Marino M, Fasano M, Ascenzi P. Human serum albumin: from bench to bedside. Mol. Aspects Med., 33, 209–290 (2012).
- 8) Nishi K, Ono T, Nakamura T, Fukunaga N, Izumi M, Watanabe H, Suenaga A, Maruyama T, Yamagata Y, Curry S, Otagiri M. Structural insights into differences in drug-binding selectivity between two forms of human α1-acid glycoprotein genetic variants, the A and F1*S forms. J. Biol. Chem., 286, 14427–14434 (2011).
- 9) Schönfeld DL, Ravelli RBG, Mueller U, Skerra A. The 1.8-Å crystal structure of α1-acid glycoprotein (Orosomucoid) solved by UV RIP reveals the broad drug-binding activity of this human plasma lipocalin. J. Mol. Biol., 384, 393–405 (2008).
- 10) Maruyama T, Otagiri M, Takadate A. Characterization of drug binding sites on α1-acid glycoprotein. Chem. Pharm. Bull., 38, 1688–1691 (1990).
- 11) Khan SN, Islam B, Khan AU. Probing midazolam interaction with human serum albumin and its effect on structural state of protein. Int. J. Integr. Biol., 1, 102–112 (2007).
- 12) Bhattacharya AA, Curry S, Franks NP. Binding of the general anesthetics propofol and halothane to human serum albumin. High resolution crystal structures. J. Biol. Chem., 275, 38731–38738 (2000).
- 13) Ohmori J, Maeda S, Higuchi H, Ishii M, Arai Y, Tomoyasu Y, Kohjitani A, Shimada M, Miyawaki T. Propofol increases the rate of albumin-unbound free midazolam in serum albumin solution. J. Anesth., 25, 618–620 (2011).
- 14) Kragh-Hansen U. Evidence for a large and flexible region of human serum albumin possessing high affinity binding sites for salicylate, warfarin, and other ligands. Mol. Pharmacol., 34, 160–171 (1988).
- 15) Kragh-Hansen U. Molecular aspects of ligand binding to serum albumin. Pharmacol. Rev., 33, 17–53 (1981).
- 16) Woolfork AG, Suh K, Weigand M, Hage DS. Studies of binding by 2-imidazolines to human serum albumin and alpha1-acid glycoprotein by high-performance affinity chromatography. J. Pharm. Biomed. Anal., 202, 114135 (2021).
- 17) Van der Maaten JMAA, Epema AH, Gallandat Huet RCG, Hennis PJ. The effect of midazolam at two plasma concentrations on hemodynamics and sufentanil requirement in coronary artery surgery. J. Cardiothorac. Vasc. Anesth., 10, 356–363 (1996).
- 18) Miyoshi T, Yamamichi R, Maruyama T, Otagiri M. Reversal of signs of induced cotton effects of dicumarol-α1-acid glycoprotein systems by phenothiazine neuroleptics through ternary complexation. Pharm. Res., 9, 845–849 (1992).
- 19) Miyoshi T, Yamamichi R, Maruyama T, Takadate A, Otagiri M. Further characterization of reversal of signs of induced Cotton effects of dicumarol derivatives-α1-acid glycoprotein systems by protriptyline. Biochem. Pharmacol., 43, 2161–2167 (1992).
- 20) Peters T. All About Albumin: Biochemistry, Genetics, and Medical Applications. Academic Press, San Diego, California (1995).
- 21) Udy AA, Roberts JA, Lipman J. Antibiotic Pharmacokinetic/Pharmacodynamic Considerations in the Critically Ill. Springer, Singapore (2017).
- 22) Kremer JM, Wilting J, Janssen LH. Drug binding to human alpha-1-acid glycoprotein in health and disease. Pharmacol. Rev., 40, 1–47 (1988).
- 23) Chuang VT, Otagiri M. Photoaffinity labeling of plasma proteins. Molecules, 18, 13831–13859 (2013).