Abstract
Indigo naturalis (IN), derived from the leaves of the indigo plant, is a traditional Chinese medicine that has historically been used for its anti-inflammatory properties in the treatment of various diseases, including ulcerative colitis (UC). However, long-term use of IN in UC patients is incontrovertibly associated with the onset of pulmonary arterial hypertension (PAH). To investigate the mechanisms by which IN induces PAH, we focused on the raw material of IN, indigo leaves (IL). Only the condition of long-term chronic (6 months) and high-dose (containing 5% IL in the control diet) administration of IL induced medial thickening in the pulmonary arteries without right ventricular hypertrophy in our rat model. IL administration for a month did not induce pulmonary arterial remodeling but increased endothelin-1 (ET-1) expression levels within endothelial cell (EC) layers in the lungs. Gene Expression Omnibus analysis showed that ET-1 is a key regulator of PAH and that the IL component indican and its metabolite IS induced ET-1 mRNA expression via reactive oxygen species-dependent mechanism. We identified the roles of indican and IS in ET-1 expression in ECs, which were linked to pulmonary arterial remodeling in an animal model.
INTRODUCTION
Indigo naturalis (IN), derived from the leaves of indigo plants, is a traditional Chinese medicine historically used for its anti-inflammatory properties in the treatment of various diseases, including ulcerative colitis (UC).1,2) Its efficacy in UC has been demonstrated in randomized controlled trials.3) The improvement in UC is attributed to the indole compound indigo found in IN, which acts as an agonist of aryl hydrocarbon receptor (AhR) and exerts anti-inflammatory effects.1) A national survey in Japan conducted from 2017 to 2018 reported that 1.8% of UC patients used IN on their own.4) Concurrently, there have been several reported cases in which long-term IN use in UC patients was associated with the onset of pulmonary arterial hypertension (PAH).4,5) Although warnings regarding its use have been issued in Japan,6) the causative components of IN and the pathogenesis of IN-induced PAH remain unclear.
PAH is a progressive, complex, and intractable respiratory disease with a poor prognosis.7) It is characterized by an increase in pulmonary arterial pressure due to excessive vasoconstriction or abnormal vascular remodeling, leading to narrowing of the vascular lumen (medial thickening), which results in an increased load on the right ventricle (RV).8,9) These symptoms progressively worsen, reducing the QOL of the affected patients.
The vacuoles of indigo leaves (IL), which are the raw materials for IN, contain indoxyl-β-D-glucoside (indican), a colorless glycoside with an indole skeleton.10) In the body, indican is converted into various indole compounds that act as effective agents against UC. Some of these compounds are absorbed and undergo sulfation in the liver to form indoxyl sulfate (IS).11)
PAH patients have elevated plasma levels of endothelin-1 (ET-1) and increased expression of ET-1 in the lung tissues.12,13) The use of endothelin receptor antagonists, such as bosentan, in the treatment of PAH suggests that ET-1 plays a crucial role in the pathogenesis of PAH. ET-1 is a peptide hormone released from the vascular endothelium that causes vasoconstriction and is involved in medial thickening by promoting the proliferation of vascular smooth muscle cells (VSMCs).14) Although there are reports that IS enhances vascular constriction induced by ET-1 in rat aorta,15) there are no reports suggesting that IS or its precursors directly influence ET-1 expression.
Therefore, this study focused on the raw material of IN, IL, and evaluated the effects of the components of IL on the pulmonary arteries and the regulation of ET-1 expression by indican and its metabolite IS. These evaluations were conducted using animal models, human umbilical vein endothelial cells (HUVECs), and rat aortic SMCs (RASMCs) to investigate the underlying mechanisms.
MATERIALS AND METHODS
ChemicalsIndican (EI03317) was obtained from Biosynth Chemistry & Biology (Staad, Switzerland). IS potassium salt (I3875) was purchased from Sigma-Aldrich (St. Louis, MO, U.S.A.). An oral spherical activated carbon, AST-120 (Kremezin®) was purchased from Kureha Chemical (Tokyo, Japan). An AhR inhibitor, CH223191 (16154) was purchased from Cayman Chemical Co. (Ann Arbour, MI, U.S.A.). N-Acetyl-L-cysteine (NAC) (A0905) was obtained from Tokyo Chemical Industry Co. (Tokyo, Japan).
Animal ExperimentsIL (Persicaria tinctoria) were obtained from Bon-Arm. Co., Ltd. (Tokushima, Japan). All experimental procedures were performed in accordance with the guidelines of the Animal Research Committee of Tokushima University Graduate School and the protocol was approved by the Institutional Review Board of Tokushima University Graduate School (Permit Number: T2020-80). Wistar male rats (4-weeks-old) were purchased from Japan SLC, Inc. (Shizuoka, Japan). The animals were raised under controlled environmental conditions with 12 h light/dark cycles in a temperature-controlled room at 25 °C. The rats were randomly divided into the following groups: normal diet (control), IL, and IL plus AST-120 groups. The control group was fed a normal diet (CLEA Rodent Diet CE-2; Nippon CLEA, Tokyo, Japan), whereas the IL group was fed a normal diet containing 5% IL powder. The IL plus AST-120 group was fed with the diet used for IL group plus 5% AST-120. Water and food were provided ad libitum. After 1 or 6 months of feeding, blood samples were collected from the inferior vena cava under anesthesia with chloral hydrate (300 mg/kg), allowed to rest at room temperature, and centrifuged at 10000 × g for 15 min to collect serum samples, which were frozen at −80 °C for later analysis. After euthanasia using a large dose of chloral hydrate, organs (lungs and hearts) were harvested after refluxing with normal saline for further investigation.
Morphological AnalysisThe heart and lungs were perfused with 0.9% normal saline. The lungs were fixed in 10% formalin at 4 °C for 72 h and embedded in paraffin. Paraffin-embedded lung sections were subjected to hematoxylin–eosin (H&E) staining and photographed under a microscope (BZ-9000; Keyence, Osaka, Japan). Morphological analysis of the pulmonary arteries (inner diameter: <100 µm) was performed at 200× magnification. The medial wall thickness of the pulmonary arteries was calculated using the following formula: medial wall thickness (µm) = (outer diameter − inner diameter)/2 or the ratio of medial wall thickness to outer diameter. For quantitative analysis, 20–35 randomly selected vessels from each sample were analyzed, and the mean value was calculated for each sample. To assess right ventricular hypertrophy, the free walls of the RV and left ventricle plus the septum (LV + S) were dissected and weighed, and the Fulton index was calculated using the formula: RV/(LV + S). Measurements were performed using ImageJ 1.52a software (National Institute of Health, Bethesda, MD, U.S.A.).
Immunofluorescence StainingLung tissue samples were fixed in 10% formalin for 16 h, followed by three overnight incubations in 30% sucrose and were embedded in optimal cutting temperature compound (4583; Sakura Finetek, Japan Co., Ltd., Tokyo, Japan). Transverse sections (8 µm thickness) were cut with a cryostat, placed on glass slides for immunohistochemistry, and stored at −80 °C. The sections were fixed with acetone and permeabilized with 0.1% Triton X-100. After blocking the samples with 10% goat serum, anti-ET-1 antibody (1 : 500, PA3-067; Invitrogen, CA, U.S.A.), anti-CD31 antibody (1 : 200, 550274, or 550300; BD Biosciences, Franklin Lakes, NJ, U.S.A.), and Hoechst 33342 solution (1 : 2000; Dojindo, Kumamoto, Japan) were used for immunohistochemistry. Each primary antibody detection was performed using Alexa Fluor 488 goat anti-mouse (1 : 2000, ab150113; Abcam, Cambridgeshire, U.K.), Alexa Fluor 568 goat anti-rabbit (1 : 2000, ab175471; Abcam), Alexa Fluor 488 goat anti-rat (1 : 2000, ab150157; Abcam), Alexa Fluor 568 goat anti-rabbit (1 : 2000, A11036; Invitrogen), or Alexa Fluor 568 goat anti-mouse secondary antibodies (1 : 2000, ab175473; Abcam). Tissue imaging was performed using a confocal laser microscope (A1R; Nikon, Tokyo, Japan). Although we used two anti-CD31 antibodies (550274 and 550300; BD Biosciences) for EC layer detection, we confirmed that the staining pattern was almost the same when these two antibodies were used, as shown in Supplementary Fig. 1. The mean intensity of ET-1 staining within the EC layers (CD31 positive area) was measured using ImageJ 1.52a software (National Institute of Health).
HPLC AnalysisThe HPLC system consisted of an LC-10AD intelligent HPLC Pump (Shimadzu, Kyoto, Japan), an RF-10A fluorescence detector (Shimadzu), and a CTO-10AC column oven (Shimadzu). A 20-µL sample was injected into the column. Separation was carried out on a TSKgel ODS-80Ts column (C18, 4.6 × 15 cm, 5 µm; Tosoh, Tokyo, Japan) at 40 °C. The mobile phase consisted of 0.2% 2,2,2-trifluoroacetic acid (TFA) in water and acetonitrile (95 : 5, v/v) and was delivered at a flow rate of 1.0 mL/min. The excitation and emission wavelengths were 290 and 400 nm, respectively. Data obtained from the measuring instruments were converted to a digital format using a PicoLog ADC-20 data logger (Pico Technology Ltd., England, U.K.). The digital data were imported into Microsoft Excel for further analysis and evaluation.
Measurement of Serum ISSerum IS levells were determined using HPLC, based on previously reported techniques.16) Indican and IS were weighed and dissolved in methanol to obtain standard solutions. Sixty microliters of serum were deproteinized with 180 µL of methanol, and the supernatant was obtained after centrifugation at 15000 rpm for 15 min. The supernatant was filtered through a 0.22-µm membrane filter and analyzed using HPLC. Serum concentrations were measured from the obtained peak areas and calibration curves were generated using standard IS solutions.
Indican/IS Binding Assay to AST-120The binding affinity between indican or IS and AST-120 was measured using HPLC. IS and indican were used as the measurement samples. Each sample was dissolved in 0.05 M phosphate buffer (pH 7.4) to a concentration of 10 mg/dL. AST120 (500 mg) was added to 50 mL of sample solution and the mixture was shaken at 37 °C for 3 h. After filtering the solution through a 0.45-µm membrane filter, IS or indican remaining in the solution was analyzed using HPLC.
Gene Expression Omnibus (GEO) Database AnalysisWe used Genevestigator software (https://genevestigator.com/, version: 9.5.0, Release Date: 2022-10-06) to analyze the data retrieved from the GEO database (https://www.ncbi.nlm.nih.gov/geo/), that is, datasets GSE117261 and GSE16624. Changes in gene expression in each dataset were calculated using by “Differential Expression” analysis and the false discovery rate (FDR), p-value, and log2FC for each gene were obtained. Genes were defined as significantly upregulated based on FDR < 0.1, p < 0.05, and log2FC > 0.6. Official human gene symbols were converted to official rat gene symbols using GeneCardsSuite (https://www.genecards.org) website.
Cell CultureHUVECs (C2517A) were purchased from Lonza (Basel, Switzerland) and cultured in EBM™-2 endothelial cell basal medium (CC-3156; Lonza, Basel, Switzerland) supplemented with EGM™-2eEndothelial cell growth medium-2 singleQuots™ supplements and growth factors (CC-4176; Lonza). RASMCs were purchased from Lonza and cultured in Dulbecco’s modified Eagle’s medium/F12 (048-29785; FUJIFILM Wako, Osaka, Japan) supplemented with 10% fetal bovine serum (FBS) (S1810-500; BioWest, Nuaillé, France), 30 µg/mL gentamicin sulfate (071-06453; FUJIFILM Wako), and 15 ng/mL amphotericin B (017-27971; FUJIFILM Wako). All the cells were cultured in 5% CO2 and 95% room air (21% O2) at 37 °C.
Quantitative Real-Time PCRThe cells were seeded in 6-well plates at a concentration of 0.6 × 10⁵ cells/well three days before stimulation. The medium was replaced 28 h before the stimulation, and the AhR inhibitor, CH223191 (10 µM), or NAC (10 µM) was added 1 h before the stimulation of indican or IS for 12 h. Total RNA was extracted from cells or lung tissues according to the modified acid guanidinium-phenol-chloroform method using RNAiso Plus (9109; TaKaRa Bio, Kusatsu, Shiga, Japan) according to the manufacturer’s instructions. Total RNA (1000 ng) was used for cDNA synthesis using ReverTra Ace qPCR RT Master Mix (FSQ-301; TOYOBO, Osaka, Japan) according to the manufacturer’s instructions. The PCR mixture contained cDNA (equivalent to 33 ng of total RNA), forward and reverse primers, and THUNDERBIRD SYBER qPCR Mix (QPS-201; TOYOBO). Quantitative PCR was performed in an Applied Biosystems 7500 (Applied Biosystems, Foster City, CA, U.S.A.) under the following conditions: 1 min at 95 °C and 45 cycles of 10 s at 95 °C and 40 s at 60 °C. β-Actin gene expression was used to normalize sample amplification. The primers used in this study are listed in Tables 1 and 2.
Table 1. Human Oligonucleotide Primers Used in Quantitative Real-Time PCR
| Human | Forward | Reverse |
|---|
| ET-1 | 5′- CAGGGCTGAAGACATTATGGAGA-3′ | 5′-CATGGTCTCCGACCTGGTTT-3′ |
| ETB | 5′-GCTTGCTTCATCCCGTTCAGA-3′ | 5′-CTTCCCGTCTCTGCTTTAGGTG-3′ |
| CYP1A1 | 5′-TCGGCCACGGAGTTTCTTC-3′ | 5′-GGTCAGCATGTGCCCAATCA-3′ |
| β-Actin | 5′-GCGGGAAATCGTGCGTGACATTA-3′ | 5′-ATGGAGTTGAAGGTAGTTTCGTG-3′ |
Table 2. Rat Oligonucleotide Primers Used in Quantitative Real-Time PCR
| Rat | Forward | Reverse |
|---|
| ET-1 | 5′-GTTTTGCATTGAGTTCCATTTGC-3′ | 5′-GAAAGCCACAAACAGCAGAGAGA-3′ |
| ETA | 5′-ATCGGGATCCCCTTGATTAC-3′ | 5′-CCAGTCCTTCACGTCTTGGT-3′ |
| ETB | 5′-CGATTGTATCATGCCTCGT-3′ | 5′-GGGACCATTTCTCATGCACT-3′ |
| Cyp1a1 | 5′-ATGAGTTTGGGGAGGTTACTGGT-3′ | 5′-ACTTCTTATTCAAGTCCTTGAAGGCA-3′ |
| Nt5e | 5′-GGCTATCTGAAGGTTGAGT-3′ | 5′-CCGAGTTCCTGTGTAGAATA-3′ |
| Rgs1 | 5′-AACTCCTTGCCAACCAGATG-3′ | 5′-TGTGGGAGTTGGTGTTTTGA-3′ |
| Thy1 | 5′-AGCTATTGGCACCATGAACC-3′ | 5′-GCTGATCACCCTCTGTCCTC-3′ |
| Aspn | 5′-TGTCCAACAGTGCCAAAGATG-3′ | 5′-CCAACAACGCAGCGAAAC-3′ |
| Cpa3 | 5′-TGCACCAGAGTCCGAGAAAG-3′ | 5′-TCGGTGGCAGTTTGATTGTG-3′ |
| Cpe | 5′-CTCCTGGTCATCGAGCTGTCT-3′ | 5′-TCGTGTGCTGTGGATCAGGTT-3′ |
| Frzb | 5′-ATTTGGCTCGCTGTATTGAC-3′ | 5′-GTGCACATTTCACTGTCCTG-3′ |
| Gem | 5′-TAGTGCGGTGTCGAGAAGTG -3′ | 5′-GACAGGTCATGGCAGGATTT-3′ |
| Ltbp2 | 5′-GCTACACTTGTGACTGCTT-3′ | 5′-GCGATAGGAACCCTCTGT-3′ |
| β-Actin | 5′-GGAGATTACTGCCCTGGCTCCTA-3′ | 5′-GACTCATCGTACTCCTGCTTGCTG-3′ |
RASMCs were seeded in 24-well plates at a concentration of 1 × 10⁴ cells/well two days before the stimulation. One day before the stimulation, the medium was changed to 1% FBS-containing medium and the cells were stimulated with indican or IS (25, 100, and 250 µM). After stimulation for 24 h, MTT reagent (349–01824; Dojindo) dissolved in phosphate buffered saline (PBS) was added (0.5 mg/mL final), and the cells were incubated for 3 h. After incubation, the medium was removed and dimethyl sulfoxide was added to dissolve the formazan crystals. To evaluate cell proliferation, absorbance was measured at 538 nm.
Measurement of Intracellular Reactive Oxygen Species (ROS) LevelIntracellular ROS were detected using dichlorofluorescein diacetate (DCFH-DA, D6883; Sigma-Aldrich). HUVECs were incubated with DCFH-DA (10 µM) for 30 min at 37 °C and then washed and stimulated with indican (100 µM), IS (100 µM), or H2O2 (400 µM) for 30 min. NAC (10 µM) was added 1 h before the stimulation. ROS production was quantified at excitation/emission wavelength of 488/532 nm using a microplate reader (Infinite F200; Tecan Austria GmbH, Austria).
Statistical AnalysisData are presented as mean ± standard error of the mean (S.E.M.). Unpaired t-test was used for comparison between two groups. For multiple group comparisons, Dunnett’s test or one-way ANOVA followed by Tukey’s test was used to assess statistical significance. p-value < 0.05 was defined as indicating statistical significance. Detailed statistical analysis methods are described along with each method in this section and the figure legends.
RESULTS
Only the Condition of Long-Term Chronic and High-Dose Administration of IL Induced Medial Thickening in Pulmonary Arteries without Right Ventricular Hypertrophy in RatsSignificant medial thickening in the pulmonary arteries was induced in rats fed a diet containing 5% IL for 6 months compared with the normal diet, and AST-120 administration completely suppressed this effect (Figs. 1A–C). IL and AST-120 administration did not affect body weight during the experimental period (Fig. 1D). The food intake did not differ between the IL and control groups (data not shown). Medial thickening of the pulmonary arteries is a major morphological change in PAH patients, but IL administration did not affect right ventricular weight (Fig. 1E). Pulmonary arterial remodeling was not observed in rats fed a diet containing 5% IL for a month, which was shorter than 6 months (Fig. 2). These results suggested that long-term chronic and high-dose administration of IL induces medial thickening of the pulmonary arteries as an initial step in PAH in rats.
Serum IS Levels Were Increased in IL-Administered Rats, and This Effect Was Suppressed by AST-120Serum IS levels were higher in IL-administered rats than in control rats, and AST-120 administration decreased this effect (Figs. 3A, B). Serum indican levels were below the detection limit of our HPLC method (data not shown); however, we succeeded in detecting indican in IL (Supplementary Fig. 2). A previous report showed that oral administration of indican increased serum indican levels but suggested that indican rapidly transformed into IS in rats.11) IL contain various IS precursors (indole analogs), with indican as the major component of them.10) They can be absorbed from the surface of the intestinal epithelium into the circulating blood and converted into the final product, IS, in the liver.11) In our in vitro experiments, indican and IS dissolved in phosphate buffer were eliminated after 3 h of incubation with AST-120 (Fig. 3C). AST-120 is activated charcoal and is not absorbed into the circulating blood; therefore, these results and the reports strengthened the idea that the IL-derived IS precursor, indican, was absorbed into the rat body in the IL without AST-120 group, suggesting that it could bind to AST-120 and be trapped by AST-120 on the surface of the intestinal epithelium in the IL with AST-120 group.
SMC Proliferation Was Induced by IS but Not IndicanNext, we examined the direct effects of indican or IS on SMC proliferation, which leads to medial thickening. Indican did not induce SMC proliferation, whereas IS induced it through AhR-independent mechanisms (Figs. 4A, B). The mRNA expression of the target gene of AhR, Cyp1a1 was induced by indican, and this induction was suppressed by the AhR inhibitor, CH223191 (Fig. 4C). Although IS, a major AhR agonist, also induced Cyp1a1 mRNA expression, it was not statistically significant among multiple comparisons (Fig. 4C). These results indicated that only IS directly induced SMC proliferation.
GEO Analysis Revealed That ET-1 Is a Key Regulator of PAH in Both Patients and a Rat ModelTo determine the types of key PAH-related regulators that were altered in the lungs of IL-administered rats, we first analyzed GEO datasets from PAH patient samples or rat lung samples in a rat PAH model. In APAH (associated pulmonary arterial hypertension) and IPAH (idiopathic pulmonary arterial hypertension) patients, 163 and 131 genes, respectively, were upregulated in the lung tissue (#GSE117261).17) In the lungs of the rat PAH model (#GSE16624), 444 genes were upregualted.18) The ten genes indicated in Table 3 were common among these genes (Fig. 5A). Thus, our GEO analysis indicated that these 10 genes were key regulators of PAH in both patients and rats. We checked the mRNA expression levels of these 10 genes in the lungs of control and IL-administered rats and found that only ET-1 (Edn1) mRNA expression levels normalized to CD31 mRNA expression were induced according to the unpaired t-test (Fig. 5B). These results suggested that EC-derived ET-1 mRNA expression is a key regulator of PAH and that its expression, mainly in ECs, was induced in the lungs by IL administration for 6 months in our rat model.
Table 3. The 10 Genes Which Were Common among the Up-Regulated Genes in APAH Patients (GSE117261), in IPAH Patients (GSE117261) and in the PAH Rat Model (GSE16624)
| Gene symbol (rat) | Description |
|---|
| Edn1 | Endothelin 1 |
| Nt5e | 5′ Nucleotidase, ecto |
| Rgs1 | Regulator of G-protein signaling 1 |
| Thy1 | Thy-1 cell surface antigen |
| Aspn | Asporin |
| Cpa3 | Carboxypeptidase A3 |
| Cpe | Carboxypeptidase E |
| Frzb | Frizzled-related protein |
| Gem | GTP binding protein overexpressed in skeletal muscle |
| Ltbp2 | Latent transforming growth factor beta binding protein 2 |
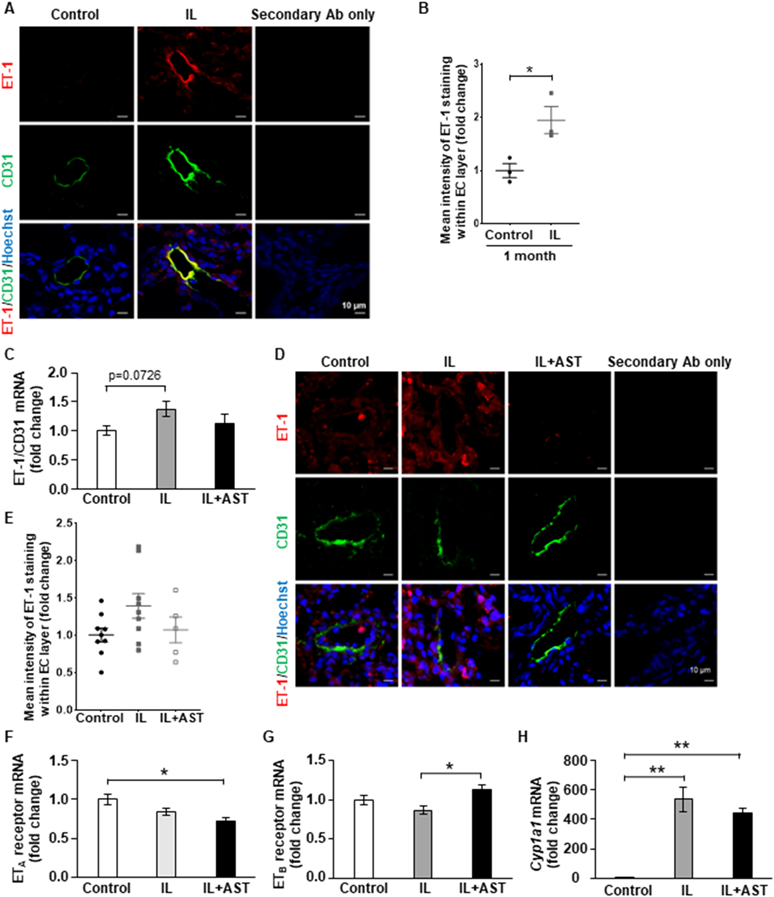
As shown in Fig. 5, ET-1 receptor antagonists are widely used clinically for PAH therapy and EC-derived ET-1 is a crucial regulator of PAH development and progression. Immunofluorescence analysis showed that ET-1 protein expression level within CD31 positive area (EC layer) in the pulmonary arteries was significantly induced by IL administration for a month (Figs. 6A, B), even though medial thickening was not observed (Fig. 2). After IL administration for 6 months, significant medial thickening was observed, and ET-1 mRNA expression levels normalized to CD31 (ET-1/CD31) mRNA expression were significantly induced compared with the control group, according to the unpaired t-test for two-group comparisons (Fig. 5B). According to one-way ANOVA followed by Tukey’s test for multiple group comparisons, we observed that IL administration for 6 months tended to induce ET-1/CD31 mRNA expression (p = 0.0726) (Fig. 6C). Although we usually normalize mRNA expression levels by β-actin mRNA level as described in Materials and Methods, to investigate EC-derived mRNA expression levels in lung tissues, we normalized ET-1 mRNA level by CD31 mRNA level. As shown in Supplementary Fig. 3, there was no significance in CD31 mRNA expression level in lung samples among the three groups in our rat model. Our immunofluorescence analysis showed a similar result, but this was not statistically significant after 6 months of IL administration (Figs. 6D, E). The mRNA expression levels of two ET-1 receptors, ETA and ETB, were not altered by IL administration for 6 months (Figs. 6F, G). This result was consistent with the fact that neither indican nor IS affected the mRNA expression levels of these receptors in SMCs (Supplementary Fig. 4). Cyp1a1 mRNA expression in the lungs was induced by IL administration (Fig. 6H), suggesting that IL-derived indole analogs, such as indican and IS, were absorbed into the circulating blood and affected the pulmonary arteries. AST-120, however, could not suppress this effect, suggesting that AST-120 could not trap some IL-derived AhR activators (except indican or IS) which did not affect medial thickening. These results suggested that EC-derived ET-1 induction by IL-derived components in the early phase plays a key role in medial thickening.
Both Indican and IS Induced ET-1 Expression via ROS Production in ECsFinally, we investigated how IL-derived indican or IS contributed to ET-1 induction in ECs. Both indican and IS induced ET-1 mRNA expression in HUVECs, but CH223191 did not suppress this effect (Fig. 7A). While the ETA receptor was hardly expressed in ECs, ETB receptor mRNA expression was induced by indican and IS, and CH223191 did not suppress this effect (Fig. 7B). CYP1A1 mRNA expression was induced by indican and its effect was clearly suppressed by CH223191 (Fig. 7C). IS induced CYP1A1 mRNA expression and CH223191 suppressed this effect (Fig. 7C). These results suggested that indican and IS induced ET-1 mRNA expression via an AhR-independent pathway. Although some reports have shown that hypoxia-inducible factor-1α (HIF-1α) regulates ET-1 expression,19) we found that indican and IS did not induce HIF-1α protein expression (Supplementary Fig. 5). This result is consistent with another report showing that IS does not induce HIF-1α expression but suppresses hypoxia-induced HIF-1α elevation.20) Next, we focused on the effects of ROS production. Indican, IS, and hydrogen peroxide (positive control) induced ROS production, but a ROS inhibitor, NAC, completely suppressed those effects in HUVECs (Fig. 7D). NAC suppressed indican- and IS-induced ET-1 mRNA expression (Fig. 7E). These results suggested that both indican and IS induced ET-1 expression via ROS production in ECs. To the best of our knowledge, this is the first study to show that indican induces ET-1 expression via ROS production in ECs and contributes to pulmonary arterial remodeling.
DISCUSSION
In this study, we focused on the raw material of IN, IL, to investigate the pathogenesis of IN-induced PAH. However, only long-term chronic (6 months) and high-dose (containing 5% IL in the control diet) administration of IL induced medial thickening in the pulmonary arteries without right ventricular hypertrophy in our rat model. Furthermore, despite using a higher dose for IL administration in our rat model than the dose (containing 1% IL in the control diet) used in a study by Tsuji et al.,21) we did not observe pulmonary arterial remodeling after IL administration for a month. We hypothesized that the components of IL have a weak ability to induce PAH and that other components of IN may play key roles in PAH development. For example, Masaki et al. reported that indirubin, which is also present in IN, induces PAH via AhR activation.22) However, we found that high-dose and chronic administration of IL induced medial thickening in the pulmonary arteries after EC-derived ET-1 induction. EC-derived ET-1 induction causes SMC migration and proliferation which links to medial thickening.23) But it should take time for such morphological change formation, we supposed that ET-1 induction in early phase was very important.
ET-1 is a key regulator of PAH, and our bioinformatic analysis identified it as a key regulator of PAH in both patients and rats. Therefore, IL administration-induced ET-1 expression in ECs, followed by medial thickening of the pulmonary arteries, was a reasonable cause of pulmonary arterial remodeling. We also elucidated that a major IL component indican and its final metabolite IS induced ET-1 expression via AhR independent and HIF-1α independent pathways but via ROS production in ECs. Several reports have shown that increased ROS levels contribute to ET-1 induction,24) which is consistent with our results. Furthermore, some papers have already shown that IS induces ROS production through reduced nicotinamide adenine dinucleotide phosphate (NADPH) oxidase activation.25,26) Unexpectedly, CH223191 increased mRNA expression levels of ET-1 and ETB receptors in ECs. We used 10 µM of CH223191 in our in vitro studies. This dose is often used in the most of papers27,28) and not too high. As shown in Fig. 7C, CH223191 certainly showed its effect in our in vitro studies, but we could not conclude whether CH223191 induced the mRNA expressions of ET-1 and ETB receptors through AhR-dependent or -independent manner. The roles of IL components, especially indican, in living systems remain unclear. To the best of our knowledge, this is the first study to elucidate the mechanisms by which indican contributes to ET-1 induction, which is linked to pulmonary arterial remodeling. The mRNA expression levels of the two receptors of ET-1, ETA and ETB, in the lungs were not changed by IL components or their metabolites in our rat model.
Although the serum indican levels in IL-administered rats were below the detection limit of our HPLC method, we successfully detected the indican present in IL. As indican is soluble in water, we hypothesized that it would be absorbed from the surface of the intestinal epithelium into the circulating blood in IL-administered rats and affect the pulmonary arteries. A previous report showed that oral administration of indican increased serum indican levels and that indican was transformed into IS in rats.11) We found that indican and IS were trapped by AST-120 and that AST-120 administration suppressed serum IS levels and medial thickening in the pulmonary arteries induced by IL administration in our rat model. Thus, our results showed that indican was absorbed into the circulating blood and reached the pulmonary arteries.
In conclusion, we elucidated the roles of a major IL component, indican, and its final metabolite, IS, in ET-1 expression in ECs and in pulmonary arterial remodeling. In addition, our in vitro study using a specific AhR-inhibitor29,30) showed that IS, but not indican, had the direct ability to induce SMC proliferation through AhR-independent mechanisms, although several papers have shown that AhR activation contributes to SMC proliferation.31,32) However, these effects were mild in our experiments, and it is expected that other IN components may play key roles in PAH development. Hiraide et al. reported that Qing-Dai (IN) induces PAH accompanied by right ventricular hypertrophy via an AhR-dependent pathway in a mouse model.33) Thus, we elucidated the unique ability of indican and IS to induce pulmonary arterial remodeling.
Acknowledgments
We appreciate the excellent technical support of the Support Center for Advanced Medical Sciences, Tokushima University Graduate School of Biomedical Sciences.
Funding
This work was partially supported by JSPS KAKENHI Grant Number: 22K20711 (to KT) and was also supported by JST SPRING, Grant Number: JPMJSP2113 (to HT).
Author Contributions
HT, MI, and YH performed bioinformatics analyses. HT, MI, YU, YH, MM, and AK performed experiments and analyzed data. M I-S, YH, and KT performed the histological analyses. LM, MF, YH, and YI contributed to the interpretation of the data and edited the manuscript. HT, MI, and KT interpreted the data and wrote the manuscript. KT planned and generated the study design and obtained funding.
Conflict of Interest
The authors declare no conflict of interest.
Supplementary Materials
This article contains supplementary materials.
REFERENCES
- 1) Kawai S, Iijima H, Shinzaki S, Hiyama S, Yamaguchi T, Araki M, Iwatani S, Shiraishi E, Mukai A, Inoue T, Hayashi Y, Tsujii M, Motooka D, Nakamura S, Iida T, Takehara T. Indigo naturalis ameliorates murine dextran sodium sulfate-induced colitis via aryl hydrocarbon receptor activation. J. Gastroenterol., 52, 904–919 (2017).
- 2) Zhang Q, Xie J, Li G, Wang F, Lin J, Yang M, Du A, Zhang D, Han L. Psoriasis treatment using indigo naturalis: progress and strategy. J. Ethnopharmacol., 297, 115522 (2022).
- 3) Naganuma M, Sugimoto S, Mitsuyama K, et al. Efficacy of indigo naturalis in a multicenter randomized controlled trial of patients with ulcerative colitis. Gastroenterology, 154, 935–947 (2018).
- 4) Naganuma M, Sugimoto S, Suzuki H, Matsuno Y, Araki T, Shimizu H, Hayashi R, Fukuda T, Nakamoto N, Iijima H, Nakamura S, Kataoka M, Tamura Y, Tatsumi K, Hibi T, Suzuki Y, Kanai T. Adverse events in patients with ulcerative colitis treated with indigo naturalis: a Japanese nationwide survey. J. Gastroenterol., 54, 891–896 (2019).
- 5) Nishio M, Hirooka K, Doi Y. Chinese herbal drug natural indigo may cause pulmonary artery hypertension. Eur. Heart J., 37, 1992 (2016).
- 6) Ministry of Health, Labour and Welfare. “Pharmaceutical and food safety bureau notification No. 1227-9, food safety and consumer affairs bureau notification No. 1227-8 (2016).”: ‹https://www.mhlw.go.jp/kinkyu/diet/dl/161227-01.pdf›, accessed 11 July, 2024.
- 7) Montani D, Günther S, Dorfmüller P, Perros F, Girerd B, Garcia G, Jaïs X, Savale L, Artaud-Macari E, Price LC, Humbert M, Simonneau G, Sitbon O. Pulmonary arterial hypertension. Orphanet J. Rare Dis., 8, 97 (2013).
- 8) Humbert M, Morrell NW, Archer SL, Stenmark KR, MacLean MR, Lang IM, Christman BW, Weir EK, Eickelberg O, Voelkel NF, Rabinovitch M. Cellular and molecular pathobiology of pulmonary arterial hypertension. J. Am. Coll. Cardiol., 43 (Suppl. S), 13S–24S (2004).
- 9) Farber HW, Loscalzo J. Pulmonary arterial hypertension. N. Engl. J. Med., 351, 1655–1665 (2004).
- 10) Minami Y, Nishimura O, Hara-Nishimura I, Nishimura M, Matsubara H. Tissue and intracellular localization of indican and the purification and characterization of indican synthase from indigo plants. Plant Cell Physiol., 41, 218–225 (2000).
- 11) Hou YC, Tsai SY, Chan SL, Yang SY, Chao PD. Indoxyl sulfate, a uremic toxin, is biotransformed from indoxyl-beta-D-glucoside (indican) in rats. Toxicon, 52, 440–444 (2008).
- 12) Giaid A, Yanagisawa M, Langleben D, Michel RP, Levy R, Shennib H, Kimura S, Masaki T, Duguid WP, Stewart DJ. Expression of endothelin-1 in the lungs of patients with pulmonary hypertension. N. Engl. J. Med., 328, 1732–1739 (1993).
- 13) Rubens C, Ewert R, Halank M, Wensel R, Orzechowski HD, Schultheiss HP, Hoeffken G. Big endothelin-1 and endothelin-1 plasma levels are correlated with the severity of primary pulmonary hypertension. Chest, 120, 1562–1569 (2001).
- 14) Jankowich M, Choudhary G. Endothelin-1 levels and cardiovascular events. Trends Cardiovasc. Med., 30, 1–8 (2020).
- 15) Matsumoto T, Takayanagi K, Kojima M, Taguchi K, Kobayashi T. Indoxyl sulfate enhances endothelin-1-induced contraction via impairment of NO/cGMP signaling in rat aorta. Pflugers Arch., 473, 1247–1259 (2021).
- 16) Al Za’abi M, Ali B, Al Toubi M. HPLC-fluorescence method for measurement of the uremic toxin indoxyl sulfate in plasma. J. Chromatogr. Sci., 51, 40–43 (2013).
- 17) Stearman RS, Bui QM, Speyer G, Handen A, Cornelius AR, Graham BB, Kim S, Mickler EA, Tuder RM, Chan SY, Geraci MW. Systems analysis of the human pulmonary arterial hypertension lung transcriptome. Am. J. Respir. Cell Mol. Biol., 60, 637–649 (2019).
- 18) Hoffmann J, Yin J, Kukucka M, Yin N, Saarikko I, Sterner-Kock A, Fujii H, Leong-Poi H, Kuppe H, Schermuly RT, Kuebler WM. Mast cells promote lung vascular remodelling in pulmonary hypertension. Eur. Respir. J., 37, 1400–1410 (2011).
- 19) Wang CC, Ying L, Barnes EA, Adams ES, Kim FY, Engel KW, Alvira CM, Cornfield DN. Pulmonary artery smooth muscle cell HIF-1α regulates endothelin expression via microRNA-543. Am. J. Physiol. Lung Cell. Mol. Physiol., 315, L422–L431 (2018).
- 20) Hung SC, Kuo KL, Huang HL, Lin CC, Tsai TH, Wang CH, Chen JW, Lin SJ, Huang PH, Tarng DC. Indoxyl sulfate suppresses endothelial progenitor cell-mediated neovascularization. Kidney Int., 89, 574–585 (2016).
- 21) Tsuji H, Kondo M, Odani W, Takino T, Takeda R, Sakai T. Treatment with indigo plant (Polygonum tinctorium Lour) improves serum lipid profiles in Wistar rats fed a high-fat diet. J. Med. Invest., 67, 158–162 (2020).
- 22) Masaki T, Okazawa M, Asano R, Inagaki T, Ishibashi T, Yamagishi A, Umeki-Mizushima S, Nishimura M, Manabe Y, Ishibashi-Ueda H, Shirai M, Tsuchimochi H, Pearson JT, Kumanogoh A, Sakata Y, Ogo T, Kishimoto T, Nakaoka Y. Aryl hydrocarbon receptor is essential for the pathogenesis of pulmonary arterial hypertension. Proceedings of the National Academy of Sciences of the United States of America, 118, e2023899118 (2021).
- 23) Shao D, Park JE, Wort SJ. The role of endothelin-1 in the pathogenesis of pulmonary arterial hypertension. Pharmacol. Res., 63, 504–511 (2011).
- 24) Cheng TH, Shih NL, Chen SY, Loh SH, Cheng PY, Tsai CS, Liu SH, Wang DL, Chen JJ. Reactive oxygen species mediate cyclic strain-induced endothelin-1 gene expression via Ras/Raf/extracellular signal-regulated kinase pathway in endothelial cells. J. Mol. Cell. Cardiol., 33, 1805–1814 (2001).
- 25) Dou L, Jourde-Chiche N, Faure V, Cerini C, Berland Y, Dignat-George F, Brunet P. The uremic solute indoxyl sulfate induces oxidative stress in endothelial cells. J. Thromb. Haemost., 5, 1302–1308 (2007).
- 26) Nakano T, Watanabe H, Imafuku T, Tokumaru K, Fujita I, Arimura N, Maeda H, Tanaka M, Matsushita K, Fukagawa M, Maruyama T. Indoxyl sulfate contributes to mTORC1-induced renal fibrosis via the OAT/NADPH Oxidase/ROS Pathway. Toxins (Basel), 13, 909 (2021).
- 27) Gramatzki D, Pantazis G, Schittenhelm J, Tabatabai G, Köhle C, Wick W, Schwarz M, Weller M, Tritschler I. Aryl hydrocarbon receptor inhibition downregulates the TGF-beta/Smad pathway in human glioblastoma cells. Oncogene, 28, 2593–2605 (2009).
- 28) Hao T, Zhang R, Zhao T, Wu J, Leung WK, Yang J, Sun W. Porphyromonas gingivalis infection promotes inflammation via inhibition of the AhR signalling pathway in periodontitis. Cell Prolif., 56, e13364 (2023).
- 29) Kim D, Shin DY, Liu J, Jeong NR, Koh Y, Hong J, Huang X, Broxmeyer HE, Yoon SS. Expansion of human megakaryocyte-lineage progeny via aryl hydrocarbon receptor antagonism with CH223191. Stem Cell Rev. Rep., 18, 2982–2994 (2022).
- 30) Zhao B, Degroot DE, Hayashi A, He G, Denison MS. CH223191 is a ligand-selective antagonist of the Ah (Dioxin) receptor. Toxicol. Sci., 117, 393–403 (2010).
- 31) Huang S, Chen P, Shui X, He Y, Wang H, Zheng J, Zhang L, Li J, Xue Y, Chen C, Lei W. Baicalin attenuates transforming growth factor-β1-induced human pulmonary artery smooth muscle cell proliferation and phenotypic switch by inhibiting hypoxia inducible factor-1α and aryl hydrocarbon receptor expression. J. Pharm. Pharmacol., 66, 1469–1477 (2014).
- 32) Ng HY, Bolati W, Lee CT, Chien YS, Yisireyili M, Saito S, Pei SN, Nishijima F, Niwa T. Indoxyl sulfate downregulates Mas receptor via aryl hydrocarbon receptor/nuclear factor-kappa B, and induces cell proliferation and tissue factor expression in vascular smooth muscle cells. Nephron J., 133, 205–212 (2016).
- 33) Hiraide T, Teratani T, Uemura S, Yoshimatsu Y, Naganuma M, Shinya Y, Momoi M, Kobayashi E, Hakamata Y, Fukuda K, Kanai T, Kataoka M. Pulmonary arterial hypertension caused by AhR signal activation protecting against colitis. Am. J. Respir. Crit. Care Med., 203, 385–388 (2021).