Abstract
The co-mitogenic effects of the α1-adrenoceptor agonist phenylephrine on S-allyl-L-cysteine (SAC)-induced hepatocyte proliferation were examined in primary cultures of adult rat hepatocytes. The combination of phenylephrine (10−10–10−6 M) and SAC (10−6 M) exhibited a significant dose-dependent increase in the number of hepatocyte nuclei and viable cells compared to SAC alone. This combination also increased the progression of hepatocyte nuclei into the S-phase. The potentiating effect of phenylephrine on SAC-induced cell proliferation was counteracted by prazosin (an α1-adrenergic receptor antagonist) and GF109203X (selective protein kinase C (PKC) inhibitor). In addition, PMA (direct PKC activator) potentiated the proliferative effects of SAC similarly to phenylephrine. In essence, these findings suggest that PKC activity plays a crucial role in enhancing SAC-induced cell proliferation. Moreover, the effects of phenylephrine on SAC-induced Ras activity, Raf phosphorylation, and extracellular signal-regulated kinase 2 (ERK2) phosphorylation were investigated. Phenylephrine (or PMA) in combination with SAC did not augment Ras activity, but further increased ERK2 phosphorylation and its upstream B-Raf phosphorylation. These results indicate that PKC activation, triggered by stimulating adrenergic α1 receptors, further amplifies SAC-induced cell proliferation through enhanced ERK2 phosphorylation via increased B-Raf-specific phosphorylation in primary cultured hepatocytes.
INTRODUCTION
The liver, recognized as a central metabolic organ, is believed to perform approximately 500 functions, including plasma protein synthesis, lipid synthesis, glycogenolysis, and detoxification. Liver regeneration is among the numerous functions attributed to the liver. The regenerative mechanisms of the liver are typically dormant, but they become activated by surgical resection or injury resulting from viral infection, initiating the proliferation of undamaged hepatocytes.1) Liver regeneration is fueled by diverse growth factors (i.e., direct mitogens), including epidermal growth factor (EGF), hepatocyte growth factor (HGF), and insulin-like growth factor type-I (IGF-I). In addition, regeneration-promoting factors induced by liver regeneration involve not only cytokines and growth factors, but also hormones such as adrenaline and glucagon.2) Adrenaline was found to act as a co-mitogen, unable to stimulate hepatocyte proliferation on its own.3)
In liver regeneration, α1- and β2-adrenergic receptors may play an important role in hepatocyte proliferation. Previous studies have shown increased plasma catecholamine levels and increased expressions of α1- and β2-adrenergic receptors in hepatocytes of partially hepatectomized rats, and antagonists of these receptors (e.g., prazosin or propranolol) have been shown to suppress DNA synthesis.4,5) It has been reported that α1-adrenergic receptors activated by norepinephrine (noradrenaline) suppress EGF receptor transamidation through interaction with transglutaminase 2, which upregulates EGF receptors and promotes the proliferation of perivenous hepatocytes.6,7) It has also been reported that primary rat hepatocytes isolated after partial hepatectomy increase DNA synthesis when treated with isoproterenol, a β-adrenergic receptor agonist, in combination with EGF or insulin, suggesting that not only α-adrenergic receptors, but also β-adrenergic receptors have a significant effect on promoting hepatocyte proliferation by co-mitogens in liver regeneration.3,6,8)
Moreover, we demonstrated that the α1-adrenergic agonist phenylephrine or the protein kinase C (PKC) activator 12-O-tetradcanoylphorbol-13-acetate (TPA), which had no proliferative effects alone, enhanced IGF-I-induced cell proliferation and DNA synthesis in cultured hepatocytes.9) However, which intracellular factors in the hepatocyte proliferation signal by IGF-I are targeted by PKCs activated by α1-adrenergic agonists remains unclear.
S-Allyl-L-cysteine (SAC) is a sulfur-containing amino acid whose content increases significantly during the ripening process of garlic. It is used as a health supplement due to its preventive effects against hypertension, hypercholesterolemia, and cancer, attributed to its antioxidant action.10–12) Previously, we demonstrated that SAC increases IGF-I gene expression in partially hepatectomized rats, thereby promoting hepatocyte DNA synthesis and facilitating the early recovery of liver function.13) Furthermore, we investigated the detailed intracellular signal transduction mechanism of SAC using primary cultures of adult rat hepatocytes. We demonstrated that SAC induced IGF-I secretion through the Janus kinase 2 (JAK2)/phospholipase C (PLC)/Ca2+ pathway in cultured hepatocytes.14) The IGF-I secreted by SAC promoted cell proliferation by activating the IGF-I receptor tyrosine kinase (RTK)/phosphoinositide 3-kinase (PI3K)/mitogen-activated protein kinase (MAPK)/extracellular signal-regulated kinase (ERK) kinase (MEK)/extracellular signal-related kinase 2 (ERK2)/mammalian target of rapamycin (mTOR) pathway.14,15)
In this study, the specific focus was on the α-adrenergic receptor signaling pathway, with the aim of investigating the co-mitogenic effects of an α-adrenergic agonist and intracellular signaling pathways of SAC-induced hepatocyte proliferation in primary cultures of adult rat hepatocytes. To achieve this, the number of nuclei in hepatocytes (as a cell proliferation index), the percentage of S-phase in the cell cycle, ERK2 and Raf phosphorylation activity, and Ras activity with the administration of the combination of SAC with phenylephrine or a PKC activator, along with specific signaling factor inhibitors, were measured. Based on the results obtained, the aim was to identify the interaction point (i.e., site of convergence) between the proliferation signaling pathway triggered by SAC and the α1-adrenergic signaling pathway.
MATERIALS AND METHODS
AnimalsMale Wistar rats (7–10 weeks old) were obtained from Sankyo Labo Service Corp. (Tokyo, Japan). During the pre-experimental acclimatization period of 5 d, the rats had unrestricted access to food and water. All rat handling procedures in this study followed the Guidelines for the Care and Use of Laboratory Animals of Josai University (No. JU 23028).
Isolation and Culture of HepatocytesHepatocytes were isolated and purified from rats through two-step in situ collagenase perfusion.16) In brief, under sodium pentobarbital anesthesia (45 mg/kg, intraperitoneally (i.p.)), portal vein cannulation was performed. The liver was then perfused with Ca2+-free Hanks buffer at 37 °C for 10 min. Subsequently, the perfusion buffer was switched to a solution containing 0.058 U/L collagenase Type II (Worthington Biochemical Corp., Freehold, NJ, U.S.A.) and 0.75 mg/mL CaCl2, and the liver was perfused for 11 min. The isolated hepatocytes were confirmed to exhibit more than 96% cell viability using trypan blue exclusion. Hepatocytes were cultured for 3 h in Williams’ medium E containing 0.1 nM dexamethasone and 5% newborn bovine serum. The seeding density was set at 3.3 × 10⁴ cells/cm2. Following a 3-h attachment period, the culture medium was replaced with a serum-free medium containing a variety of reagents. The hepatocytes were treated with SAC (Tokyo Chemical Industry Co., Tokyo, Japan), as well as inhibitors or activators of growth-related signal transduction factors. The growth-related signal transduction inhibitors, activators, or antagonists used included phenylephrine, prazosin (α1-adrenergic receptor antagonist),17) TG101209 (selective JAK2 inhibitor),18) U-73122 (selective PLC inhibitor),19) phorbol 12-myristate 13-acetate (PMA) (selective PKC activator),20) GF109203X (selective PKC inhibitor),21) AG538 (selective IGF-I receptor tyrosine kinase inhibitor),22) PD98059 (selective MEK inhibitor),23) and rapamycin (selective mTOR inhibitor),24) all obtained from Sigma-Aldrich Co. (St. Louis, MO, U.S.A.).
Hepatocyte Proliferation AssayThe α1-adrenergic agonist enhancing effect on the SAC-induced cell proliferation promoting effect was evaluated by measuring the numbers of hepatocyte nuclei and of viable hepatocytes. In addition, the number of hepatocytes was measured under a microscope.
Hepatocyte nuclear number was determined using a slightly modified version of Nakamura’s method.25) Briefly, hepatocyte nuclei were isolated using a solution of 0.1% Triton X-100 containing 0.1 M citric acid. These isolated nuclei were then stained with 0.3% trypan blue, and the resulting nuclei were counted using a hemocytometer.
The number of living hepatocytes was measured by a fluorescence method using Cell Counting Kit-F (Calcein-AM; Dojindo, Kumamoto, Japan). After washing the cultured hepatocytes with PBS, a 50-fold diluted Calcein-AM reagent was added and incubated for 30 min. Fluorescence intensity (excitation: 450 nm, emission: 535 nm) was then measured.
The total hepatocyte counts per 0.01 cm2 (i.e., ×102 cells/cm2) were determined from a phase-contrast microscopic image. Counts were obtained from cells in microscopic images captured at three different locations, and the average was considered as a single data point.
Detection of Cell Cycle Phases (S-Phase and G0/G1-Phase)To evaluate DNA synthesis, the S-phase in the cell cycle was determined using a Muse™ cell analyzer (Merck Millipore, Darmstadt, Germany).26) In this process, hepatocyte nuclei, isolated by the aforementioned method, were combined with 5% propidium iodide and incubated in the dark for 15 min. The Muse™ cell analyzer, functioning as a flow cytometer for cell analysis, was used to measure the cell cycle, including the S-phase. With this instrument, the cell cycle distribution of hepatocytes, encompassing the S-phase or G0/G1-phase, was quantified based on the analysis of propidium iodide-stained nuclei.
Measurement of Phosphorylated Raf, RKIP, and ERK1/2Phosphorylated forms of Raf (p68 A-Raf, p86 B-Raf, p74 C-Raf), p21 Raf kinase inhibitory protein (RKIP), and p44/42 ERK1/2 were assessed by Western blotting.27,28) Samples collected from hepatocytes using lysis buffer were combined with Laemmli sample buffer and subsequently subjected to separation through polyacrylamide gel electrophoresis. The separated samples were then transferred onto a polyvinylidene difluoride (PVDF) transfer membrane. The proteins transferred onto the membrane underwent immunoblotting using antibodies specific to the phosphorylated and total forms of A-Raf (S299), B-Raf (S445), C-Raf (S338), RKIP (S153), and ERK1/2. The phosphorylated ERK1/2 antibody was diluted 2000-fold, whereas all other primary antibodies were diluted 1000-fold. The membrane was incubated with the respective primary antibodies, followed by incubation with an HRP-labeled secondary antibody. Blot detection was performed using an ECL kit, and the emitted chemiluminescent signal was captured and quantified using a ChemiDoc Touch MP system from Bio-Rad Laboratories, Inc. To determine the ratios of phosphorylated Raf, RKIP, and ERK1/2 activity, the expression levels of each phosphorylated protein were divided by the total activity. Anti-RKIP antibody and anti-RKIP (Phospho-S153) antibody were obtained from Abcam, plc. (Cambridge, U.K.). All antibodies except RKIP, including secondary antibodies, lysis buffer, and the ECL kit, were obtained from Cell Signaling Technology, Inc. (Danvers, MA, U.S.A.). The PVDF membrane and Laemmli sample buffer were obtained from Bio-Rad Laboratories, Inc. (Hercules, CA, U.S.A.).
Measurement of Ras ActivityActivated Ras (GTP-bound form) was assessed using a 96-well Ras Activation enzyme-linked immunosorbent assay (ELISA) Kit (Cell Biolabs, Inc., San Diego, CA, U.S.A.). A total of 200 µL of lysis buffer were added to the cultured hepatocytes, followed by incubation on ice for 10 min. The collected samples were then centrifuged (c.f.g. 14000 × g, 10 min, at 4 °C). An aliquot of the supernatant fraction (50 µL) was quantified following the manufacturer’s assay procedure. The total protein of hepatocytes was quantified and normalized using the sodium dodecyl sulfate (SDS)-Lowry method.29)
Statistical AnalysisThe data are presented as mean ± standard error of the mean (S.E.M.) values from three distinct experiments. Dunnett’s test, with a significance level set at 5%, was used to evaluate the significance of the differences between the experimental groups and the control group.
RESULTS
Enhancement of SAC-Induced Hepatocyte Proliferation by Phenylephrine in Primary Cultures of Adult Rat HepatocytesTo investigate whether SAC-induced hepatocyte proliferation effects are enhanced by α-adrenergic activity, SAC was combined with phenylephrine, an α1-adrenergic agonist, and cell proliferation of cultured hepatocytes was measured. Figure 1 shows the phase-contrast microscope images of hepatocytes after 5 h of cultivation with SAC alone and with the combination of SAC (10−6 M) and phenylephrine (10−6 M) (Figs. 1A–D). Figure 1E also shows the number of hepatocytes observed in each visual field (×102 cells/cm2). A substantial increase in the number of hepatocytes was observed with SAC treatment compared to the control. However, treatment with phenylephrine alone did not alter the number of hepatocytes (Figs. 1A–C, E). In contrast, combined treatment with SAC and phenylephrine showed a trend toward a further increase in hepatocyte numbers compared with SAC alone (Figs. 1C–E).
Next, to quantitatively assess the enhancing effect of phenylephrine on SAC-induced cell proliferation, the number of nuclei in hepatocytes and the number of viable hepatocytes were measured. As depicted in Fig. 2A, a significant increase in the number of nuclei was observed with SAC alone (closed circle) compared to the control (medium alone: open circle). In contrast, in the SAC and phenylephrine combination group (closed triangle), phenylephrine further increased the number of nuclei depending on the dose, and phenylephrine 10−6 and 10−5 M showed a significant increase in the number of nuclei compared with SAC alone. On the other hand, with phenylephrine alone (open triangle), there was almost no increase in the number of nuclei (Fig. 2A). As shown in Fig. 2B, although the change in the number of viable hepatocytes was not as great as the change in the number of nuclei, a significant increase was observed in the SAC and phenylephrine combination group compared to SAC alone (Fig. 2B).
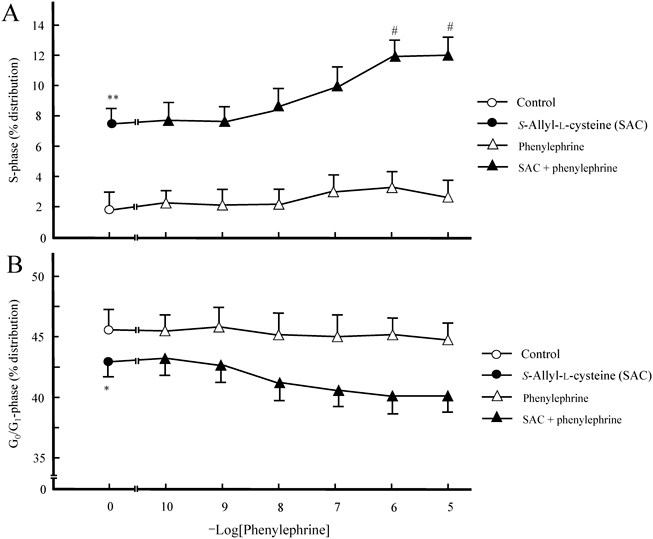
Effects of the SAC and Phenylephrine Combination on S- and G0/G1-Phase Progression in Cultured HepatocytesTo explore the potential enhancement of DNA synthesis in cultured hepatocytes by the combination of SAC and phenylephrine, the S-phase in the cell cycle of hepatocytes subjected to stimulation with the SAC and phenylephrine combination was assessed. The culture time after drug stimulation was set to 3 h, a point at which the S-phase transition was the most evident. As shown in Fig. 3, the SAC and phenylephrine combination significantly increased the progression of hepatocyte nuclei in the S-phase, compared with the effect induced by SAC alone. This enhancement was dependent on the phenylephrine dose (Fig. 3A). In addition, the percentage of hepatocyte nuclei in the G0/G1-phase exhibited a decreasing trend in the SAC and phenylephrine combination group, depending on the phenylephrine dose (Fig. 3B). In contrast, phenylephrine alone had no effect on S- and G0/G1-phase progression.
Effects of Specific Inhibitors of Signal Transducers on the Enhancement of SAC-Induced Hepatocyte Proliferation by Phenylephrine and PMANext, to investigate the signaling factors implicated in the enhancing effect of phenylephrine on the SAC-induced hepatocyte proliferation, various specific inhibitors of signal transducers were used to assess the SAC-induced hepatocyte proliferation (measured as the number of hepatocyte nuclei) and DNA synthesis (measured as a percentage in the S-phase of the cell cycle) in combination with phenylephrine or the direct protein kinase C activator PMA. In Fig. 4, the hepatocyte proliferation and DNA synthesis induced by SAC were markedly inhibited to levels comparable to the control group by the following inhibitors: U-73122, TG101209, AG538, PD98059, and rapamycin. In contrast, prazosin or GF109203X had no effect, whereas the enhancement of SAC-induced hepatocyte proliferation and DNA synthesis by phenylephrine was significantly inhibited by prazosin and GF109203X, reducing the effects to the level observed with SAC alone. TG101209, U-73122, AG538, PD98059, and rapamycin not only suppressed the enhancing effects of phenylephrine, but also inhibited hepatocyte proliferation and DNA synthesis induced by SAC. Interestingly, PMA also further increased the SAC-induced hepatocyte proliferation and DNA synthesis, similar to phenylephrine. These potentiating effects of PMA were not suppressed by prazosin. The effects of other inhibitors on PMA showed results similar to phenylephrine (Figs. 4A, B).
Time Course of SAC-Induced ERK2 Phosphorylation in the Presence of Phenylephrine in Cultured HepatocytesThe patterns of SAC-induced ERK1/2 phosphorylation in the presence of phenylephrine were measured by Western blot analysis. As shown in Fig. 5, the phosphorylation pattern of SAC (10−6 M) alone showed that ERK2 (but not ERK1) was phosphorylated immediately after stimulation, with the maximum phosphorylation observed 30 min after SAC stimulation. In contrast, phenylephrine (10−6 M) alone did not induce phosphorylation. However, in the SAC (10−6 M) and phenylephrine (10−6 M) combination group, an additional enhancement of ERK2 phosphorylation was observed compared with SAC alone. The maximum ERK2 phosphorylation response in the SAC and phenylephrine combination group occurred 30 min after drug stimulation, and the phosphorylation was much greater than that of SAC alone (Fig. 5).
Effects of Specific Inhibitors of Signal Transducers on the Enhancement of SAC-Induced ERK2 Phosphorylation by Phenylephrine and PMANext, the enhancing effect of phenylephrine on SAC-induced ERK2 phosphorylation was investigated using inhibitors and activators. U-73122, TG101209, AG538, and PD98059 not only suppressed the enhancing effect of phenylephrine on SAC-induced ERK2 phosphorylation, but also suppressed the SAC-induced ERK2 phosphorylation. In contrast, prazosin only inhibited the potentiating effect of phenylephrine on the SAC-induced phosphorylation and had no effect on SAC-induced ERK2 phosphorylation by itself. However, rapamycin did not affect the phosphorylation pattern of either SAC alone or in combination with phenylephrine. PMA also exhibited an enhancing effect on SAC-induced ERK2 (but not ERK1) phosphorylation similar to phenylephrine. The effects of specific inhibitors were also comparable to those of phenylephrine, but prazosin did not suppress the enhancement effect of PMA on SAC-induced ERK2 phosphorylation (Fig. 6).
Effects on SAC-Induced Ras Activation in the Presence of Phenylephrine and PMA in Cultured HepatocytesBased on the above results, we hypothesized that activated PKC interacts with a factor upstream of ERK2, which is a signaling factor for SAC-induced cell proliferation (IGF-I RTK/Ras/Raf/MEK/ERK2/mTOR) in cultured hepatocytes.14,15) First, whether phenylephrine and PMA could further enhance SAC-induced Ras activity was examined. As shown in Fig. 7, Ras was significantly activated 15 min after SAC stimulation, but no additional enhancement of SAC-induced Ras activity was observed with the combination of phenylephrine or PMA (closed square).
Raf Isoforms and RKIP Phosphorylation in Combination with Phenylephrine and SAC and the Effect of GF109203X on the Induced B-Raf PhosphorylationNext, whether phenylephrine enhanced SAC-induced Raf (A-, B-, C-Raf) phosphorylation was examined. Phosphorylation of Raf was measured by Western blot analysis. As shown in Fig. 8, B-Raf exhibited significant changes in phosphorylation after stimulation with SAC (10−6 M) and phenylephrine. B-Raf phosphorylation was not increased by SAC alone or phenylephrine alone, but a significant increase was observed with the combination of SAC and phenylephrine. The peak response of B-Raf phosphorylation in conjunction with SAC and phenylephrine occurred 15 min after drug stimulation (Fig. 8A). In contrast, A-Raf and C-Raf phosphorylation did not show significant increases upon stimulation with SAC or phenylephrine (Fig. 8B).
Subsequently, to investigate whether PKC is involved in the interaction with B-Raf, B-Raf phosphorylation was measured using the direct PKC activator PMA and the specific inhibitor GF109203X. As shown in Fig. 8C, PMA also showed an enhancing effect on B-Raf phosphorylation similar to phenylephrine. In addition, GF109203X significantly inhibited increases in B-Raf phosphorylation induced by phenylephrine and PMA in combination with SAC (Fig. 8C).
Next, the effects of phenylephrine and PMA on RKIP phosphorylation were investigated in cultured hepatocytes. RKIP is a protein that regulates Raf.30) As shown in Fig. 8D, RKIP phosphorylation was promoted by phenylephrine and PMA, and the RKIP phosphorylation induced by them was significantly inhibited by GF102203X. However, no enhancement of RKIP phosphorylation was observed when used in combination with SAC (Fig. 8D).
DISCUSSION
As shown in Fig. 1, microscopic observation showed that phenylephrine further intensified the increase in the number of hepatocytes induced by SAC. Furthermore, as depicted in Figs. 2, 3, and 5, phenylephrine dose-dependently augmented SAC-induced hepatocyte nuclei, the number of viable hepatocytes, and DNA synthesis and enhanced SAC-induced ERK2 phosphorylation. In addition, phenylephrine alone did not cause hepatocyte proliferation and ERK2 phosphorylation. These results suggest that phenylephrine did not enhance the cell proliferative-promoting effect of SAC through an additive effect based on its cell proliferation. Instead, intracellular factors activated by phenylephrine (i.e., the α1-adrenergic receptor/Gq/PLC/diacylglycerol (DG) signaling pathway) appeared to enhance the crosstalk with the SAC-induced signaling pathway.
Subsequently, the effects of specific inhibitors of signaling factors on the SAC-induced hepatocyte proliferative-promotion in the presence of phenylephrine or PMA were examined. As shown in Figs. 4 and 6, the effects of inhibitors were categorized into two groups: one that suppressed cell proliferation and ERK2 phosphorylation to the control level, and another that reduced cell proliferation and ERK2 phosphorylation to the level of SAC alone. TG101209, a JAK2 inhibitor, and/or U-73122, a PLC inhibitor, are inhibitors that suppress factors involved in IGF-I secretion by SAC. Furthermore, AG538 and PD98059 are inhibitors that suppress factors involved in the IGF-I-induced cell proliferation signaling pathway (i.e., IGF-I RTK/MEK/ERK2/mTOR). These inhibitors not only suppressed the cell proliferative-enhancing effect of phenylephrine, but also the cell proliferation and ERK2 phosphorylation induced by SAC alone. In addition, mTOR, the target of rapamycin, has been shown to exist downstream of ERK2 in the SAC-mediated hepatocyte proliferation pathway.14) The cell proliferative-enhancing effect of phenylephrine has also been observed for IGF-I, HGF, and platelet-derived growth factor, and inhibition of the cell proliferation signal pathways of these growth factors suppressed cell proliferation to control levels.9,31–33) In other words, these results indicate that the enhancing effect of phenylephrine would not be exerted without the cell proliferation effects of SAC and IGF-I.
The PKC inhibitor GF109203X and the α1-adrenergic receptor antagonist prazosin only suppressed the enhancing effect of phenylephrine on the SAC-induced cell proliferation and ERK2 phosphorylation, and they did not affect the SAC-induced cell proliferation and ERK2 phosphorylation by themselves. Further, PMA, which competes with DG and directly activates PKC, exhibited a similar trend to the enhancing effect of phenylephrine on SAC-induced cell proliferation and ERK2 phosphorylation, whereas prazosin did not suppress the effect of PMA (Figs. 4, 6). These results indicate that PKC is dispensable for SAC-induced cell proliferation and ERK2 phosphorylation, but it is required for enhancement of the SAC-induced cell proliferation and ERK2 phosphorylation. PKC directly or indirectly stimulates DNA synthesis; furthermore, its effects differ depending on the cell line and animal species.9,34,35) In other words, in hepatocytes, phosphorylated PKC was shown to interact upstream with ERK2 in the SAC-induced cell proliferation pathway, thereby indirectly enhancing cell proliferation.
Next, we hypothesized that PKC interacts with Ras or Raf in the SAC-mediated cell proliferation pathway. As shown in Figs. 7 and 8, phenylephrine promoted phosphorylation of Raf, but not Ras, in the presence of SAC. Furthermore, PKC phosphorylated directly or indirectly by phenylephrine or PMA showed a specific interaction with B-Raf in the Raf isoform when used in combination with SAC. Raf is an effector of activated Ras (GTP-bound form), and the activation mechanism of C-Raf is the best understood of the three isoforms. The inactive form of C-Raf maintains binding to 14-3-3 proteins in the cytoplasm.36) The binding between the formed Ras-GTP and C-Raf leads to phosphorylation of tyrosine 341 and serine 338 in C-Raf, initiating downstream signaling to MEK.36,37) Serine 338 in C-Raf is a crucial point for activation, and B-Raf also has serine 445 located at the corresponding position.36) Serine 445 of B-Raf is constitutively phosphorylated and is not stimulated by oncogenic Ras. However, since inhibition of serine 445 phosphorylation profoundly affects cell proliferation, it has been suggested that serine 445 phosphorylation may increase the basal activity of B-Raf and enhance Ras-stimulated activity.38) In addition, full activation of B-Raf requires phosphorylation of both threonine 598 and serine 601 induced by Ras activation.39) B-Raf phosphorylation by SAC (IGF-I RTK stimulation by IGF-I secretion) alone may have occurred at both threonine 598 and serine 601, rather than serine 445. In other words, B-Raf bound to activated Ras to the plasma membrane induced by SAC induces phosphorylation of threonine 598 and serine 601, which then interact with constitutively phosphorylated serine 445, transmitting a signal to MEK/ERK2 (Fig. 9).
With regards to the relationship between PKC and B-Raf, studies have shown that B-Raf is activated and phosphorylates MEK-1 after PMA treatment in PC12 cells.40) RKIP is a protein that regulates Raf activity. RKIP suppresses not only C-Raf, but also B-Raf, and moreover, PKC has been demonstrated to derepress B-Raf activity through phosphorylation of RKIP.40,41) As shown in Fig. 8D, phenylephrine and PMA promoted phosphorylation of RKIP, and the phosphorylation induced by them was suppressed by GF109203X. PKC activated by phenylephrine or PMA may enhance the SAC-induced B-Raf activity through phosphorylation of RKIP in cultured hepatocytes. RKIP inhibits C-Raf activity by blocking serine 338 and tyrosine 341, which are important activation sites of C-Raf.36,42) Although the binding site of B-Raf and RKIP is not clear, RKIP may block B-Raf serine 445, which corresponds to C-Raf serine 338. PKC activated by phenylephrine or PMA stimulation releases the binding of B-Raf through phosphorylation of RKIP. It is inferred that this response does not promote B-Raf phosphorylation because it only releases the binding to RKIP. Presumably, B-Raf serine 445, which was freed from RKIP by PKC, was able to respond to Ras, and SAC stimulation may have further increased phosphorylation (Fig. 9).
In conclusion, Fig. 10 presents a schematic diagram of the mechanism of α1-adrenergic receptor agonist enhancement of SAC-induced hepatocyte proliferation. SAC results in the secretion of IGF-I through the JAK2/PLC/Ca2+ signaling pathway and promotes hepatocyte proliferation through the RTK/Ras/Raf/MEK/ERK2/mTOR pathway. The present study demonstrated that, of these pathways promoting SAC-induced cell proliferation, the α1-adrenergic receptor/Gq/PLC/DG/PKC pathway further enhances the SAC-induced cell proliferation by promoting phosphorylation specific to B-Raf and downstream ERK2 in primary cultures of adult rat hepatocytes.
Acknowledgments
Funding for this study was provided by a JSPS KAKENHI Grant (Number: 20K16011).
Conflict of Interest
The authors declare no conflict of interest.
REFERENCES
- 1) Fausto N, Campbell JS, Riehle KJ. Liver regeneration. Hepatology, 43 (Suppl. 1), S45–S53 (2006).
- 2) Michalopoulos GK, DeFrances MC. Liver regeneration. Science, 276, 60–66 (1997).
- 3) Kimura M, Moteki H, Ogihara M. Role of hepatocyte growth regulators in liver regeneration. Cells, 12, 2081 (2023).
- 4) Diehl AM, Rai RM. Liver regeneration 3: regulation of signal transduction during liver regeneration. FASEB J., 10, 215–227 (1996).
- 5) Cruise JL, Knechtle SJ, Bollinger RR, Kuhn C, Michalopoulos G. α 1-Adrenergic effects and liver regeneration. Hepatology, 7, 1189–1194 (1987).
- 6) Lelou E, Corlu A, Nesseler N, Rauch C, Mallédant Y, Seguin P, Aninat C. The role of catecholamines in pathophysiological liver processes. Cells, 11, 1021 (2022).
- 7) Ohtake Y, Kobayashi T, Maruko A, Oh-ishi N, Yamamoto F, Katoh S, Ohkubo Y. Norepinephrine modulates the zonally different hepatocyte proliferation through the regulation of transglutaminase activity. Am. J. Physiol. Gastrointest. Liver Physiol., 299, G106–G114 (2010).
- 8) Refsnes M, Thoresen H, Sandnes D, Dajani OF, Dajani L, Christoffersen T. Stimulatory and inhibitory effects of catecholamines on DNA synthesis in primary rat hepatocyte cultures: role of alpha 1- and beta-adrenergic mechanisms. J. Cell. Physiol., 151, 164–171 (1992).
- 9) Kimura M, Ogihara M. Effects of insulin-like growth factor I and II on DNA synthesis and proliferation in primary cultures of adult rat hepatocytes. Eur. J. Pharmacol., 354, 271–281 (1998).
- 10) Colín-González AL, Santana RA, Silva-Islas CA, Chánez-Cárdenas ME, Santamaría A, Maldonado PD. The antioxidant mechanisms underlying the aged garlic extract- and S-allylcysteine-induced protection. Oxid. Med. Cell. Longev., 2012, 907162 (2012).
- 11) Sohn CW, Kim H, You BR, Kim MJ, Kim HJ, Lee JY, Sok DE, Kim JH, Lee KJ, Kim MR. High temperature- and high pressure-processed garlic improves lipid profiles in rats fed high cholesterol diets. J. Med. Food, 15, 435–440 (2012).
- 12) Velmurugan B, Bhuvaneswari VNS, Nagini S. Effect of S-allylcysteine on oxidant-antioxidant status during N-methyl-N’-nitro-N-nitrosoguanidine and saturated sodium chloride-induced gastric carcinogenesis in Wistar rats. Asia Pac. J. Clin. Nutr., 12, 488–494 (2003).
- 13) Kurihara K, Moteki H, Natsume H, Ogihara M, Kimura M. The enhancing effects of S-allylcysteine on liver regeneration are associated with increased expression of mRNAs encoding IGF-1 and its receptor in two-thirds partially hepatectomized rats. Biol. Pharm. Bull., 43, 1776–1784 (2020).
- 14) Moteki H, Ogihara M, Kimura M. Cell proliferation effects of S-allyl-L-cysteine are associated with phosphorylation of Janus kinase 2, insulin-like growth factor type-I receptor tyrosine kinase, and extracellular signal-regulated kinase 2 in primary cultures of adult rat hepatocytes. Eur. J. Pharmacol., 927, 175067 (2022).
- 15) Moteki H, Ogihara M, Kimura M. S-Allyl-L-cysteine promotes cell proliferation by stimulating growth hormone receptor/Janus kinase 2/phospholipase C pathways and promoting insulin-like growth factor type-I secretion in primary cultures of adult rat hepatocytes. Biol. Pharm. Bull., 45, 625–634 (2022).
- 16) Seglen PO. Preparation of isolated rat liver cells. Methods Cell Biol., 13, 29–83 (1976).
- 17) Cruise JL, Houck KA, Michalopoulos GK. Induction of DNA synthesis in cultured rat hepatocytes through stimulation of α1 adrenoreceptor by norepinephrine. Science, 227, 749–751 (1985).
- 18) Pardanani A, Hood J, Lasho T, Levine RL, Martin MB, Noronha G, Finke C, Mak CC, Mesa R, Zhu H, Soll R, Gilliland DG, Tefferi A. TG101209, a small molecule JAK2-selective kinase inhibitor potently inhibits myeloproliferative disorder-associated JAK2V617F and MPLW515L/K mutations. Leukemia, 21, 1658–1668 (2007).
- 19) Thompson AK, Mostafapour SP, Denlinger LC, Bleasdale JE, Fisher SK. The aminosteroid U-73122 inhibits muscarinic receptor sequestration and phosphoinositide hydrolysis in SK-N-SH neuroblastoma cells: a role for Gp in receptor compartmentation. J. Biol. Chem., 266, 23856–23862 (1991).
- 20) Wen HC, Huo YN, Chou CM, Lee WS. PMA inhibits endothelial cell migration through activating the PKC-δ/Syk/NF-κB-mediated up-regulation of Thy-1. Sci. Rep., 8, 1–13 (2018).
- 21) Hauss P, Mazerolles F, Hivroz C, Lecomte O, Barbat C, Fischer A. GF109203X, a specific PKC inhibitor, abrogates anti-CD3 antibody-induced upregulation of CD4+ T cell adhesion to B cells. Cell. Immunol., 150, 439–446 (1993).
- 22) Blum G, Gazit A, Levitzki A. Development of new insulin-like growth factor-1 receptor kinase inhibitors using catechol mimics. J. Biol. Chem., 278, 40442–40454 (2003).
- 23) Li X, Huang Y, Jiang J, Frank SJ. ERK-dependent threonine phosphorylation of EGF receptor modulates receptor downregulation and signaling. Cell. Signal., 20, 2145–2155 (2008).
- 24) Dixon M, Agius L, Yeaman SJ, Day CP. Inhibition of rat hepatocyte proliferation by transforming growth factor β and glucagon is associated with inhibition of ERK2 and p70 S6 kinase. Hepatology, 29, 1418–1424 (1999).
- 25) Nakamura T, Tomita Y, Ichihara A. Density-dependent growth control of adult rat hepatocytes in primary culture. J. Biochem., 94, 1029–1035 (1983).
- 26) Kimura M, Moteki H, Ogihara M. Involvement of endogenous transforming growth factor-α in signal transduction pathway for interleukin-1β-induced hepatocyte proliferation. Eur. J. Pharmacol., 745, 223–233 (2014).
- 27) Kurihara K, Moteki H, Kimura M, Ogihara M. Autocrine secretion of insulin-like growth factor-I mediates growth hormone-stimulated DNA synthesis and proliferation in primary cultures of adult rat hepatocytes. Eur. J. Pharmacol., 891, 173753 (2021).
- 28) Towbin H, Staehelin T, Gordon J. Electrophoretic transfer of proteins from polyacrylamide gels to nitrocellulose sheets: procedure and some applications. Proc. Natl. Acad. Sci. U.S.A., 76, 4350–4354 (1979).
- 29) Lees MB, Paxman S. Modification of the Lowry procedure for the analysis of proteolipid protein. Anal. Biochem., 47, 184–192 (1972).
- 30) Corbit KC, Trakul N, Eves EM, Diaz B, Marshall M, Rosner MR. Activation of Raf-1 signaling by protein kinase C through a mechanism involving Raf kinase inhibitory protein. J. Biol. Chem., 278, 13061–13068 (2003).
- 31) Kimura M, Ogihara M. Proliferation of adult rat hepatocytes in primary cultures induced by platelet-derived growth factor is potentiated by phenylephrine. Jpn. J. Pharmacol., 76, 165–174 (1998).
- 32) Moteki H, Kimura M, Ogihara M. Activation of extracellular-signal regulated kinase by platelet-derived growth factor is potentiated by phenylephrine in primary cultures of adult rat hepatocytes. Biol. Pharm. Bull., 34, 980–986 (2011).
- 33) Kimura M, Ogihara M. Proliferation of adult rat hepatocytes by hepatocyte growth factor is potentiated by both phenylephrine and metaproterenol. J. Pharmacol. Exp. Ther., 282, 1146–1154 (1997).
- 34) Ginès P, Li X, Zamarripa JL, Brown SES, Wieder ED, Nakamura T, Guzelian PS, Schrier RW, Heasley LE, Nemenoff RA. Tyrosine kinase growth factor receptors but not seven-membrane-spanning receptors or phorbol esters activate mitogen-activated protein kinase in rat hepatocytes. Hepatology, 22, 1296–1303 (1995).
- 35) Obrien TG, Lewis MA, Diamond L. Ornithine decarboxylase activity and DNA synthesis after treatment of cells in culture with 12-O-tetradecanoylphorbo1-13-acetate. Cancer Res., 39, 4477–4480 (1979).
- 36) Mercer KE, Pritchard CA. Raf proteins and cancer: B-Raf is identified as a mutational target. Biochim. Biophys. Acta., 1653, 25–40 (2003).
- 37) Dhillon AS, Meikle S, Yazici Z, Eulitz M, Kolch W. Regulation of Raf-1 activation and signalling by dephosphorylation. EMBO J., 21, 64–71 (2002).
- 38) Mason CS, Springer CJ, Cooper RG, Superti-Furga G, Marshall CJ, Marais R. Serine and tyrosine phosphorylations cooperate in Raf-1, but not B-Raf activation. EMBO J., 18, 2137–2148 (1999).
- 39) Zhang BH, Guan KL. Activation of B-Raf kinase requires phosphorylation of the conserved residues Thr598 and Ser601. EMBO J., 19, 5429–5439 (2000).
- 40) Peraldi P, Frödin M, Barnier JV, Calleja V, Scimeca JC, Filloux C, Calothy G, Van Obberghen E. Regulation of the MAP kinase cascade in PC12 cells: B-Raf activates MEK-1 (MAP kinase or ERK kinase) and is inhibited by cAMP. FEBS Lett., 357, 290–296 (1995).
- 41) Park S, Yeung ML, Beach S, Shields JM, Yeung KC. RKIP downregulates B-Raf kinase activity in melanoma cancer cells. Oncogene, 24, 3535–3540 (2005).
- 42) Trakul N, Menard RE, Schade GR, Qian Z, Rosner MR. Raf kinase inhibitory protein regulates Raf-1 but not B-Raf kinase activation. J. Biol. Chem., 280, 24931–24940 (2005).