Abstract
This research intended to explore the role of glimepiride, a sulfonylurea-class medication, in regulating macrophage polarization and clarify its underlying molecular mechanism. In vitro experiments were performed using a lipopolysaccharide (LPS)-induced M1 polarization model in the murine macrophage cell line RAW264.7. Different concentrations (low, medium, and high) of glimepiride were applied to evaluate their effects on the expression of M1 macrophage-specific markers. Transcriptome sequencing was conducted to identify potential regulatory pathways. Small interfering RNA (siRNA) was used to silence target genes, aiming to verify the impacts on downstream signaling pathways and pro-inflammatory cytokine secretion. In vitro experiments revealed that glimepiride markedly suppressed LPS-induced M1 macrophage polarization and diminished the expression levels of M1-specific markers, encompassing cluster of differentiation 86 (CD86) and inducible nitric oxide synthase (iNOS). Transcriptomic profiling indicated that the peroxisome proliferator-activated receptor gamma (PPARγ) pathway was modulated by glimepiride. Functional verification via PPARγ siRNA knockdown revealed that glimepiride mediated its regulatory effects by suppressing the expression of phosphorylated inhibitor of nuclear factor kappa B (IκB)/p65, which in turn restrained M1 macrophage polarization and attenuated pro-inflammatory cytokine release. These findings demonstrate that glimepiride inhibits M1 macrophage polarization through a PPARγ-dependent blockade of the IκB–p65 signaling pathway. This study highlights a novel anti-inflammatory mechanism of glimepiride, providing preclinical evidence for its potential application in anti-inflammatory therapies.
INTRODUCTION
Glimepiride, a second-generation sulfonylurea derivative, has long been clinically utilized as a first-line oral hypoglycemic agent for the management of type 2 diabetes mellitus (T2DM).1) Its primary therapeutic mechanism relies on stimulating insulin secretion by binding to the sulfonylurea receptor 1 (SUR1) on pancreatic β-cells, thereby improving glycemic control.2) However, accumulating evidence over the past decade has uncovered pleiotropic effects of sulfonylurea agents beyond glucose regulation, including anti-inflammatory, antioxidant, and tissue-protective properties, which have extended their potential therapeutic implications to non-metabolic disorders.3,4) These off-target effects suggest that glimepiride may exert regulatory roles in immune homeostasis; this observation has attracted growing interest within the realm of inflammatory disorder studies.
Macrophages, as pivotal innate immune cells, exhibit remarkable phenotypic plasticity and functional heterogeneity, a characteristic known as macrophage polarization.5) Macrophages undergo polarization that is broadly classified into 2 distinct phenotypic states: classically activated (M1) and alternatively activated (M2) subsets. M1 macrophages, usually induced through lipopolysaccharide (LPS) and interferon-γ stimulation, secrete abundant pro-inflammatory cytokines encompassing tumor necrosis factor-α (TNF-α), interleukin-6 (IL-6), and interleukin-1β (IL-1β), and present surface markers such as cluster of differentiation 86 (CD86) and inducible nitric oxide synthase (iNOS). The M1 macrophage polarization plays a pivotal role in maintaining immunological system stability, and its disruption is closely involved in the pathogenesis of various diseases.
In T2DM, persistent hyperglycemia and metabolic stress drive excessive M1 macrophage polarization within insulin-responsive tissue compartments (including adipose depots, hepatic tissue, and skeletal muscle tissue), which amplifies local inflammatory responses and exacerbates insulin resistance.6,7) Advancements in periodontal medicine have revealed significant associations between periodontitis and various systemic conditions. A well-established bidirectional relationship exists with diabetes, wherein diabetes serves as a major risk factor for periodontitis, and conversely, chronic periodontal infection can compromise glycemic control. Supporting this, a recent meta-analysis found that individuals with diabetes are twice as likely to have periodontitis compared to those without the disease.8) Periodontitis is an infectious-inflammatory disorder marked by the gradual penetration of bacteria and inflammatory cytokines into periodontal tissues. This leads to loss of attachment, resorption of alveolar bone, and apical displacement of the junctional epithelium. While certain bacteria, such as Porphyromonas gingivalis (P. gingivalis) and its LPS, trigger the inflammatory process, the host immune response induced by these bacterial components plays a similarly critical role in driving periodontal destruction. Key mediators responsible for tissue breakdown include host-derived IL-1, IL-6, TNF-α, matrix metalloproteinases, and prostanoids.9) In P. gingivalis-induced periodontitis, M1 macrophages are characterized as the dominant phenotype within gingival infiltrates. Their activation by P. gingivalis leads to the robust production of inflammatory agents such as TNF-α, nitric oxide, and IL-12.10) Emerging preclinical studies have hinted at the regulatory role of glimepiride in macrophage function. For instance, a sulfonylurea derivative has been reported to alleviate LPS-induced inflammatory responses in macrophages,11) albeit the specific effects on polarization remain ambiguous. A recent study demonstrated that glimepiride could modulate macrophage phenotypes in a mouse model of atherosclerosis, but the underlying molecular mechanisms were not fully elucidated.12)
To address these knowledge gaps, the current investigation concentrated on investigating the regulatory effect of glimepiride on LPS from P. gingivalis (P.g-LPS)-induced macrophage population polarization dynamics and its underlying molecular mechanisms using an in vitro experimental system. Specifically, we established a P.g-LPS-induced M1 polarization model in the murine macrophage cell line RAW264.7 and evaluated the effects of glimepiride on M1 marker expression. Transcriptomic analysis was employed to identify potential signaling pathways involved, and functional verification was performed using small interfering RNA (siRNA)-mediated gene silencing. The outcomes of the present research are anticipated to offer fresh perspectives on the anti-inflammatory mechanisms of glimepiride and lay a foundation for its potential repurposing in the treatment of periodontitis.
MATERIALS AND METHODS
Reagents and Chemicals
P.g-LPS was procured from InvivoGen (San Diego, CA, U.S.A.; Catalog No. [Cat#] tlrl-pglps). Glimepiride (pharmaceutical grade) was obtained from Sanofi (Beijing, China; Cat# H20057672). Fetal bovine serum (FBS) was sourced from CELLMAX (Beijing, China; Lot# SA201.02). High-glucose Dulbecco’s modified Eagle’s medium (DMEM) was obtained from Gibco (Grand Island, New York, U.S.A.; Cat# C11995500BT). Penicillin–streptomycin solution was acquired from Servicebio (Wuhan, China; Cat# G4015). Enzyme-linked immunosorbent assay (ELISA) kits for quantitative analysis were supplied by Jingmei Biotech (Jiangsu, China): mouse IL-6 (Cat# JM-02446M1), mouse IL-12 (Cat# JM-11386M1), and mouse TNF-α (Cat# JM-02415M1). The apoptosis detection kit employing Annexin V-FITC/PI was acquired from Meilunbio (Dalian, China; Cat#MA0220-2).
Cell Culture Procedures
Murine RAW264.7 cells were purchased from Fuheng Bio (Shanghai, China; Strain No. FH0328). The cells were cultured in DMEM containing high glucose and 10% FBS in a 5% CO2 incubator at 37°C. After obtaining 90–100% cell confluency, cells were harvested by treatment with trypsin EDTA (0.25%), followed by centrifugation at 300 × g for 5 min and resuspension in freshly prepared complete medium. For pharmacological treatment experiments, the cells were seeded in 6-well plates at 3 × 10⁵ cells/well; after 24 h of incubation, cell treatments were carried out.
Determination of Cell Viability Using CCK-8
RAW264.7 macrophages in log growth phase were harvested and resuspended in complete medium to a concentration of 1 × 10⁵ cells/mL. Cell suspensions were seeded on 96-well plates and cultivated in a cell culture incubator at 37°C and 5% CO2 for 24 h. Then, the cells were incubated with glimepiride or control vehicle (0.1% dimethyl sulfoxide). Thereafter, a total of 10 µL of CCK-8 solution (commercially designated as Cell Counting Kit-8; Meilunbio, Dalian, China; Cat# MA0218) was added per well. Following a 2-h incubation, the optical density at 450 nm was measured using a Swiss-made multimode microplate reader (Tecan Infinite M200 Pro; Männedorf, Switzerland) for the absorbance assay.
Flow Cytometry Analysis
To perform a flow cytometry analysis for M1 phenotype macrophages, RAW264.7 cells were collected, washed with 1 mL of staining buffer, and the samples were spun at a centrifugal force of 200 × g for 5 min. The collected cells were suspended in an appropriate amount of staining buffer and diluted to 1 × 10⁶ cells/mL. Then, 1-µL of Fc block was introduced into 100 µL of cell suspensions, mixed well, and incubated at 4°C in the dark for 15 min, followed by a washing step with Stain Buffer. Subsequently, 2 µL of CD11b-FITC (BD Pharmingen, San Diego, CA, U.S.A.; Cat# 561688) and 5 µL of CD86-BB700 (BD Pharmingen; Cat# 742120) were added as surface antibodies, and incubation was performed at room temperature for 30 min. Each tube was centrifuged after adding 1 mL of Stain Buffer for washing, and the cell pellet was collected. All collected cells were redispersed in a volume of 300–500 µL of Stain buffer for subsequent steps and analyzed on a BD LSRFortessa Flow Cytometer (BD Biosciences, Franklin Lakes, NJ, U.S.A.). For delayed analysis, cells were stained and then fixed in 1 mL of paraformaldehyde for 30 min and then centrifuged at 300 × g for 5 min. After 2 washes with 1 mL of Stain Buffer (centrifuge at 300 × g for 5 min after each wash), all collected cells were redispersed in a volume of 300–500 µL of Stain Buffer for subsequent steps and stored in darkness at 4°C for up to 24 h.
Quantitative Real-Time PCR (qPCR) Assay
After removing phosphate-buffered saline, 1 mL of lysis buffer was added to lyse cells via gentle pipetting, and lysates were transferred to 1.5-mL tubes. Next, 100 µL of chloroform substitute (Servicebio G3014) was introduced, mixed via inversion for 15 s, and the aqueous phase was then transferred to a new tube, mixed with 550 µL of isopropanol, incubated on ice. Finally, the samples were centrifuged at 12000 rpm at 4°C for 15 min. After centrifugation, the RNA pellet was washed twice with 75% ethanol (12000 rpm, 5 min each time), dried, and resuspended in RNase-free water. RNA concentration was quantified using a NanoDrop 2000 (Thermo Fisher Scientific, Wilmington, DE, U.S.A.) and adjusted to 200 ng/µL for reverse transcription.
Reverse transcription was conducted in a 20-µL volume consisting of 4 µL 5× SuperMix, 1 µL of genomic DNA remover, and 10 µL of RNA along with RNase-free water, according to the following temperature profile: 25°C for 5 min, 42°C for 30 min, and 85°C for 5 s; qPCR reactions were prepared in 15-µL quantities (3 replicates per sample) as follows: 2× SYBR Green master mix (Servicebio G3337), 1.5 µL of gene-specific primers (2.5 µM concentration), 2.0 µL of cDNA, and water. Amplification was performed on a Roche LightCycler 480 under the following program: 95°C for 30 s (pre-denaturation), followed by 40 cycles of 95°C for 15 s and 60°C for 30 s, plus a melting curve (65–95°C). Gene expression was quantified via the ΔΔCT method: ΔCT = CT(target) − CT(control); ΔΔCT = sample ΔCT − control ΔCT; relative expression = 2−ΔΔCT. Primers are presented below (Table 1).
Table 1. Primers List
| Gene |
Primer 5′–3′ |
| M-β-actin-S |
GTGACGTTGACATCCGTAAAGA |
| M-β-actin-A |
GTAACAGTCCGCCTAGAAGCAC |
| M-CD86-S |
TTGGGCACAGAGAAACTTGATAG |
| M-CD86-A |
TTCGGGTGACCTTGCTTAGAC |
| M-PPARγ-S |
GACCACTCGCATTCCTTTGACA |
| M-PPARγ-A |
ATCGCACTTTGGTATTCTTGGA |
| M-iNOS-S |
CAACAGGAACCTACCAGCTCACT |
| M-iNOS-A |
AGCCTGAAGTCATGTTTGCCG |
Total RNA was extracted from glimepiride- and LPS-treated RAW264.7 cells using TRIzol reagent (Invitrogen, Carlsbad, CA, U.S.A.) following the manufacturer’s protocols.13) The quantity and purity of RNA were determined using a NanoDrop 1000 (Thermo Fisher Scientific, Wilmington, DE, U.S.A.) while its integrity was confirmed by Bioanalyzer 2100 (Agilent Technologies, Santa Clara, CA, U.S.A.) and also by an agarose gel electrophoresis. Samples with RNA ≥ 50 ng/µL, RNA integrity number > 7.0, 1.8–2.2 < optical density 260/280 < 1.8–2.2, and total RNA ≥ 1 µg were used for downstream analysis. Poly(A)+ mRNA underwent 2 rounds of purification using oligo(dT) magnetic beads (Dynabeads), was fragmented at 94°C for 5–7 min, and was reversed-transcribed to cDNA using SuperScript II. Second-strand synthesis was performed, dUTP was added, and the process proceeded to end repair, A-tailing, adapter ligation, and size selection. UDG digestion removed the second strand, and libraries were amplified via PCR (8 cycles), generating 300 ± 50-bp fragments, which were then sequenced using an Illumina NovaSeq 6000 (Illumina, San Diego, CA, U.S.A.) (PE150).
Quality control of raw reads was performed using fastp (default parameters) to remove adapters and low-quality sequences, followed by mapping to GRCm38 using HISAT2. Differentially expressed genes (DEGs) were identified using edgeR with the following criteria: FC > 2 or < 0.5, p < 0.05. Kyoto Encyclopedia of Genes and Genomes (KEGG) enrichment was analyzed using DAVID.
Western Blot
RAW264.7 cells underwent protein extraction, and supernatant concentrations were measured with the BCA Protein Assay Kit from Beyotime Institute of Biotechnology (Beijing, China). Ten percent sodium dodecyl sulfate-polyacrylamide gel electrophoresis gels were employed for the electrophoretic separation of the samples, followed by transfer to polyvinylidene difluoride membranes (Merck Millipore, Burlington, MA, U.S.A.; Cat# ISEQ00010). For nonspecific binding inhibition, the membranes were blocked with 5% skim milk in TBST buffer before antibody probing, and then treated with primary antibodies: anti-peroxisome proliferator-activated receptor gamma (PPARγ) antibody (MedChemExpress, Monmouth Junction, NJ, U.S.A.; Cat# HY-P80872), anti-p-p65 antibody (Proteintech, Rosemont, IL, U.S.A.; Cat# 82335-1-RR), anti-p65 antibody (Proteintech; Cat# 80979-1-RR), anti-p-inhibitor of nuclear factor kappa B (IκB)-α antibody (Proteintech; Cat# 82349-1-RR), and anti-IκB-α antibody (Proteintech; Cat# 10268-1-AP). The membranes were imaged on a ChemiDoc XRS+ system (Bio-Rad, Hercules, CA, U.S.A.) and band intensity was analyzed using ImageJ software (NIH, Bethesda, MD, U.S.A.).
ELISA
ELISA was conducted using kits from Jiangsu Jingmei Biotech (China) to quantify IL-6 (JM-02446M1), IL-12 (JM-11386M1), and TNF-α (JM-02415M1), with all steps conducted following the manufacturer’s guidelines.
Statistical Analysis
Mean ± standard error of the mean (S.E.M.) was used to express continuous data. Inter-group comparisons were conducted with one-way ANOVA. ANOVA results showed significant variations (p < 0.05). Then, the Student–Newman–Keuls test was performed for pairwise comparisons. The criterion for statistical significance was set at p < 0.05, with GraphPad Prism 10 (GraphPad Software, San Diego, CA, U.S.A.) employed for all data analyses.
RESULTS
Glimepiride Inhibits M1 Macrophage Polarization in Vitro
In cellular studies, we carried out experiments to validate the specific mechanism of action of glimepiride. First, RAW264.7 macrophages were treated with glimepiride for 48 h at varying concentrations (0–3215 ng/mL). Cell viability, evaluated via the CCK-8 assay (Fig. 1A), confirmed the non-toxic dose range. Based on dose–response analysis, 3 intervention doses were selected: low-dose (L: 1 ng/mL), medium-dose (M: 3 ng/mL), and high-dose (H: 5 ng/mL). The experimental groups were defined as: control (untreated RAW264.7 macrophages), LPS (for experimental stimulation, the cells were exposed to 100 ng/mL LPS with a 24-h incubation for the induction of M1 polarization), LPS + glimepiride-L (LPS-pretreated cells with 1 ng/mL glimepiride), LPS + glimepiride-M (LPS-pretreated cells with 3 ng/mL glimepiride), and LPS + glimepiride-H (LPS-pretreated cells with 5 ng/mL glimepiride). To investigate M1 polarization modulation, cells were pretreated with LPS to induce M1 polarization, followed by glimepiride intervention for 48 h. Flow cytometry analysis of M1 surface markers (CD86+/CD11b+) revealed that, as shown in Figs. 1B and 1C, all glimepiride-treated groups (L/M/H) exhibited significantly reduced proportions of CD86+/CD11b+ macrophages compared with the LPS group (p < 0.01), indicating suppression of LPS-induced M1 polarization. Immunofluorescence and quantitative results showed that glimepiride-treated groups reduced the fluorescence intensity of CD86 in cells (Figs. 1D and 1E). The levels of mRNA encoding M1 macrophage markers CD86 and iNOS in RAW264.7 cells were quantified via qPCR. LPS stimulation (100 ng/mL) markedly elevated the mRNA levels of both CD86 and iNOS compared with the control, while glimepiride intervention attenuated these elevations (Figs. 1F and 1G). Collectively, these results demonstrated that glimepiride inhibits LPS-triggered M1 polarization of macrophages.
Transcriptomic Analysis Indicates Glimepiride Acts via the PPARγ Pathway
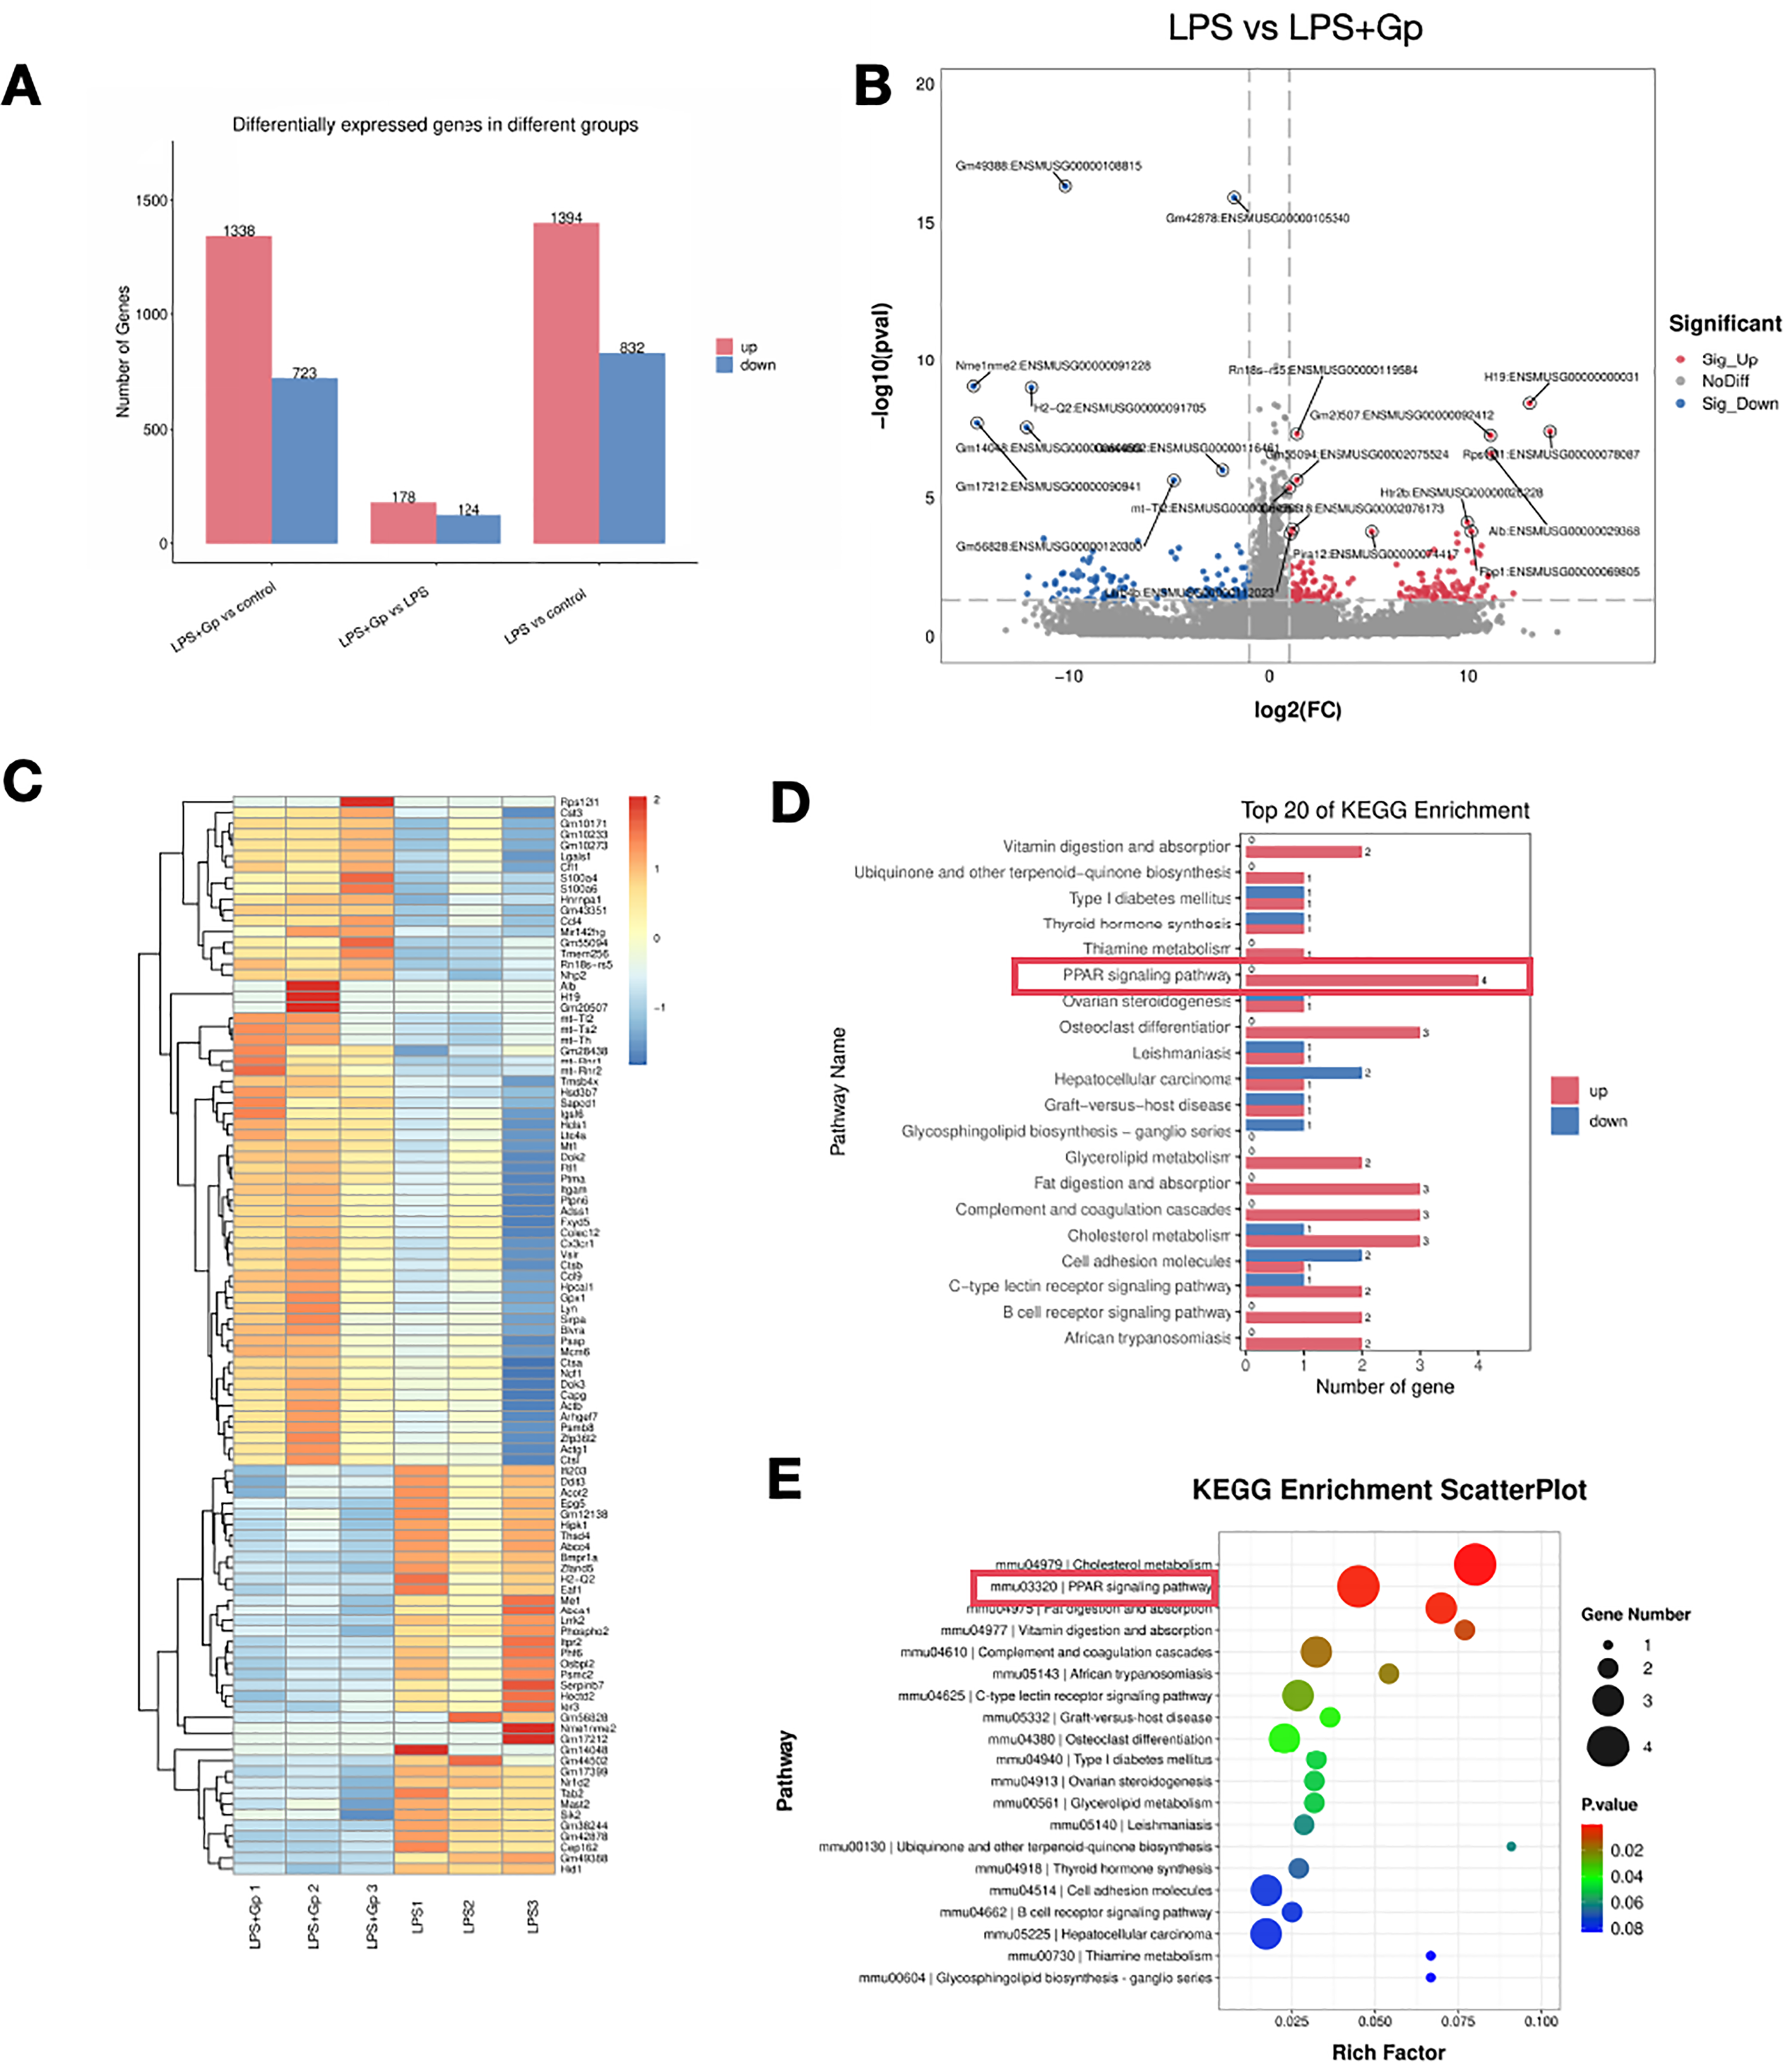
To explore the molecular mechanism underlying glimepiride-mediated inhibition of macrophage M1 polarization, transcriptomic sequencing was performed on cells from the control, LPS, and LPS + glimepiride (LPS + Gp) groups. Significant DEGs were observed between groups: vs. the LPS group, the LPS + Gp group had 178 upregulated and 124 downregulated DEGs (Fig. 2A). These results were further visualized using volcano plots and heatmaps (Figs. 2B and 2C). Enrichment analysis of KEGG pathways for upregulated, downregulated, and total DEGs revealed significant enrichment of the PPAR pathway in all categories, and glimepiride can only activate PPARγ, but not peroxisome proliferator-activated receptor gamma (PPARα) or peroxisome proliferator-activated receptor delta (PPARδ),14) suggesting that this is most likely the pathway through which glimepiride works (Figs. 2D and 2E).
Glimepiride Suppresses M1 Macrophage Polarization via PPARγ
As a ligand-activated nuclear receptor, PPARγ serves a key function in macrophage polarization.15) PPARγ activation promotes the alternative activation of M2 macrophages exhibiting anti-inflammatory characteristics while restraining the classical activation of pro-inflammatory M1 macrophages by repressing the nuclear factor-kappa B (NF-κB) signaling pathway and decreasing the expression of M1 phenotypic markers.16) To validate whether glimepiride exerts its regulatory effects via PPARγ, qPCR was first performed to detect PPARγ mRNA expression in mouse RAW264.7 macrophages. Results showed that LPS stimulation significantly reduced PPARγ mRNA levels in RAW264.7 cells, whereas glimepiride intervention markedly upregulated PPARγ expression. To further investigate the mechanism, siRNA was used to knock down PPARγ mRNA expression, and qPCR confirmed successful suppression of PPARγ (Fig. 3A). Subsequent mechanistic validation used this siRNA in RAW264.7 cells. Western blot analysis showed that LPS induction upregulated CD86 and iNOS protein levels, which were suppressed by glimepiride treatment. However, PPARγ knockdown via siRNA reversed this suppression, leading to restored CD86 and iNOS expression (Figs. 3B–3D). These findings indicate that glimepiride inhibits M1 macrophage polarization through the PPARγ pathway.
Glimepiride Suppresses Expression of Pro-inflammatory Cytokines and the IκB–p65 Signaling Pathway in M1-Polarized Macrophages via PPARγ
PPARγ regulates inflammatory reactions by suppressing the NF-κB signaling cascade. When activated, PPARγ inhibits IκB phosphorylation and p65 nuclear translocation, thereby reducing the pro-inflammatory cytokine transcription.17,18) To explore this mechanism, ELISA was performed to quantify pro-inflammatory cytokine levels in RAW264.7 macrophages. LPS stimulation markedly enhanced the secretion levels of IL-6, IL-12, and TNF-α, whereas glimepiride treatment markedly suppressed these cytokines. Knockdown of PPARγ via siRNA reversed this suppression, leading to restored cytokine secretion (Figs. 4A–4C). Further mechanistic studies investigated the PPARγ–IκB–p65 axis using Western blot. LPS stimulation decreased PPARγ protein expression while increasing phosphorylated p65 (p-p65) and phosphorylated IκB (p-IκB). Glimepiride treatment upregulated PPARγ and downregulated p-p65 and p-IκB levels. However, PPARγ siRNA transfection reversed these effects, with p-p65/p-IκB expression increasing in parallel with reduced PPARγ (Figs. 5A–5D). Collectively, these results demonstrate that glimepiride inhibits M1 macrophage-mediated inflammation by activating PPARγ and suppressing the IκB–p65 signaling pathway.
DISCUSSION
Glimepiride has been widely prescribed for T2DM management, with its well-characterized role in enhancing insulin secretion via SUR1 on pancreatic β-cells. Beyond this canonical metabolic effect, a growing body of in vitro and translational research has shifted focus to its pleiotropic activities, particularly the anti-inflammatory properties that extend its potential beyond glycemic control.19) Glimepiride has been shown to inhibit the activation of NOD-, LRR-, and pyrin domain-containing protein 3 inflammasome—a central platform for mature IL-1β secretion—in macrophages,20) an effect that may synergize with its suppression of M1 polarization to limit inflammatory responses. Another intriguing in vitro observation is that glimepiride modulates the release of CD14, a glycosylphosphatidylinositol (GPI)-anchored co-receptor essential for LPS recognition. By activating GPI-phospholipase C, glimepiride promotes the shedding of membrane-bound CD14 into the extracellular space, reducing its cell surface availability for pathogen-associated molecular pattern binding.21) This “decoy receptor” effect limits the release of pro-inflammatory cytokines in the RAW264.7 cell line, providing an additional layer of anti-inflammatory regulation that aligns with its modulation of macrophage polarization.
Notably, macrophages—key orchestrators of inflammatory cascades—have emerged as a plausible cellular target for glimepiride, yet the specific regulatory effects on macrophage polarization and the underlying molecular cues remain incompletely defined. Addressing this gap, the present in vitro study delineates a critical role of glimepiride in regulating macrophage polarization: its core biological effect is manifested as the suppression of M1 pro-inflammatory polarization and subsequent reduction in pro-inflammatory cytokine release. Macrophage phenotypic plasticity is a key determinant of inflammatory outcomes.10) We conducted a series of in vitro experiments using RAW264.7 cells, and the results repeatedly confirmed that LPS-induced M1 polarization is characterized by the upregulation of surface markers CD86 and iNOS and the excessive secretion of pro-inflammatory cytokines.22,23) The current study confirms that glimepiride mitigates this LPS-induced M1 skewing, as evidenced by reduced expression of CD86 and iNOS, coupled with a reduced secretion of pro-inflammatory cytokines. This finding is consistent with the emerging notion that glimepiride exerts anti-inflammatory effects beyond its glycemic regulatory function, with macrophages being a direct target of its immunomodulatory activity.
To elucidate the underlying molecular mechanisms, we focused on PPARγ, a ligand-activated nuclear receptor that acts as a central regulator of immune and metabolic homeostasis.24) In macrophages, PPARγ functions as a key modulator of polarization by orchestrating transcriptional programs that suppress M1 differentiation and promote M2-like phenotypes.25) Our findings confirm that glimepiride acts as a functional PPARγ agonist in macrophages, and this agonism is indispensable for its regulatory effect on polarization. Mechanistically, PPARγ exerts its anti-inflammatory role primarily through 2 interconnected pathways: direct transactivation of anti-inflammatory genes (e.g., IL-10) via binding to PPAR response elements, and indirect transcriptional repression of NF-κB target genes through physical interaction with the p65 subunit.26) The latter pathway, in particular, constitutes the critical link between PPARγ activation and the suppression of M1 polarization mediated by glimepiride.
The IκB/p65 signaling axis is a central hub governing inflammatory gene transcription.27) In resting cells, p65-containing NF-κB dimers are confined within the cytoplasm by inhibitory IκB proteins. Upon inflammatory stimulation, IκB kinases (IKKα/β) phosphorylate IκB, triggering its ubiquitination and proteasomal degradation. Released p65 dimers translocate to the nucleus,28) where they activate the key proinflammatory genes, namely, TNF-α, IL-6, and iNOS, by binding to κB response elements. PPARγ exerts its regulatory role in this signaling cascade by specifically modulating the IκB phosphorylation axis. Under inflammatory stimulation, activated IKK phosphorylates cytoplasmic IκB proteins, marking them for polyubiquitination and subsequent proteasome-mediated degradation.29) This process then releases NF-κB (p65/p50 dimers) from the IκB-bound complex, exposing their nuclear localization signals and enabling p65 nuclear translocation to drive transcription of M1 polarization-related genes (CD86, iNOS) and proinflammatory cytokines. Glimepiride-mediated PPARγ activation disrupts this process by reducing IκB phosphorylation: PPARγ dampens IKK activity, limiting the generation of phosphorylated IκB. Consequently, fewer IκB molecules undergo ubiquitination and degradation, preserving the cytoplasmic IκB–p65 complex. This sustained binding sequesters p65 in the cytoplasm, preventing its nuclear translocation and thus blunting the transcriptional activity of M1 macrophage-specific genes. This effect not only inhibits phenotypic polarization toward the M1 macrophage subtype but also reduces proinflammatory cytokine secretion, thereby exerting a significant mitigating effect on the inflammatory response.
Collectively, these findings establish a clear molecular mechanism by which glimepiride manifests anti-inflammatory efficacy in macrophages—an effect brought about by PPARγ activation that perturbs the p65/IκB-mediated signaling pathway, blocks the shift toward M1 macrophage polarization, and reduces pro-inflammatory cytokine release. This mechanism not only expands our understanding of glimepiride’s pleiotropic actions but also emphasizes the agent’s therapeutic potential as a repositioned pharmaceutical compound for the treatment of inflammatory pathologies. Such explorations will further consolidate the role of glimepiride as a multi-targeted modulator of macrophage function and advance its clinical application in periodontitis.
CONCLUSION
Our findings demonstrate that glimepiride suppresses P.g-LPS-induced macrophage M1 polarization through a PPARγ-dependent blockade of the IκB–p65 pathway, thereby reducing pro-inflammatory cytokine release (Fig. 6).
DECLARATIONS
Conflict of Interest
The authors declare no conflict of interest.
Supplementary Materials
This article contains supplementary materials.
REFERENCES
- 1) Doyle ME, Egan JM. Pharmacological agents that directly modulate insulin secretion. Pharmacol. Rev., 55, 105–131 (2003).
- 2) Seino Y, Maekawa R, Ogata H, Hayashi Y. Carbohydrate-induced secretion of glucose-dependent insulinotropic polypeptide and glucagon-like peptide-1. J. Diabetes Investig., 7 (Suppl. 1), 27–32 (2016).
- 3) Shrestha D, Dhingra A, Shakya S, Tuladhar J. From glucose control to multifaceted benefits: the rise of modern sulphonylureas in diabetes care. Curr. Diab. Rep., 25, 28 (2025).
- 4) Matsutani T, Tamura K, Kutsukake M, Matsuda A, Tachikawa E, Uchida E. Impact of pioglitazone on macrophage dynamics in adipose tissues of cecal ligation and puncture-treated mice. Biol. Pharm. Bull., 40, 638–644 (2017).
- 5) Sun X, Gao J, Meng X, Lu X, Zhang L, Chen R. Polarized macrophages in periodontitis: characteristics, function, and molecular signaling. Front. Immunol., 12, 763334 (2021).
- 6) Banu S, Sur D. Role of macrophage in type 2 diabetes mellitus: macrophage polarization a new paradigm for treatment of type 2 diabetes mellitus. Endocr. Metab. Immune Disord. Drug Targets, 23, 2–11 (2023).
- 7) Wu X, He W, Mu X, Liu Y, Deng J, Liu Y, Nie X. Macrophage polarization in diabetic wound healing. Burns Trauma, 10, tkac051 (2022).
- 8) Zheng M, Wang C, Ali A, Shih YA, Xie Q, Guo C. Prevalence of periodontitis in people clinically diagnosed with diabetes mellitus: a meta-analysis of epidemiologic studies. Acta Diabetol., 58, 1307–1327 (2021).
- 9) Zhang Y, Yan M, Yu Q, Yang P, Zhang H, Sun Y, Zhang Z, Gao Y. Puerarin prevents LPS-induced osteoclast formation and bone loss via inhibition of Akt activation. Biol. Pharm. Bull., 39, 2028–2035 (2016).
- 10) Zhou LN, Bi CS, Gao LN, An Y, Chen F, Chen FM. Macrophage polarization in human gingival tissue in response to periodontal disease. Oral Dis., 25, 265–273 (2019).
- 11) Hadi NR, Al-Amran F, Hussein MAA, Rezeg FA. Evaluation of the effects of glimepiride (Amaryl) and repaglinide (novoNorm) on atherosclerosis progression in high cholesterol-fed male rabbits. J. Cardiovasc. Dis. Res., 3, 5–11 (2012).
- 12) Terao Y, Ayaori M, Ogura M, Yakushiji E, Uto-Kondo H, Hisada T, Ozasa H, Takiguchi S, Nakaya K, Sasaki M, Komatsu T, Iizuka M, Horii S, Mochizuki S, Yoshimura M, Ikewaki K. Effect of sulfonylurea agents on reverse cholesterol transport in vitro and vivo. J. Atheroscler. Thromb., 18, 513–530 (2011).
- 13) Park S-E, Park K, Kim E, Kim CY, Hwang S-M, Lee J-M, Suh J-Y, Lee Y, Kim MO, Kim YG. CXCL5/CXCL8 induces neutrophilic inflammation in peri-implantitis. J. Periodontal Res., 59, 698–711 (2024).
- 14) Fukuen S, Iwaki M, Yasui A, Makishima M, Matsuda M, Shimomura I. Sulfonylurea agents exhibit peroxisome proliferator-activated receptor γ agonistic activity. J. Biol. Chem., 280, 23653–23659 (2005).
- 15) Xu M, Wang X, Li Y, Geng X, Jia X, Zhang L, Yang H. Arachidonic acid metabolism controls macrophage alternative activation through regulating oxidative phosphorylation in PPARγ dependent manner. Front. Immunol., 12, 618501 (2021).
- 16) Zhou F, Mei J, Han X, Li H, Yang S, Wang M, Chu L, Qiao H, Tang T. Kinsenoside attenuates osteoarthritis by repolarizing macrophages through inactivating NF-κB/MAPK signaling and protecting chondrocytes. Acta Pharm. Sin. B, 9, 973–985 (2019).
- 17) Zhang G, Pan R, Lai S, Liang J, Wang S, Wu S, Yu B, Zeng R. Phosphatidylserine-functional polydimethylsiloxane substrates regulate macrophage M2 polarization via modulus-dependent NF-κB/PPARγ pathway. Biomater. Adv., 165, 213997 (2024).
- 18) Xiang X, Xin X, Hou Y, Deng Y, Liu X, Yu W. Diosgenin alters LPS-induced macrophage polarization by activating PPARγ/NF-κB signaling pathway. Int. Immunopharmacol., 126, 111270 (2024).
- 19) Samuel VT, Shulman GI. The pathogenesis of insulin resistance: integrating signaling pathways and substrate flux. J. Clin. Invest., 126, 12–22 (2016).
- 20) Kawahara Y, Kaneko T, Yoshinaga Y, Arita Y, Nakamura K, Koga C, Yoshimura A, Sakagami R. Effects of sulfonylureas on periodontopathic bacteria-induced inflammation. J. Dent. Res., 99, 830–838 (2020).
- 21) Ingham V, Williams A, Bate C. Glimepiride reduces CD14 expression and cytokine secretion from macrophages. J. Neuroinflammation, 11, 115 (2014).
- 22) Zhang B, Yang Y, Yi J, Zhao Z, Ye R. Hyperglycemia modulates M1/M2 macrophage polarization via reactive oxygen species overproduction in ligature-induced periodontitis. J. Periodontal Res., 56, 991–1005 (2021).
- 23) Zhao Z, Ming Y, Li X, Tan H, He X, Yang L, Song J, Zheng L. Hyperglycemia aggravates periodontitis via autophagy impairment and ROS-inflammasome-mediated macrophage pyroptosis. Int. J. Mol. Sci., 24, 6309 (2023).
- 24) He L, Jhong J-H, Chen Q, Huang K-Y, Strittmatter K, Kreuzer J, DeRan M, Wu X, Lee T-Y, Slavov N, Haas W, Marneros AG. Global characterization of macrophage polarization mechanisms and identification of M2-type polarization inhibitors. Cell Rep., 37, 109955 (2021).
- 25) Schmidt MV, Brüne B, Von Knethen A. The nuclear hormone receptor PPARγ as a therapeutic target in major diseases. ScientificWorldJournal, 10, 2181–2197 (2010).
- 26) Cheng S, Chen W, Guo Z, Ding C, Zuo R, Liao Q, Liu G. Paeonol alleviates ulcerative colitis by modulating PPAR-γ and nuclear factor-κB activation. Sci. Rep., 14, 18390 (2024).
- 27) Ma Y, Hu J, Xue X, Gu J, Pan Y, Yang J. SENP3 deletion promotes M2 macrophage polarization and accelerates wound healing through smad6/IκB/p65 signaling pathway. Heliyon, 9, e15584 (2023).
- 28) Kang C-M, Mo S, Jeon M, Jung U-W, Shin Y, Shin J-S, Shin B-Y, Lee S-K, Choi H-J, Song JS. Intranuclear delivery of nuclear factor-kappa B p65 in a rat model of tooth replantation. Int. J. Mol. Sci., 22, 1987 (2021).
- 29) Mulero MC, Huxford T, Ghosh G. NF-κB, IκB, and IKK: integral components of immune system signaling. Structural Immunology. (Jin T, Yin Q, eds.) Vol. 1172, Springer Singapore, Singapore, pp. 207–226 (2019), doi:10.1007/978-981-13-9367-9_10.