Abstract
Background:
The risk prediction of incident atrial fibrillation (AF) is useful to prevent AF and its complications. The aim of this study is to develop a new risk prediction model for incident AF using the prospective longitudinal data from a general Japanese population.
Methods and Results:
A total of 2,442 community-dwelling AF-free residents aged ≥40 years were followed up from 1988 to 2012 (46,422 person-years). The development of AF was confirmed by a standard 12-lead electrocardiogram at repeated health examinations and by medical records at clinics or hospitals. The risk prediction model for incident AF was developed using a Cox proportional hazards model. During the follow up, 230 AF events were confirmed. Age, sex, systolic blood pressure, waist circumference, estimated glomerular filtration rate, abnormal cardiac murmur, high R-wave amplitude, and arrhythmia other than AF were selected for inclusion in the model. This model showed good discrimination (Harrell’s c statistics: 0.785) and calibration (Greenwood-Nam-D’Agostino test: P=0.87) for AF risk at 10 years.
Conclusions:
The new risk prediction model showed good performance on the individual risk assessment of the future onset of AF in a general Japanese population. As this model included commonly used clinical parameters, it may be useful for determining the requirements for the careful evaluation of AF, such as frequent electrocardiogram examinations in clinical settings, and subsequent reductions in the risk of AF-related complications.
Atrial fibrillation (AF) is a common arrhythmia that is frequently observed in elderly people.1
The number of patients with AF has increased worldwide over the past few decades and is expected to become especially high in super-aged societies such as Japan.1
The major complications of AF include serious conditions such as ischemic stroke, coronary artery disease, and heart failure.2
Therefore, the prediction of the risk for incident AF and the detection of people at higher risk of AF are important for the prevention of AF and its complications.
Risk prediction models are useful tools for estimating the future risk of common diseases, such as cardiovascular diseases,3,4
and for the management of risk factors to reduce the risk of developing diseases in clinical and public health settings. Some population-based studies in Western countries have developed risk prediction models for incident AF.5–9
However, it may not be appropriate to apply the risk prediction models developed in Western populations to Asian populations, because genetic, environmental, and lifestyle backgrounds differ between Westerners and Asians. Therefore, it would be worthwhile to develop a risk prediction model specifically for incident AF in Japanese communities. At present, only one population-based study conducted in an urban area of Japan, the Suita Study, has reported to have developed a risk prediction model of incident AF.10
The present study aimed to develop a new risk prediction model for incident AF in a relatively rural community in Japan using prospective longitudinal data.
Methods
Study Participants
The Hisayama Study is population-based prospective cohort study established in 1961 for the investigation of cardiovascular diseases, including AF.11
The town of Hisayama is located in a relatively rural area adjacent to Fukuoka City on the Kyushu Island of Japan. In 1988, a comprehensive baseline health examination for the present study was performed in this town.11,12
A total of 2,742 residents aged ≥40 years (participation rate, 80.9%) consented to participate in this survey. After the exclusion of 57 subjects who had AF or atrial flutter at baseline or in their past history, 8 without electrocardiogram (ECG) records at the baseline examination, 134 without fasting blood samples at baseline, 62 without baseline data on waist circumference, and 39 subjects lacking the information needed to determine the presence or absence of AF during follow up, the remaining 2,442 subjects (1,050 men and 1,392 women) were enrolled in the present study.
Follow-up Survey
The study participants were followed up prospectively for 24 years, from 1 December 1988 to 30 November 2012. The method for the ascertainment of incident AF cases was described previously.13
Information on new AF events was primarily collected at annual health examinations in Hisayama during the follow-up period; these examinations included a standard 12-lead ECG and an interview by a study physician. For participants who did not participate in the health examinations or who moved away from Hisayama, a standard questionnaire was administered by mail or telephone interviews each year. In the questionnaire, we asked participants whether they had experienced new cardiovascular events, including stroke, coronary artery diseases, arrhythmia, and other heart diseases. In addition, we collected information on new cardiovascular events, including AF, through a daily monitoring system established by the study team, local physicians, and members of the town’s Health Office. When a new AF event was suspected or a subject died, we reviewed all the available clinical information including standard 12-lead ECG, ambulatory monitoring ECG, physicians’ diagnosis for arrhythmia on medical records, and death certificates, to determine whether the participants had experienced AF. During the follow-up period, 989 subjects died from any cause.
Diagnosis of AF
The definition of AF in the present study included both chronic and paroxysmal AF and atrial flutter (Minnesota Code, 8-3-1 to 8-3-4). The primary outcome of the present study was a new onset AF, which was diagnosed at the annual health examinations, clinics, or hospitals. ECG records or medical records of the participants with AF, including suspected cases, were reviewed and adjudicated by the study team, which included cardiologists, to confirm the final diagnosis of AF.
Measurements of Potential Risk Factors at Baseline
In the present study, the following potential risk factors for AF, which are commonly used in clinical settings, were analyzed for their potential effectiveness in a risk prediction model for AF: age, sex, systolic blood pressure, diastolic blood pressure, fasting plasma glucose, serum high-density lipoprotein (HDL) cholesterol, serum non-HDL cholesterol, serum triglycerides, body mass index (BMI), waist circumference, estimated glomerular filtration rate (eGFR), history of coronary artery disease, abnormal cardiac murmur, high R-wave amplitude on ECG, arrhythmia other than AF on ECG, smoking status, alcohol drinking status, and regular exercise.
Each risk factor was classified into 2 or more categories as shown in
Supplementary Table 1. Systolic and diastolic blood pressure were measured 3 times at the upper arm in the sitting position using a mercury sphygmomanometer after 5 min of rest, and the average of 3 measurements was used in the statistical analysis. Fasting plasma glucose levels were measured by using the glucose-oxidase method. Serum concentrations of total cholesterol, HDL cholesterol, and triglycerides were determined enzymatically. Serum non-HDL cholesterol concentrations were calculated by subtracting HDL cholesterol concentrations from total cholesterol values. Body height and weight were measured in light clothing without shoes, and BMI was calculated as body weight in kilograms divided by the square of body height in meters. Waist circumference was measured at the umbilical level in the standing position by a trained staff member and classified into 2 categories by the cut-off values for Japanese people (85 cm for men and 90 cm for women).14
Serum creatinine concentrations were measured by using the Jaffe method and converted to an enzymatic method value, as described previously.15
eGFR was calculated by using the modified Chronic Kidney Disease Epidemiology Collaboration formula for Japanese people based on serum creatinine concentrations (enzymatic method values).16
History of coronary artery disease was defined as any preexisting event of acute or silent myocardial infarction, or a history of coronary revascularization. Abnormal cardiac murmur was defined as systolic murmur of Levine III to VI, any diastolic murmur, or both, as determined by a study physician according to the definition of the Framingham Heart Study.17
A standard 12-lead ECG was performed at baseline and the findings were classified by using the Minnesota Code Classification System.18
A high R-wave amplitude was defined by Minnesota Code 3-1. Arrhythmia other than AF included arrhythmia coded by a Minnesota Code of 6-1, 6-2, 6-3, 8-1, 8-2, 8-4, 8-5, 8-6, 8-8 or 8-9. Information on smoking habits, alcohol intake, and physical activity during leisure time was obtained using a self-administered questionnaire. Smoking status was classified into 4 categories: never smokers, former smokers, current smokers who smoked 1–19 cigarettes per day, and current smokers who smoked ≥20 cigarettes per day. Alcohol drinking status was classified into 4 categories: never drinkers, former drinkers, current drinkers who consumed <34 g of ethanol per day (which corresponds to 270 mL [1.5 go] of sake [Japanese rice wine]), and current drinkers who consumed ≥34 g of ethanol per day. Subjects engaging in sports or other forms of exertion ≥3 times a week during their leisure time were defined as the regular exercise group.
Statistical Analysis
The association of potential risk factors with the risk of developing AF was estimated by using Cox proportional hazards model. For each risk factor classified into ≥2 categories, dummy variables for that risk factor were included in the models. The follow up was censored at the date of the last follow-up survey, the date of death, or 30 November 2012. Heterogeneity in the age-adjusted hazard ratios (HRs) for incident AF between men and women was evaluated by adding a multiplicative interaction term to the relevant model. The fully adjusted multivariable model included the above-mentioned potential risk factors, except for diastolic blood pressure and BMI, which were not used for the variable selection because of their strong correlation with systolic blood pressure (Pearson’s correlation coefficient, r=0.62) and waist circumference (r=0.80), respectively. Finally, the risk prediction model was established by a backward elimination of variables from the fully adjusted model with a significance level of 0.20.
By using the risk prediction model, the predicted cumulative risk of AF at
t
years ( ) can be calculated as:

where
S0(t) is a baseline survivor function at
t
years; Σβx
is an individual risk estimate calculated as the sum of the products of coefficients (β) (equal to log-transformed HRs) and individual values (x) of each variable; and Σβ is a baseline risk estimate calculated as the sum of the products of coefficients (β) and mean values () of each variable. In addition, the risk prediction model was translated into a point-based simple risk score using the approach developed in the Framingham Heart Study.3,19
The discrimination of the cumulative risk of AF at 10 years was assessed by Harrell’s c statistics. For an internal validation, the optimism of the risk model was estimated by using Harrell’s method with 200 bootstrap samples.20
The estimated optimism was then subtracted from the c statistics calculated in the original cohort to obtain the optimism-corrected c statistics.20
The observed risk of AF at 10 years based on the real data and the predicted risk of AF at 10 years based on the risk prediction model were compared using a calibration plot by ranking participants into decile groups of the predicted risk. Because of the low number of AF events, the first through to the fourth decile groups were combined into 1 group and the fifth through to the seventh decile groups were also combined into 1 group (resulting in a total of 5 groups). The calibration of the model was evaluated by using the Greenwood-Nam-D’Agostino χ2
test.21
Statistical analyses were performed using SAS version 9.4 (SAS Institute, Cary, NC, USA). A 2-tailed P value of <0.05 was considered statistically significant.
Ethical Considerations
The protocol of the present study conformed with the Declaration of Helsinki and was approved by the Kyushu University Institutional Review Board for Clinical Research (reference number: 2019-499). Written or oral informed consent was obtained from the participants.
Results
Table 1
shows the baseline characteristics of the study participants. The mean age was 59 years and 43% were male.
Table 1.
Baseline Characteristics of the Study Participants From the Hisayama Study, 1988
| |
Total
(n=2,442) |
| Age (years) |
59 (11) |
| Men (%) |
43.0 |
| Systolic blood pressure (mmHg) |
133 (21) |
| Diastolic blood pressure (mmHg) |
78 (11) |
| Fasting plasma glucose (mg/dL)† |
104 (23) |
| Serum total cholesterol (mg/dL)‡ |
208 (42) |
| Serum HDL cholesterol (mg/dL)‡ |
50 (12) |
| Serum non-HDL cholesterol (mg/dL)‡ |
158 (41) |
| Serum triglycerides (mg/dL)¶ |
99 (71–143) |
| Body mass index (kg/m2) |
22.9 (3.1) |
| Waist circumference (cm) |
81.5 (9.3) |
| eGFR (mL/min/1.73 m2) |
80.8 (10.4) |
| History of coronary artery disease (%)§ |
0.5 |
| Abnormal cardiac murmur (%) |
1.2 |
| High amplitude R-waves on ECG (%)†† |
12.6 |
| Arrhythmia other than AF (%)‡‡ |
9.5 |
| Former smoker (%) |
14.1 |
| Current smoker (%) |
25.2 |
| 1–19 cigarettes/day (%) |
14.5 |
| ≥20 cigarettes/day (%) |
10.7 |
| Former drinker (%) |
3.7 |
| Current drinker (%) |
31.5 |
| Ethanol <34 g/day (%)¶¶ |
18.1 |
| Ethanol ≥34 g/day (%)¶¶ |
13.4 |
| Regular exercise, ≥3 days/week (%) |
10.5 |
HDL, high-density lipoprotein; eGFR, estimated glomerular filtration rate; ECG, electrocardiogram; AF, atrial fibrillation. Values are presented as the means (standard deviations) for continuous variables and percentages for categorical variables, except for serum triglycerides. †Multiply by 0.05551 to convert mg/dL of plasma glucose concentration to mmol/L. ‡Multiply by 0.02586 to convert mg/dL of serum cholesterol concentration to mmol/L. ¶The median (interquartile range) is shown for serum triglycerides. Multiply by 0.01129 to convert mg/dL of serum triglycerides concentration to mmol/L. §History of acute or silent myocardial infarction, or coronary revascularization. ††Minnesota Codes: 3–1. ‡‡Minnesota Codes: 6–1, 6–2, 6–3, 8–1, 8–2, 8–4, 8–5, 8–6, 8–8, or 8–9. ¶¶Corresponds to 270 mL (1.5 go) of sake (Japanese rice wine) per day.
During the follow up of 46,422 person-years in total (median: 24 years; interquartile range: 15–24 years), a total of 230 incident cases of AF were observed. Among them, 95 AF events were detected by ECG at annual health examinations and the remaining 135 AF events were diagnosed at clinics or hospitals only.
Table 2
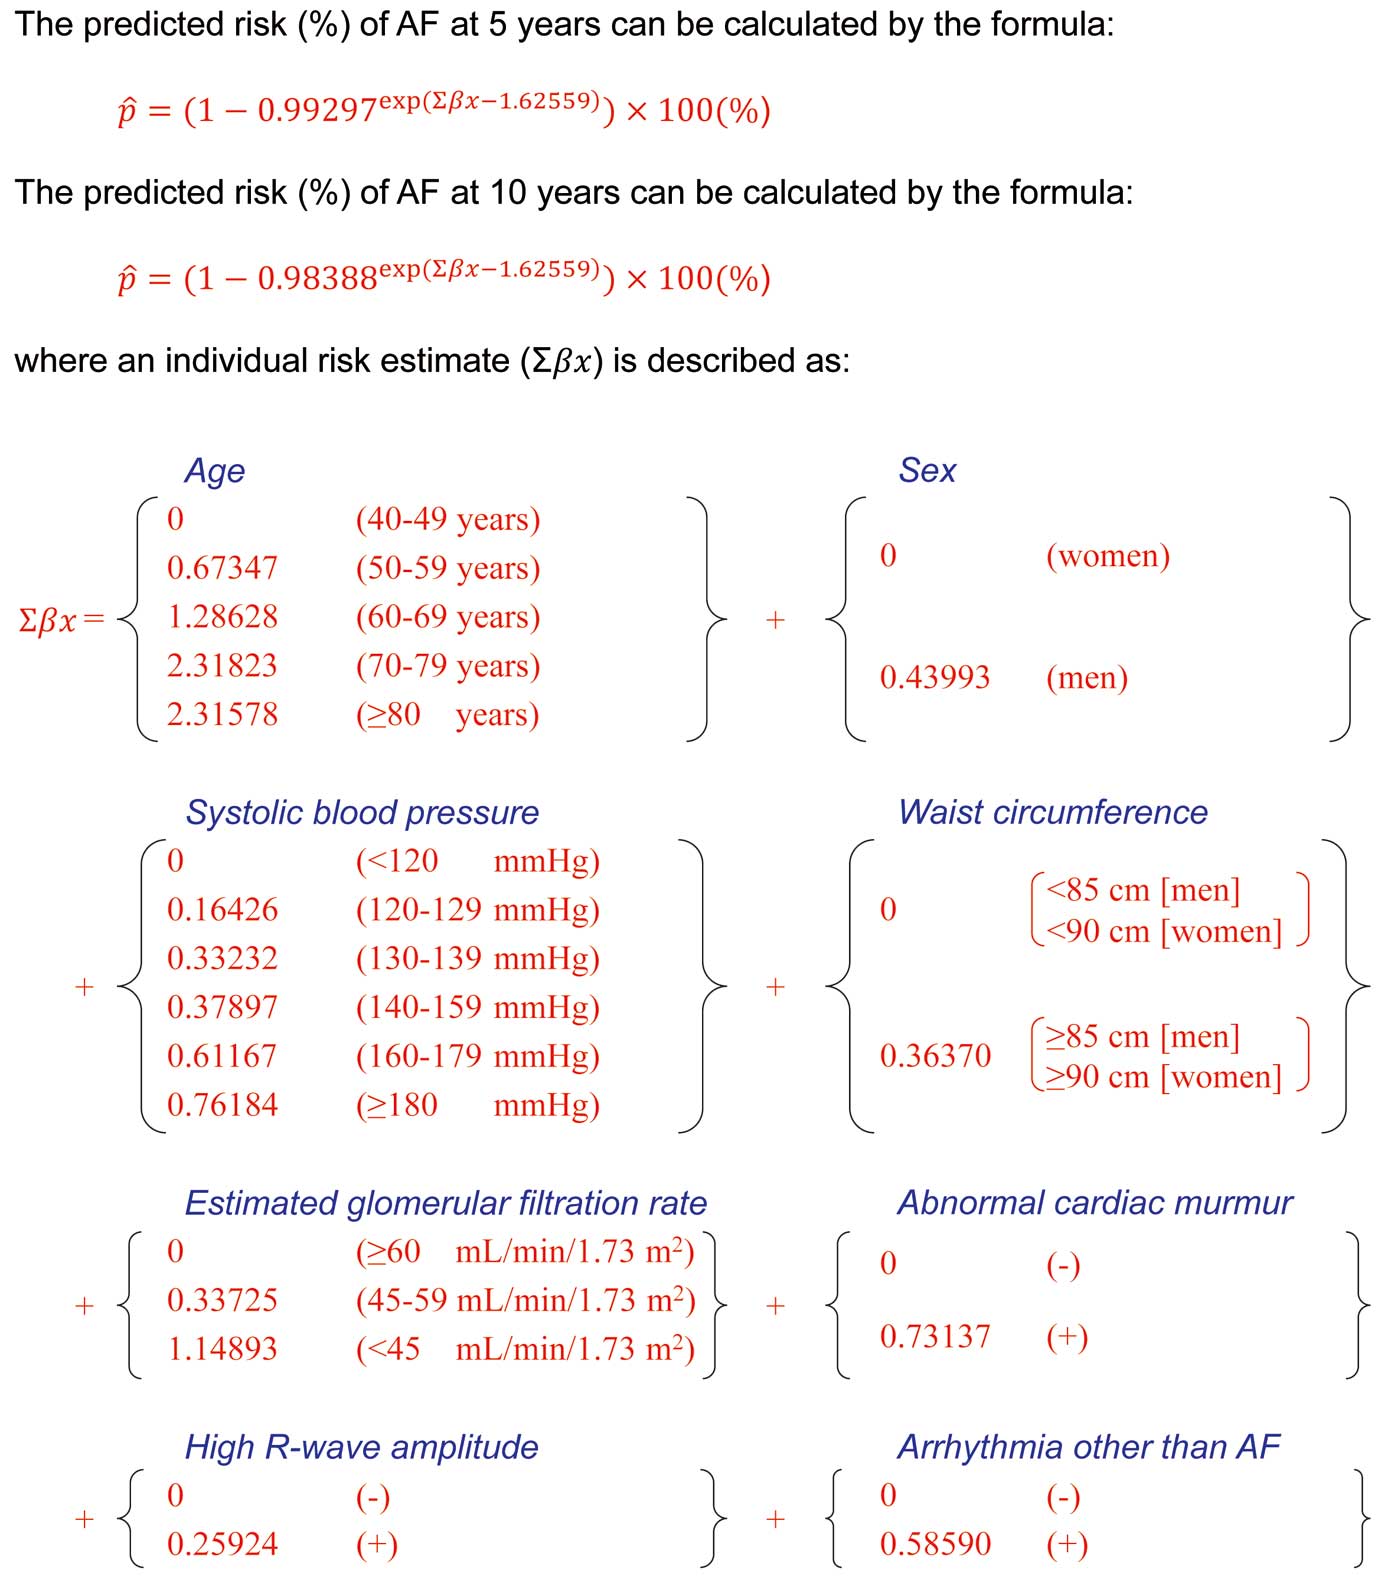
demonstrates the age- and sex-adjusted and multivariable-adjusted HRs for developing AF across the statuses of potential risk factors. Older age, male sex, elevated systolic and diastolic blood pressure, larger waist circumference, decreased eGFR, abnormal cardiac murmur, high R-wave amplitude on ECG, and arrhythmia other than AF on ECG were significantly associated with the risk of AF in the age- and sex-adjusted analyses. These risk factors remained significant in the fully adjusted multivariable analysis, except for men (P=0.12) and high R-wave amplitude (P=0.18). As we found no clear evidence of heterogeneity in the association between men and women (Supplementary Table 1), we decided to develop a risk prediction model for both sexes jointly. In the multivariable-adjusted analysis with the backward elimination of the variables included in the fully adjusted model, 8 variables — namely, age, sex, systolic blood pressure, waist circumference, eGFR, abnormal cardiac murmur, high R-wave amplitude, and arrhythmia other than AF — were selected as predictors in the risk prediction model for incident AF (Table 3). The predicted risk of AF at 10 years can be calculated by the equation described in
Figure 1.
Table 2.
Age- and Sex-Adjusted and Fully Adjusted HR (95% CI) for the Development of AF in the Hisayama Study, 1988–2012
| Risk factors |
Numbers of
events/at risk |
Age- and sex-adjusted† |
Fully adjusted‡ |
| HR (95% CI) |
P value |
HR (95% CI) |
P value |
| Age (years) |
| 40–49 |
23/627 |
1.00 (Ref.) |
|
1.00 (Ref.) |
|
| 50–59 |
52/721 |
2.23 (1.36–3.64) |
0.001 |
1.95 (1.19–3.21) |
0.009 |
| 60–69 |
75/653 |
4.29 (2.69–6.86) |
<0.001 |
3.66 (2.26–5.93) |
<0.001 |
| 70–79 |
71/346 |
13.32 (8.25–21.50) |
<0.001 |
10.84 (6.47–18.19) |
<0.001 |
| ≥80 |
9/95 |
15.62 (7.09–34.44) |
<0.001 |
9.84 (4.31–22.48) |
<0.001 |
| Sex |
| Women |
118/1,392 |
1.00 (Ref.) |
|
1.00 (Ref.) |
|
| Men |
112/1,050 |
1.73 (1.33–2.25) |
<0.001 |
1.41 (0.92–2.18) |
0.12 |
| Systolic blood pressure (mmHg) |
| <120 |
37/665 |
1.00 (Ref.) |
|
1.00 (Ref.) |
|
| 120–129 |
41/497 |
1.30 (0.83–2.04) |
0.24 |
1.21 (0.77–1.90) |
0.42 |
| 130–139 |
46/453 |
1.53 (0.99–2.36) |
0.06 |
1.43 (0.91–2.24) |
0.12 |
| 140–159 |
65/558 |
1.67 (1.11–2.52) |
0.01 |
1.49 (0.96–2.30) |
0.07 |
| 160–179 |
28/203 |
2.13 (1.29–3.51) |
0.003 |
1.89 (1.10–3.23) |
0.02 |
| ≥180 |
13/66 |
2.79 (1.46–5.33) |
0.002 |
2.12 (1.07–4.17) |
0.03 |
| Diastolic blood pressure (mmHg) |
| <80 |
119/1,375 |
1.00 (Ref.) |
|
|
|
| 80–84 |
40/446 |
1.07 (0.75–1.54) |
0.70 |
|
|
| 85–89 |
33/224 |
2.00 (1.35–2.96) |
<0.001 |
|
|
| 90–99 |
26/306 |
1.14 (0.74–1.75) |
0.56 |
|
|
| 100–109 |
10/72 |
2.67 (1.38–5.18) |
0.004 |
|
|
| ≥110 |
2/19 |
1.98 (0.49–8.05) |
0.34 |
|
|
| Fasting plasma glucose |
| <100 mg/dL (<5.6 mmol/L) |
100/1,215 |
1.00 (Ref.) |
|
1.00 (Ref.) |
|
| 100–109 mg/dL (5.6–6.0 mmol/L) |
77/699 |
1.26 (0.93–1.70) |
0.13 |
1.22 (0.90–1.66) |
0.20 |
| 110–125 mg/dL (6.1–6.9 mmol/L) |
29/325 |
0.95 (0.62–1.44) |
0.79 |
0.86 (0.56–1.32) |
0.48 |
| ≥126 mg/dL (≥7.0 mmol/L) |
24/203 |
1.36 (0.87–2.13) |
0.18 |
1.28 (0.80–2.05) |
0.30 |
| Serum HDL cholesterol |
| ≥60 mg/dL (≥1.56 mmol/L) |
41/537 |
1.00 (Ref.) |
|
1.00 (Ref.) |
|
| 40–59 mg/dL (1.03–1.55 mmol/L) |
147/1,478 |
1.26 (0.89–1.79) |
0.19 |
1.36 (0.94–1.96) |
0.10 |
| <40 mg/dL (<1.03 mmol/L) |
42/427 |
1.25 (0.81–1.93) |
0.31 |
1.46 (0.90–2.37) |
0.12 |
| Serum non-HDL cholesterol |
| <150 mg/dL (<3.88 mmol/L) |
108/1,110 |
1.00 (Ref.) |
|
1.00 (Ref.) |
|
| 150–169 mg/dL (3.88–4.39 mmol/L) |
39/437 |
0.83 (0.58–1.21) |
0.34 |
0.82 (0.56–1.19) |
0.29 |
| ≥170 mg/dL (≥4.40 mmol/L) |
83/895 |
0.87 (0.65–1.17) |
0.35 |
0.89 (0.65–1.21) |
0.44 |
| Serum triglycerides |
| <150 mg/dL (<1.69 mmol/L) |
181/1,898 |
1.00 (Ref.) |
|
1.00 (Ref.) |
|
| 150–199 mg/dL (1.69–2.25 mmol/L) |
23/261 |
0.84 (0.54–1.29) |
0.42 |
0.78 (0.50–1.23) |
0.29 |
| ≥200 mg/dL (≥2.26 mmol/L) |
26/283 |
0.91 (0.60–1.38) |
0.65 |
0.68 (0.43–1.09) |
0.11 |
| Body mass index (kg/m2) |
| <18.5 |
17/165 |
1.09 (0.66–1.81) |
0.73 |
|
|
| 18.5–24.9 |
152/1,700 |
1.00 (Ref.) |
|
|
|
| ≥25.0 |
61/577 |
1.31 (0.97–1.77) |
0.07 |
|
|
| Waist circumference |
| <85 cm (men), <90 cm (women) |
143/1,727 |
1.00 (Ref.) |
|
1.00 (Ref.) |
|
| ≥85 cm (men), ≥90 cm (women) |
87/715 |
1.54 (1.17–2.02) |
0.002 |
1.42 (1.06–1.90) |
0.02 |
| eGFR (mL/min/1.73 m2) |
| ≥60 |
211/2,346 |
1.00 (Ref.) |
|
1.00 (Ref.) |
|
| 45–59 |
16/81 |
1.66 (0.98–2.80) |
0.06 |
1.43 (0.83–2.47) |
0.20 |
| <45 |
3/15 |
3.41 (1.08–10.81) |
0.04 |
3.39 (1.05–10.97) |
0.04 |
| History of coronary artery disease¶ |
| (−) |
228/2,431 |
1.00 (Ref.) |
|
1.00 (Ref.) |
|
| (+) |
2/11 |
2.29 (0.57–9.26) |
0.25 |
1.77 (0.42–7.50) |
0.44 |
| Abnormal cardiac murmur |
| (−) |
224/2,412 |
1.00 (Ref.) |
|
1.00 (Ref.) |
|
| (+) |
6/30 |
2.50 (1.10–5.65) |
0.03 |
2.40 (1.01–5.71) |
0.047 |
| High R-wave amplitude on ECG |
| (−) |
185/2,135 |
1.00 (Ref.) |
|
1.00 (Ref.) |
|
| (+) |
45/307 |
1.52 (1.10–2.11) |
0.01 |
1.27 (0.89–1.80) |
0.18 |
| Arrhythmia other than AF |
| (−) |
187/2,210 |
1.00 (Ref.) |
|
1.00 (Ref.) |
|
| (+) |
43/232 |
1.89 (1.35–2.65) |
<0.001 |
1.82 (1.28–2.59) |
<0.001 |
| Smoking status |
| Never smoker |
135/1,483 |
1.00 (Ref.) |
|
1.00 (Ref.) |
|
| Former smoker |
44/344 |
0.93 (0.59–1.44) |
0.73 |
0.88 (0.56–1.40) |
0.59 |
| Current smoker (1–19 cigarettes/day) |
25/354 |
0.73 (0.45–1.20) |
0.22 |
0.75 (0.45–1.24) |
0.26 |
| Current smoker (≥20 cigarettes/day) |
26/261 |
1.10 (0.66–1.85) |
0.71 |
1.09 (0.64–1.85) |
0.76 |
| Alcohol intake |
| Never drinker |
139/1,583 |
1.00 (Ref.) |
|
1.00 (Ref.) |
|
| Former drinker |
10/90 |
1.35 (0.69–2.64) |
0.38 |
1.61 (0.81–3.20) |
0.18 |
| Current drinker (ethanol <34 g/day)§
|
46/442 |
1.27 (0.86–1.88) |
0.22 |
1.17 (0.78–1.75) |
0.44 |
| Current drinker (ethanol ≥34 g/day)§
|
35/327 |
1.37 (0.88–2.13) |
0.17 |
1.36 (0.84–2.21) |
0.21 |
| Regular exercise (days/week) |
| <3 |
200/2,185 |
1.00 (Ref.) |
|
1.00 (Ref.) |
|
| ≥3 |
30/257 |
0.92 (0.62–1.36) |
0.67 |
0.89 (0.59–1.33) |
0.56 |
HR, hazard ratio; CI, confidence interval; AF, atrial fibrillation; HDL, high-density lipoprotein; eGFR, estimated glomerular filtration rate; ECG, electrocardiogram. †Age is adjusted for sex. Sex is adjusted for age. ‡Diastolic blood pressure and body mass index were excluded from the model because of strong correlations with systolic blood pressure and waist circumference, respectively. ¶History of acute or silent myocardial infarction, or coronary revascularization. §Corresponds to 270 mL (1.5 go) of sake (Japanese rice wine) per day.
Table 3.
Risk Prediction Model for Developing Atrial Fibrillation in the Hisayama Study, 1988–2012
| |
HR (95% CI) |
β† |
P value |
Score‡ |
| Age (years) |
| 40–49 |
1.00 (Ref.) |
|
|
0 |
| 50–59 |
1.96 (1.20–3.22) |
0.67347 |
0.008 |
4 |
| 60–69 |
3.62 (2.25–5.82) |
1.28628 |
<0.001 |
8 |
| 70–79 |
10.16 (6.14–16.81) |
2.31823 |
<0.001 |
14 |
| ≥80 |
10.13 (4.45–23.08) |
2.31578 |
<0.001 |
14 |
| Sex |
| Women |
1.00 (Ref.) |
|
|
0 |
| Men |
1.55 (1.18–2.04) |
0.43993 |
0.002 |
3 |
| Systolic blood pressure (mmHg) |
| <120 |
1.00 (Ref.) |
|
|
0 |
| 120–129 |
1.18 (0.75–1.85) |
0.16426 |
0.48 |
1 |
| 130–139 |
1.39 (0.90–2.17) |
0.33232 |
0.14 |
2 |
| 140–159 |
1.46 (0.96–2.23) |
0.37897 |
0.08 |
2 |
| 160–179 |
1.84 (1.10–3.08) |
0.61167 |
0.02 |
4 |
| ≥180 |
2.14 (1.10–4.18) |
0.76184 |
0.03 |
5 |
| Waist circumference |
| <85 cm (men), <90 cm (women) |
1.00 (Ref.) |
|
|
0 |
| ≥85 cm (men), ≥90 cm (women) |
1.44 (1.08–1.91) |
0.36370 |
0.01 |
2 |
| eGFR (mL/min/1.73 m2) |
| ≥60 |
1.00 (Ref.) |
|
|
0 |
| 45–59 |
1.40 (0.81–2.42) |
0.33725 |
0.22 |
2 |
| <45 |
3.16 (0.98–10.13) |
1.14893 |
0.05 |
7 |
| Abnormal cardiac murmur |
| (−) |
1.00 (Ref.) |
|
|
0 |
| (+) |
2.08 (0.89–4.87) |
0.73137 |
0.09 |
4 |
| High R-wave amplitude on ECG |
| (−) |
1.00 (Ref.) |
|
|
0 |
| (+) |
1.30 (0.92–1.83) |
0.25924 |
0.14 |
2 |
| Arrhythmia other than AF |
| (−) |
1.00 (Ref.) |
|
|
0 |
| (+) |
1.80 (1.27–2.53) |
0.58590 |
<0.001 |
4 |
AF, atrial fibrillation; HR, hazard ratio; CI, confidence interval; eGFR, estimated glomerular filtration rate; ECG, electrocardiogram. †The predicted risk of AF at 5 years and 10 years can be calculated using the beta estimate (β) (equal to log-transformed HR) from each risk factor by the formula described in Figure 1. ‡The total score (the sum of the scores from each risk factor) ranged from 0 to 41 points. The predicted risk of AF can be calculated by the formula:
5-year predicted risk of AF (%) = (1−0.99297exp (0.16426 × [total score] − 1.62559)) × 100.
10-year predicted risk of AF (%) = (1−0.98388exp (0.16426 × [total score] − 1.62559)) × 100.
The validity of the risk prediction model was evaluated by Harrell’s c statistics and Greenwood-Nam-D’Agostino χ2
test using the predicted risk of AF at 10 years. The Harrell’s c statistic, a parameter for discrimination, in the original cohort was 0.785 (95% confidence interval [CI]: 0.731–0.840) and the optimism-corrected c statistic based on 200 bootstrap samples was 0.764, indicating that this risk prediction model had a good discrimination ability.
Figure 2
shows the calibration plots for the predicted and observed risks of AF at 10 years across the decile groups of the predicted risk. The predicted risks of AF were very similar to the observed risks of AF at 10 years. A good calibration was statistically confirmed by the Greenwood-Nam-D’Agostino test (χ2=1.27, degrees of freedom=4, P=0.87).

A point-based simple risk score for estimating the 10-year risk of AF was developed, as shown in
Table 3. The total score (the sum of the scores from each risk factor) ranged from 0 to 41 points; for example, a 65-year-old (8 points) man (3 points) with systolic blood pressure of 132 mmHg (2 points) and supraventricular premature contraction (4 points) without other risk factors has a total score of 17 points. His risk of AF over 5 years and 10 years can be predicted as 2.2% and 5.1%, respectively (Table 4). This point-based simple risk score also has a good discrimination ability, with a Harrell’s c statistic of 0.786 (95% CI: 0.731–0.840) at 10 years.
Table 4.
Predicted Risk of Atrial Fibrillation at 5 Years and 10 Years According to the Total Score From Each Risk Factor
Total
score |
5-year
risk (%) |
10-year
risk (%) |
Total
score |
5-year
risk (%) |
10-year
risk (%) |
Total
score |
5-year
risk (%) |
10-year
risk (%) |
| 0 |
0.139 |
0.319 |
14 |
1.375 |
3.138 |
28 |
12.896 |
27.235 |
| 1 |
0.164 |
0.376 |
15 |
1.619 |
3.688 |
29 |
15.017 |
31.249 |
| 2 |
0.193 |
0.443 |
16 |
1.905 |
4.332 |
30 |
17.450 |
35.698 |
| 3 |
0.227 |
0.522 |
17 |
2.241 |
5.086 |
31 |
20.228 |
40.572 |
| 4 |
0.268 |
0.615 |
18 |
2.636 |
5.966 |
32 |
23.383 |
45.844 |
| 5 |
0.315 |
0.724 |
19 |
3.099 |
6.993 |
33 |
26.940 |
51.460 |
| 6 |
0.371 |
0.853 |
20 |
3.642 |
8.189 |
34 |
30.922 |
57.336 |
| 7 |
0.438 |
1.005 |
21 |
4.278 |
9.578 |
35 |
35.336 |
63.355 |
| 8 |
0.516 |
1.183 |
22 |
5.023 |
11.189 |
36 |
40.178 |
69.367 |
| 9 |
0.607 |
1.393 |
23 |
5.892 |
13.051 |
37 |
45.421 |
75.199 |
| 10 |
0.715 |
1.639 |
24 |
6.907 |
15.195 |
38 |
51.013 |
80.664 |
| 11 |
0.842 |
1.929 |
25 |
8.089 |
17.653 |
39 |
56.873 |
85.580 |
| 12 |
0.992 |
2.270 |
26 |
9.463 |
20.460 |
40 |
62.885 |
89.795 |
| 13 |
1.168 |
2.669 |
27 |
11.055 |
23.645 |
41 |
68.904 |
93.210 |
Discussion
In the present study, we developed a new risk prediction model for incident AF using long-term follow-up data from a rural Japanese community. This risk prediction model consisted of 8 risk factors that are commonly measured at clinical practice or health examinations — namely, age, sex, systolic blood pressure, waist circumference, eGFR, abnormal cardiac murmur, high R-wave amplitude on ECG, and arrhythmia other than AF on ECG — and this model showed a good internal validity for predicting the risk of AF. Therefore, this risk prediction model may enable us to efficiently detect individuals at higher risk of future AF, for whom the careful evaluation of AF, either by frequent 12-lead ECG or ambulatory monitoring ECG, is necessary to detect AF as early as possible and to reduce the risk of AF-related complications such as ischemic stroke, coronary artery disease, and heart failure. Furthermore, the risk prediction model developed in the present study included some modifiable risk factors, such as high blood pressure, abdominal obesity, and kidney dysfunction. Modification of lifestyles (i.e., favorable diet and exercise) and optimal treatment for risk factors (i.e., medication for high blood pressure or hyperglycemia as a treatment for hypertension or the prevention of kidney dysfunction) are likely to be beneficial to reduce the future risk of AF.
Risk prediction models created using the longitudinal data from population-based cohort studies with detailed baseline information and comprehensive follow-up data, such as repeated ECG examinations, are effective for detecting individuals at higher risk of AF in a community. Some population-based studies in Western countries have developed risk prediction models for incident AF, such as the Framingham Heart Study,5
the Atherosclerosis Risk in Communities Study,6
the Women’s Health Study,7
and the Cohorts for Heart and Aging Research in Genomic Epidemiology AF Consortium.8
However, these Western models are not always applicable to Japanese populations, which have different genetic, environmental, and lifestyle backgrounds than their Western counterparts. In Asia, some risk prediction models for incident AF have been created based on the medical database in China22
and the hospital-based data in Japan,23
but these models were likely to have biases, such as detection bias22
or healthy screenee bias.23
At present, only 1 population-based study conducted in an urban area of Japan, the Suita Study, has reported the risk score for incident AF.10
In the Suita Study, age, sex, systolic hypertension, overweight (defined by BMI), excessive drinking, current smoking, serum non-HDL cholesterol, arrhythmia other than AF, coronary artery disease, and cardiac murmur were selected as predictors for future onset of AF and included in the risk score.10
Five of 10 of these risk factors (age, sex, systolic hypertension, arrhythmia other than AF, and cardiac murmur) are commonly documented parameters and thus were included in the risk prediction model developed in the present study.
Aging is a well-established risk factor for developing AF,24
probably because the influence of other risk factors accumulates with advanced age, and electrical and structural remodeling of the heart are considered to be irreversible. Several observational studies, including ours, have reported that the risk of AF is higher in men than in women.5,10,23,24
The precise reason for the sex difference remains unclear, but men may be at higher risk of AF than women because men tend to have more cardiovascular risk factors than women. However, men have a significantly higher risk of AF than women even after adjustment for multiple risk factors, indicating that unmeasured residual confounders might exist in the sex difference.
Electrical and structural remodeling of the heart are known to be key mechanisms for AF.25,26
Hypertension and elevated blood pressure are established modifiable risk factors for developing AF.17,24,27,28
Hypertension or blood pressure has been included in the risk prediction models for incident AF in previous studies,5-8,10,22,23
and systolic blood pressure was included in our present model. Hemodynamic changes and activation of the renin-angiotensin system are considered to be major mechanisms linking hypertension and AF through structural changes such as atrial fibrosis and myocytes hypertrophy.24
High R-wave amplitude (or left ventricular hypertrophy) on ECG, a characteristic finding in patients with hypertensive heart disease and hypertrophic cardiomyopathy, has been included in some risk prediction models for incident AF,6,8,23
including ours, suggesting that high R-wave amplitude on ECG is a good marker for structural abnormality of the heart. Abnormal cardiac murmur, a surrogate marker for valvular heart diseases,17
has been included in some risk prediction models for incident AF,5,6,10,23
including ours. Atrial load caused by valvular diseases, such as mitral stenosis and regurgitation, has been associated with structural and electrical remodeling in the left atrium, resulting in the development of AF.26
Arrhythmia other than AF was also a significant risk factor for AF in the Suita Study10
and the present study. As shown in
Supplementary Table 2, atrioventricular block, supraventricular or ventricular premature beats, and sinus bradycardia were major arrhythmia subtypes in the present study. Some studies have reported that atrioventricular block is a risk factor for AF, probably due to conduction delay in the atrium.5,8,23,29,30
Atrial premature complex has been reported to be a risk factor23,31,32
or a surrogate marker33
for AF, and has been considered an acute trigger for AF.33
Ventricular premature complex has also been associated with AF risk.23,32
Sinus bradycardia23
and sick sinus syndrome34–37
may reflect sinus node dysfunction and atrial remodeling, resulting in the development of AF. Coronary artery disease and myocardial infarction are also established risk factors of incident AF17,24,28
and have been included in some risk prediction models.6,8,10,22
However, these parameters were not selected for inclusion in our risk prediction model probably due to a lack of statistical power.
Obesity and overweight are known to be associated with high blood pressure,38
which in turn results in left ventricular hypertrophy and enlargement of the left atrium.28,39
Abdominal obesity or metabolic syndrome may be associated with cardiac remodeling through inflammation, oxidative stress, and mechanical stress.40
In the present study, a larger waist circumference, an index for abdominal obesity, was a significant risk factor for AF, but no clear association was observed between BMI and the risk of AF. The precise reason for this finding is unknown, but abnormal fat distribution may be associated with AF even in people with normal BMI.24
Chronic kidney disease has been reported to be a risk factor for AF in previous observational studies.24,41,42
Reduced eGFR, a clinical measure for kidney dysfunction, was associated with AF risk in the present study. Kidney dysfunction causes hypertension, increased circulation blood volume, and activation of the renin-angiotensin system, and may result in cardiac remodeling.24
In the present study, some previously reported risk factors for AF, such as diabetes, lipid profiles, and lifestyle factors (i.e., smoking, alcohol intake, and exercise), were not significantly associated with the risk of AF. However, the previous findings of an association between these risk factors and the risk of AF were inconsistent.24,28
Lower levels of serum non-HDL cholesterol were a significant risk factor for incident AF in the Suita Study.10
In the present study, the AF risk tended to decrease with higher non-HDL cholesterol levels, but the association was not statistically significant. Alcohol intake was reported to be a risk factor for incident AF in some studies.7,10,23
In our present analysis, the risk of AF tended to increase with alcohol intake in men, but the association was not statistically significant and no clear evidence of heterogeneity between sexes was observed (Supplementary Table 1). The reasons for the different conclusions among the studies are unclear, and further accumulation of epidemiological evidence will be needed to establish an association between these factors and the risk of AF.
Some limitations of the present study should be considered. First, our follow-up survey was primarily dependent on a standard 12-lead ECG at the annual health examinations. Long-term ECG recordings, which are a more effective tool for the detection of AF, were not routinely performed. In addition, the subjects with a higher predicted risk of AF, who had a greater accumulation of cardiovascular risk factors, were likely to visit clinics or hospitals more frequently and thus might have a greater chance of being diagnosed with AF by standard or long-term ECG examinations compared to the subjects with lower predicted risk of AF. Second, morphological and functional evaluations of the heart, such as echocardiography and measurement of the blood concentrations of natriuretic peptides, and unmeasured risk factors of AF, such as hyperthyroidism, chronic obstructive pulmonary disease, and sleep apnea,24
were not available in the present study. More accurate prediction of AF risk might have been possible if such information was available. Third, 243 subjects were excluded from the present study because of missing information at baseline or during the follow up. The baseline characteristics of the excluded subjects were different from those of the subjects analyzed in the present study (Supplementary Table 3). However, the risk prediction model developed in the present study showed good performance even in a sensitivity analysis in which missing variables at baseline were imputed by the data obtained in the health examinations on other occasions (data not shown). Fourth, the numbers of subjects with certain risk factors, such as severe kidney dysfunction, history of coronary artery disease, and abnormal cardiac murmur, were low. Therefore, the risk estimates for these variables may be somewhat inaccurate. More accurate risk estimations for these variables may be possible in larger population-based studies. Fifth, the present study was based on a single measurement of each potential risk factor at baseline, and the variability of risk factors and the influence of lifestyle modifications or medical treatment during the follow up were not taken into consideration. The risk estimates in the present study might thus be biased toward the null hypothesis. However, risk prediction models are usually used for the estimation of future risk of diseases on the basis of data collected at a single time point at baseline. Therefore, we did not consider the variability during the follow up. Finally, the present risk prediction model was not validated using external cohorts. In the future, it will be necessary to externally validate this model in various regions in Japan, although we observed sufficient predictive ability by internal validation using 200 bootstrap samples (optimism-corrected c-statistic, 0.764).
In conclusion, a new risk prediction model for new onset AF was developed using a cohort of a Japanese population. The present risk prediction model may be a useful tool for detecting individuals at higher risk of AF and for management of modifiable risk factors of AF, resulting in better prevention of AF and AF-related complications.
Acknowledgments
The authors thank the residents of the town of Hisayama for their participation in the survey and the staff of the Division of Health of Hisayama for their cooperation with this study. The statistical analyses were carried out using the computer resources offered under the category of General Projects by the Research Institute for Information Technology, Kyushu University.
This study was supported, in part, by a Grant-in-Aid for Scientific Research (A) (JP16H02692), (B) (JP17H04126, JP18H02737 and JP19H03863), and (C) (JP18K07565, JP18K09412, JP19K07890, JP20K10503, and JP20K11020), a Grant-in-Aid for Early-Career Scientists (JP18K17925), and a Grant-in-Aid for Research Activity Start-up (JP19K23971) from the Ministry of Education, Culture, Sports, Science and Technology of Japan; by a Health and Labour Sciences Research Grant of the Ministry of Health, Labour and Welfare of Japan (20FA1002); and by the Japan Agency for Medical Research and Development (JP19ek0210082, JP19ek0210083, JP20dk0207025, JP20 km0405202, and JP20fk0108075).
Disclosures
The authors declare that there are no conflicts of interest. T.K. is an Associate Editor of
Circulation Journal.
IRB Information
The protocol of the present study was approved by the Kyushu University Institutional Review Board for Clinical Research (reference number: 2019-499).
Data Availability
The deidentified participant data will not be shared.
Supplementary Files
Please find supplementary file(s);
http://dx.doi.org/10.1253/circj.CJ-20-0794
References
- 1.
Osawa M, Okayama A, Sakata K, Kato K, Itai K, Onoda T, et al. Rapid increase in estimated number of persons with atrial fibrillation in Japan: An analysis from National Surveys on Cardiovascular Diseases in 1980, 1990 and 2000. J Epidemiol 2005; 15: 194–196.
- 2.
Odutayo A, Wong CX, Hsiao AJ, Hopewell S, Altman DG, Emdin CA. Atrial fibrillation and risks of cardiovascular disease, renal disease, and death: Systematic review and meta-analysis. BMJ 2016; 354: i4482.
- 3.
Wilson PW, D’Agostino RB, Levy D, Belanger AM, Silbershatz H, Kannel WB. Prediction of coronary heart disease using risk factor categories. Circulation 1998; 97: 1837–1847.
- 4.
Honda T, Yoshida D, Hata J, Hirakawa Y, Ishida Y, Shibata M, et al. Development and validation of modified risk prediction models for cardiovascular disease and its subtypes: The Hisayama Study. Atherosclerosis 2018; 279: 38–44.
- 5.
Schnabel RB, Sullivan LM, Levy D, Pencina MJ, Massaro JM, D’Agostino RB Sr, et al. Development of a risk score for atrial fibrillation (Framingham Heart Study): A community-based cohort study. Lancet 2009; 373: 739–745.
- 6.
Chamberlain AM, Agarwal SK, Folsom AR, Soliman EZ, Chambless LE, Crow R, et al. A clinical risk score for atrial fibrillation in a biracial prospective cohort (from the Atherosclerosis Risk in Communities [ARIC] Study). Am J Cardiol 2011; 107: 85–91.
- 7.
Everett BM, Cook NR, Conen D, Chasman DI, Ridker PM, Albert CM. Novel genetic markers improve measures of atrial fibrillation risk prediction. Eur Heart J 2013; 34: 2243–2251.
- 8.
Alonso A, Krijthe BP, Aspelund T, Stepas KA, Pencina MJ, Moser CB, et al. Simple risk model predicts incidence of atrial fibrillation in a racially and geographically diverse population: The CHARGE-AF Consortium. J Am Heart Assoc 2013; 2: e000102.
- 9.
Himmelreich JCL, Veelers L, Lucassen WAM, Schnabel RB, Rienstra M, van Weert HCPM, et al. Prediction models for atrial fibrillation applicable in the community: A systematic review and meta-analysis. Europace 2020; 22: 684–694.
- 10.
Kokubo Y, Watanabe M, Higashiyama A, Nakao YM, Kusano K, Miyamoto Y. Development of a basic risk score for incident atrial fibrillation in a Japanese general population: The Suita Study. Circ J 2017; 81: 1580–1588.
- 11.
Ninomiya T. Japanese legacy cohort studies: The Hisayama Study. J Epidemiol 2018; 28: 444–451.
- 12.
Ohmura T, Ueda K, Kiyohara Y, Kato I, Iwamoto H, Nakayama K, et al. Prevalence of type 2 (non-insulin-dependent) diabetes mellitus and impaired glucose tolerance in the Japanese general population: The Hisayama Study. Diabetologia 1993; 36: 1198–1203.
- 13.
Nagata T, Hata J, Sakata S, Oishi E, Honda T, Furuta Y, et al. Serum N-terminal pro-B-type natriuretic peptide as a predictor for future development of atrial fibrillation in a general population: The Hisayama Study. Int J Cardiol 2020; 320: 90–96.
- 14.
Alberti KG, Eckel RH, Grundy SM, Zimmet PZ, Cleeman JI, Donato KA, et al. Harmonizing the metabolic syndrome: A joint interim statement of the International Diabetes Federation Task Force on Epidemiology and Prevention; National Heart, Lung, and Blood Institute; American Heart Association; World Heart Federation; International Atherosclerosis Society; and International Association for the Study of Obesity. Circulation 2009; 120: 1640–1645.
- 15.
Nagata M, Ninomiya T, Doi Y, Yonemoto K, Kubo M, Hata J, et al. Trends in the prevalence of chronic kidney disease and its risk factors in a general Japanese population: The Hisayama Study. Nephrol Dial Transplant 2010; 25: 2557–2564.
- 16.
Horio M, Imai E, Yasuda Y, Watanabe T, Matsuo S. Modification of the CKD epidemiology collaboration (CKD-EPI) equation for Japanese: Accuracy and use for population estimates. Am J Kidney Dis 2010; 56: 32–38.
- 17.
Benjamin EJ, Levy D, Vaziri SM, D’Agostino RB, Belanger AJ, Wolf PA. Independent risk factors for atrial fibrillation in a population-based cohort: The Framingham Heart Study. JAMA 1994; 271: 840–844.
- 18.
Prineas RJ, Crow RS, Zhang ZM. The Minnesota Code manual of electrocardiographic findings, 2nd edn. London: Springer-Verlag; 2010.
- 19.
Sullivan LM, Massaro JM, D’Agostino RB Sr. Presentation of multivariate data for clinical use: The Framingham Study risk score functions. Stat Med 2004; 23: 1631–1660.
- 20.
Harrell FE Jr, Lee KL, Mark DB. Multivariable prognostic models: Issues in developing models, evaluating assumptions and adequacy, and measuring and reducing errors. Stat Med 1996; 15: 361–387.
- 21.
Demler OV, Paynter NP, Cook NR. Tests of calibration and goodness-of-fit in the survival setting. Stat Med 2015; 34: 1659–1680.
- 22.
Li YG, Pastori D, Farcomeni A, Yang PS, Jang E, Joung B, et al. A simple clinical risk score (C2HEST) for predicting incident atrial fibrillation in Asian subjects: Derivation in 471,446 Chinese subjects, with internal validation and external application in 451,199 Korean subjects. Chest 2019; 155: 510–518.
- 23.
Hamada R, Muto S. Simple risk model and score for predicting of incident atrial fibrillation in Japanese. J Cardiol 2019; 73: 65–72.
- 24.
Li Y, Pastori D, Guo Y, Wang Y, Lip GYH. Risk factors for new-onset atrial fibrillation: A focus on Asian populations. Int J Cardiol 2018; 261: 92–98.
- 25.
Allessie M, Ausma J, Schotten U. Electrical, contractile and structural remodeling during atrial fibrillation. Cardiovasc Res 2002; 54: 230–246.
- 26.
Sanders P, Morton JB, Davidson NC, Spence SJ, Vohra JK, Sparks PB, et al. Electrical remodeling of the atria in congestive heart failure: Electrophysiological and electroanatomic mapping in humans. Circulation 2003; 108: 1461–1468.
- 27.
Conen D, Tedrow UB, Koplan BA, Glynn RJ, Buring JE, Albert CM. Influence of systolic and diastolic blood pressure on the risk of incident atrial fibrillation in women. Circulation 2009; 119: 2146–2152.
- 28.
Kokubo Y, Matsumoto C. Traditional cardiovascular risk factors for incident atrial fibrillation. Circ J 2016; 80: 2415–2422.
- 29.
Uhm JS, Shim J, Wi J, Mun HS, Park J, Park SH, et al. First-degree atrioventricular block is associated with advanced atrioventricular block, atrial fibrillation and left ventricular dysfunction in patients with hypertension. J Hypertens 2014; 32: 1115–1120.
- 30.
Zhao X, Sun C, Cao M, Li H. Atrioventricular block can be used as a risk predictor of clinical atrial fibrillation. Clin Cardiol 2019; 42: 452–458.
- 31.
Acharya T, Tringali S, Bhullar M, Nalbandyan M, Ilineni VK, Carbajal E, et al. Frequent atrial premature complexes and their association with risk of atrial fibrillation. Am J Cardiol 2015; 116: 1852–1857.
- 32.
Watanabe H, Tanabe N, Makiyama Y, Chopra SS, Okura Y, Suzuki H, et al. ST-segment abnormalities and premature complexes are predictors of new-onset atrial fibrillation: The Niigata Preventive Medicine Study. Am Heart J 2006; 152: 731–735.
- 33.
Kumarathurai P, Mouridsen MR, Mattsson N, Larsen BS, Nielsen OW, Gerds TA, et al. Atrial ectopy and N-terminal pro-B-type natriuretic peptide as predictors of atrial fibrillation: A population-based cohort study. Europace 2017; 19: 364–370.
- 34.
Ishikawa T, Ohno S, Murakami T, Yoshida K, Mishima H, Fukuoka T, et al. Sick sinus syndrome with HCN4 mutations shows early onset and frequent association with atrial fibrillation and left ventricular noncompaction. Heart Rhythm 2017; 14: 717–724.
- 35.
Sanders P, Morton JB, Kistler PM, Spence SJ, Davidson NC, Hussin A, et al. Electrophysiological and electroanatomic characterization of the atria in sinus node disease: Evidence of diffuse atrial remodeling. Circulation 2004; 109: 1514–1522.
- 36.
Jackson LR 2nd, Rathakrishnan B, Campbell K, Thomas KL, Piccini JP, Bahnson T, et al. Sinus node dysfunction and atrial fibrillation: A reversible phenomenon? Pacing Clin Electrophysiol 2017; 40: 442–450.
- 37.
Lee JM, Kalman JM. Sinus node dysfunction and atrial fibrillation: Two sides of the same coin? Europace 2013; 15: 161–162.
- 38.
de Simone G, Devereux RB, Chinali M, Roman MJ, Best LG, Welty TK, et al. Risk factors for arterial hypertension in adults with initial optimal blood pressure: The Strong Heart Study. Hypertension 2006; 47: 162–167.
- 39.
Kokubo Y, Watanabe M, Higashiyama A, Nakao YM, Kobayashi T, Watanabe T, et al. Interaction of blood pressure and body mass index with risk of incident atrial fibrillation in a Japanese urban cohort: The Suita Study. Am J Hypertens 2015; 28: 1355–1361.
- 40.
Watanabe H, Tanabe N, Watanabe T, Darbar D, Roden DM, Sasaki S, et al. Metabolic syndrome and risk of development of atrial fibrillation: The Niigata Preventive Medicine Study. Circulation 2008; 117: 1255–1260.
- 41.
Alonso A, Lopez FL, Matsushita K, Loehr LR, Agarwal SK, Chen LY, et al. Chronic kidney disease is associated with the incidence of atrial fibrillation: The Atherosclerosis Risk in Communities (ARIC) Study. Circulation 2011; 123: 2946–2953.
- 42.
Watanabe H, Watanabe T, Sasaki S, Nagai K, Roden DM, Aizawa Y. Close bidirectional relationship between chronic kidney disease and atrial fibrillation: The Niigata Preventive Medicine Study. Am Heart J 2009; 158: 629–636.
